Some investors are questioning how much further this year’s rally can run with the S&P 500 Index up 12.3% through the first eight months of the year. Encouragingly, history suggests that strong starts tend to persist; when the S&P 500 has gained more than 10% through August it has advanced from September through December in 25 of 28 instances, an 89% positive hit rate.
Occasionally, we are confronted with decisions where there are no easy options. The prevailing circumstances bound our choices, and we may face criticism no matter what we do. Collectively, the Federal Open Market Committee (FOMC) finds itself in just such a situation as it prepares for its upcoming meeting.
The recent employment report provided reassurance that the US labor market remains resilient. The economy added 162,000 jobs in August; the previous two months’ gains were revised higher by a combined 55,000, and the unemployment rate held steady at 4.1%.
How can investors recognize when a stock is severely overvalued—and decide whether it may be time to take profits?In this video, Chuck Carnevale, co-founder of FAST Graphs and “Mr. Valuation,” examines 22 popular stocks that appear overvalued or have recently begun correcting.
Investors can’t get enough of ultrashort bonds. Driven by concerns over high equity valuations and rate volatility as the U.S. Federal Reserve mulls over the direction of interest rates, capital preservation strategies appear to be the elixir to help ease uncertainty. As such, ultrashort bonds have been seeing greater demand as traditional safe havens fall short on yield or carry unwanted duration risk.
There is so much going on, it is hard to know where to begin. The data is all over the place. I had a long and epic dinner in New York with David Bahnsen, Rene Aninao, and Brian Syztel which has my mind buzzing with ideas and new concepts.
One or a few high-performing stocks can provide a big boost to portfolio values. But they’re hard to come by and often struggle to maintain their momentum over time. Because these stocks increase portfolio concentration, investors must balance the risk of overexposure against the tax cost of diversifying. A thoughtful, tax-aware plan may help bring portfolios back in line.
With a handful of stocks attracting most of the recent headlines, it’s easy to forget that investors continue to find opportunities across a broad range of sectors.
US convertible bond sales have reached their highest annual total on record, according to data compiled by Bloomberg, as companies look to fund heavy artificial intelligence-related spending.
US stocks fell for a fourth straight day, their longest slide since June, as the relentless climb in oil prices and fresh evidence of sticky inflation boosted Treasury yields and bets the Federal Reserve will lift interest rates.
A quarter-century after the Sept. 11, 2001, terror attacks, families returned to the World Trade Center site on Friday to read aloud the names of the dead, marking a milestone anniversary of a tragedy that reshaped America.
A key gauge of US consumer prices rose by more than expected last month, bolstering the case for Federal Reserve officials to raise interest rates next week.
As wealth management firms scale, sustained organic growth increasingly depends on strong business leadership. Firms that build scalable client acquisition strategies, develop talent and create operational infrastructure can position themselves to grow beyond founder-led models and capitalize on the industry’s long-term opportunities.
History suggests slower Fed tightening tends to support stronger market returns and firmer economic growth, while faster hikes typically deepen drawdowns.
In this article, Russ Koesterich argues that momentum remains supported by strong earnings growth, making the factor attractive despite market risks.
2026 began with 10-year Treasuries right around 4%, which many viewed as a comfortable place. The comfort came from some simple math—2 plus 2 equals 4. The long-term real yield on the 10-year Treasury was around 2% and the Fed’s inflation target is 2%.
Market volatility persisted in August as investors were again forced to reassess escalating tensions and an exchange of military strikes in the Middle East, while softer labor-market data was countered by mixed inflation readings.
With so much attention focused on what the Federal Reserve (Fed) might do at its policy meeting next week, it’s a good time to look back at history to get a sense of how stocks might respond should the Fed hike rates as the market (barely) expects.
Benchmark-Free has been a flagship strategy for half of GMO's history. As we approach our 50th anniversary in 2027, Ben Inker reflects on our first 25 years of Benchmark-Free investing.
Elevated interest rates have investors scrambling for yield, and munis have been ready to answer the call with tax-exempt income.
Federal Reserve officials have signaled they’re prepared to raise interest rates if inflation doesn’t improve soon, but they may find their main policy tool will do little to restrain some of the forces pushing up prices now.
Gold hovered near $4,400 an ounce, as traders awaited US inflation data due later this week for clues as to whether the Federal Reserve will hike interest rates this month.
The midterm election season has entered its final stretch, and Wall Street is busy drawing up game plans for a range of scenarios. Yet, in a fortuitous turn of events, the best outcome for markets is also looking like the likeliest one.
Brent oil spiked to $105 a barrel as rising tensions in the Middle East heightened concerns over global supplies.
For much of the past decade and a half, investors saw little reason to favor bonds over equities. Yields were low and returns were muted, especially in passive strategies. Equities seemed to offer a much clearer path to long-term capital appreciation. For many investors, bonds were, at best, ballast: a dull but generally stable component of a broader portfolio. Then the experience of 2022 had investors questioning even that view, as areas of high quality fixed income generated equity-like losses that eroded much of the prior decade’s real return.
As students get closer to making a final college decision, the last two years of high school are particularly important. Parents will want to review their financial strategy to meet the costs of college, including a review of current savings, financial and merit aid, scholarships and loan options.
The August employment report was much stronger than expected and reinforces my view that the U.S. economy remains remarkably resilient. Payrolls increased by 162,000, above every estimate, while revisions added another 55,000 jobs to the previous two months. The workweek increased by one-tenth of an hour, the household survey was extremely strong, and the participation rate finally moved higher.
On Friday, the August U.S. employment report surprised to the upside, with 162,000 jobs added during the month. Year to date, the labor market has shown impressive resilience, with hiring also becoming more balanced across sectors than in previous years.
Before Friday’s jobs report, it was roughly a toss-up in the financial markets whether the Fed would raise rates at the next meeting in mid-September. Now, the odds favor a rate hike and it’s not hard to see why.
When markets become volatile, many investors gravitate toward assets they perceive as “safe.” Cash, certificates of deposit (CDs), money market funds, U.S. Treasury securities, and high-quality bonds can all play an important role in a diversified portfolio. But “safe” doesn’t necessarily mean “risk-free.”
LPL Research analyzes rising U.S. debt, Treasury yields, and fiscal trends, highlighting implications for markets and investors.
Target-date funds have become a staple qualified default investment alternative (QDIA) because they help participants invest appropriately without requiring them to act. But as retirement nears, income needs become more pressing and financial situations diverge—a situation dynamic defaults seek to address.
Brent crude oil rose above $100 a barrel for the first time since July, while the U.S. benchmark West Texas Intermediate (WTI) crossed $95, with varying impacts on energy ETFs. The price surge followed escalation in the Middle East conflict, including U.S. military strikes on five Iranian oil tankers and Houthi attacks on Saudi energy facilities.
From an earnings perspective, this summer proved to be a largely fruitful one for many companies within the S&P 500.
The alternative is to be proactive by helping a grieving client name and address the financial concerns that loss creates, without ever rushing them. Doing that well takes two things: an understanding of how grief actually unfolds and a deliberate process for the conversation itself.
As clients come to advisory shops more informed, due to the plethora of financial advice available online, firms will need to be able to “stress test the information or bias” they arrive with. A comprehensive team, with training across advisory areas, can offer clients more depth of service.
When navigating leadership decisions that leave a team feeling underappreciated, offering benefit of the doubt can reduce personal frustration and help maintain productive daily interactions.
Every year, Americans send hundreds of billions of dollars of retirement savings to life insurers in return for annuities that promise a future income. It’s an industry built on trust and prudence.
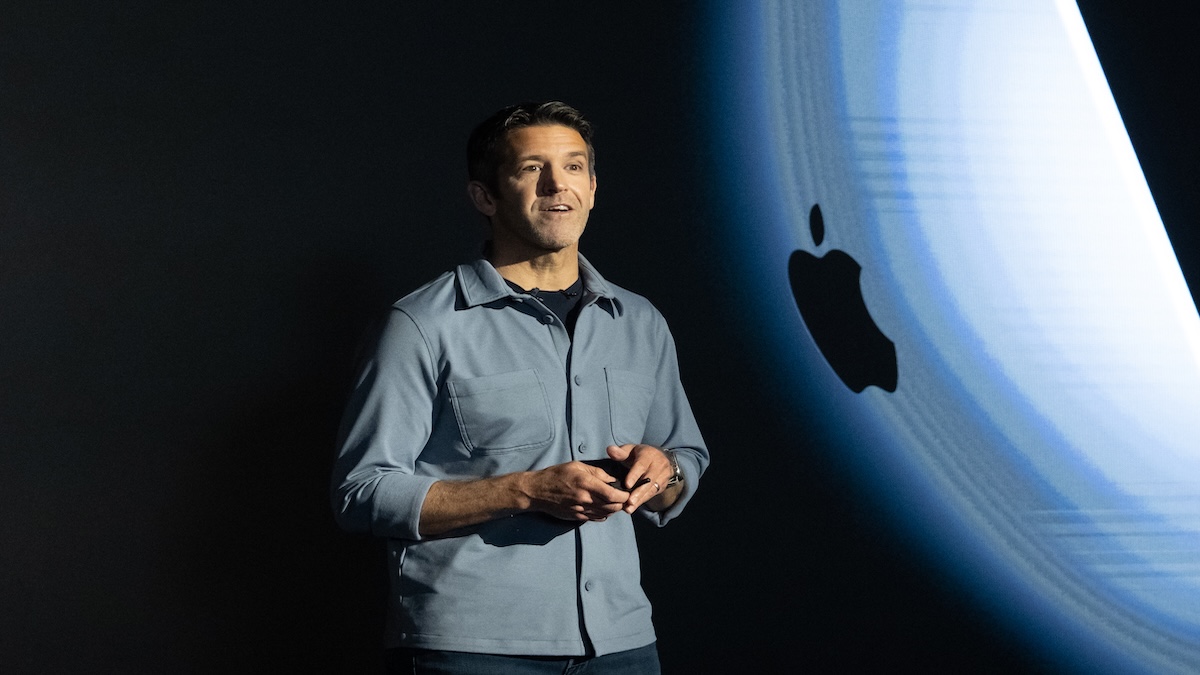
Apple Inc.’s $570 billion summer surge is saddling new Chief Executive Officer John Ternus with high expectations heading into the company’s most anticipated event in years: the unveiling of the foldable iPhone on Wednesday.
Defiance ETFs has submitted paperwork to the US Securities and Exchange Commission for a series of leveraged funds that would seek to double the moves of some individual stocks — over periods measured in just hours, rather than days.
Donald Trump’s pledge to ensure that Bitcoin mining activity is centered in the US is rapidly disintegrating under the twin forces of the artificial intelligence boom and a prolonged crypto slump.
Chapter 3 of this series ended with a simple question. If the math so plainly says avoid big losses, respect valuations, and mind your timing, why does so much of the industry preach the opposite?
Equity markets can be as difficult to forecast as the weather, yet investors often assume future return patterns will predictably follow recent trends. In today’s turbulent market climate, we think fundamental research can help investors build conviction in long-term company forecasts that may be obscured by the AI-driven cloud cover.
Labor Day signals more than summer’s end. It marks a return of focus to the economic and market forces that will shape the remainder of the year. From resilient earnings and record AI spending to rising bond yields and the midterm elections, there is no shortage of forces shaping the market outlook.
If you’re planning on driving anywhere this Labor Day weekend, be prepared to pay the highest gas prices ever for this time of year. The national average hit $4.14 per gallon on Thursday, an approximately 30% increase from last year, according to AAA.
Bond markets around the world have trembled in the last week, as uncertainty continues to rise. A mix of geopolitical, trade, debt, and currency pressures have put immense pressure on yields. The Yen carry trade situation alone has soaked bond markets, but when combined with U.S. debt fears and Hormuz concerns, the picture has shifted.
To kick off our fourth season of the Alternative Allocations podcast series, I sat down with John Bowman, CEO of CAIA Association, to explore the massive changes underway across our industry. John and I discussed CAIA’s seminal paper “The World Rewired,” and the implications for private markets.
The Federal Reserve has spent the past four years trying to cool price increases through higher interest rates. The federal funds rate is still well above its pre-pandemic average, mortgage rates remain elevated, and borrowing costs for households and businesses are considerably higher than they were in the era of ultra-low interest rates.
Oil prices climbed further Tuesday, with Brent crude rising 1% to $97.95 a barrel and briefly touching $99.46, according to the Associated Press. The benchmark has climbed from around $72 over the past two months. Fighting tied to the war with Iran has clouded hopes for reopening the Strait of Hormuz to tankers.
The S&P 500 gained 2.7% in August 2026 and four indexes hit all-time highs, but only five of eleven sectors rose and the Fed’s speech at Jackson Hole put a rate hike back on the table.