Mountain, Cliff, or Ocean
Membership required
Membership is now required to use this feature. To learn more:
View Membership Benefits
Stock markets can be valued, and because they can be valued, the long-term risks involved in holding stocks vary from time to time. When stocks are cheap these risks are small, but when they are expensive the risks become very great indeed. In current conditions, the risks in holding stocks are too great to make them sensible investments. This approach is completely different than claiming that it is possible to know when the stock market has hit a peak or a trough. All that the ability to value stocks provides is the ability to assess when holding them becomes too risky. On every occasion in the past that we can find, when a stock market has become as overvalued as Wall Street was at the end of the twentieth century, the consequences have been extremely bad for the economy as well as for investors.– Andrew Smithers & Steven Wright, Valuing Wall Street, March 2000
The current level of stock market valuations remains – easily – the most speculative extreme in U.S. financial history, beyond both the 1929 and 2000 extremes. Our baseline estimate is that the S&P 500 has a material risk of losing something on the order of 75% over the completion of this cycle, a view that’s shared by GMO’s Jeremy Grantham. We can narrow that baseline estimate to a loss of about 55% if we assume that the robust profit margins of the past decade are permanent. We don’t assume that, but then, we actually don’t need to assume anything at all.
On that point, we remain as emphatic as usual: Nothing in our investment discipline relies on a retreat in valuations toward their historical norms, nor any retreat at all. Indeed, our investment stance has been at least briefly constructive (albeit with a safety net) even in recent weeks. As I wrote in February and May, I expect that to be a regular occurrence going forward, even at present valuations, whether this bubble ultimately collapses or continues higher forever. For more detail on that flexibility – on the interbeing of roses and garbage even in the financial markets – see How I Learned to Love the Bubble (Even Before it Bursts), and (More) Roses Amid Garbage and Trap Doors.
Our estimate of 55-75% downside risk is just that: a downside risk estimate. What, then, is our forecast? We don’t need one. We can use historically-informed valuation measures and risk estimates without making our investment stance dependent on any of them. Mountain, cliff, or ocean in the distance, we choose our footing for the terrain beneath us. Rather than attaching ourselves to forecasts and views, we’re content to respond with our best mindfulness as the evidence changes.
In the financial markets, as always, we consider the return/risk profile associated with the market conditions we observe, and our actions reflect that, but the effect of our February/May “roses and garbage” adaptation is to give more nuance, and therefore more flexibility, to that mapping from market conditions to investment actions.
For example, historically, it was enough to classify periods of extreme valuations and unfavorable market internals as speculative “trap door” conditions, and indeed, those conditions tended to be followed by steep market losses, on average. But underneath that “on average” were numerous shorter periods when various combinations of bullish sentiment, short-term market retreat, measures of speculative confidence, and other factors were followed by brief and often powerful market advances with striking consistency.
As I observed in May, these brief constructive periods, taken together, typically account for the entire cumulative market advance during speculative periods, and they often capture striking interim rebounds that punctuate the collapses that follow. We always use safety nets when our measures of market internals are unfavorable, but provided those safety nets are in place, these constructive instances allow us much more flexibility in our investment stance than we previously imagined. Reviewing them across history is actually a bit uncomfortable, because like the old commercials, I keep thinking “Ah! I could have had a V8!”. Of course, that’s the nature of a good research finding. Still, it’s enough to know there will be numerous opportunities going forward.
With hindsight this seems obvious, yet it is striking how in both physics and mathematics there is a lack of proportion between the effort needed to understand something for the first time and the simplicity and naturalness of the solution once all the required stages have been completed. In the sciences as in poetry, there is hardly a trace in the finished product of the arduous work that the creative process has demanded, or of the doubts and hesitations that have been overcome in order to achieve it.
– Nobel physicist Giorgio Parisi, In a Flight of Starlings, 2023
As a small, simple example, consider the behavior of the S&P 500 after a weekly decline of say, 2-3% or more. While the market tends to rebound – on average – by a fraction of a percent over the following week, the market only gains about half the time. However, if the original loss occurs when bearish sentiment is extremely low, the average market rebound over the following week is more consistent, and about six times larger, than when bearish sentiment is middling. Even more striking, if the original loss occurs amid extremely low bearish sentiment as well as unfavorable internals, the subsequent rebound is about 14 times larger than usual. The reason is that rebounds during periods of ragged internals tend to be “fast and furious”. Meanwhile, even though deteriorating internals suggest that intermediate-term risk-aversion is already setting in, extremely low bearish sentiment reveals investor psychology that’s still inclined to chase short-term dips.
The chart below shows the cumulative total return of the S&P 500 based on the return/risk classifications that we’ve adopted into our current investment discipline. The chart covers the period since September 2024, because that was the core “Aha!” – which we then extended in February and May of this year. The 2024 adaptation enabled us to more systematically vary the intensity of our bearish investment positions. The more recent extension allows us, in many cases, to reverse our hedges to a constructive stance (albeit with a safety net). These total return profiles look the same whether we look back to 2021, 2000, 1940, or 1928. For a full discussion of the adaptations we’ve made during this bubble, see the section titled “Understanding the discipline – a review of adaptations to the bubble” in our June comment Record Extremes, Alternative Investments, and the Hippo.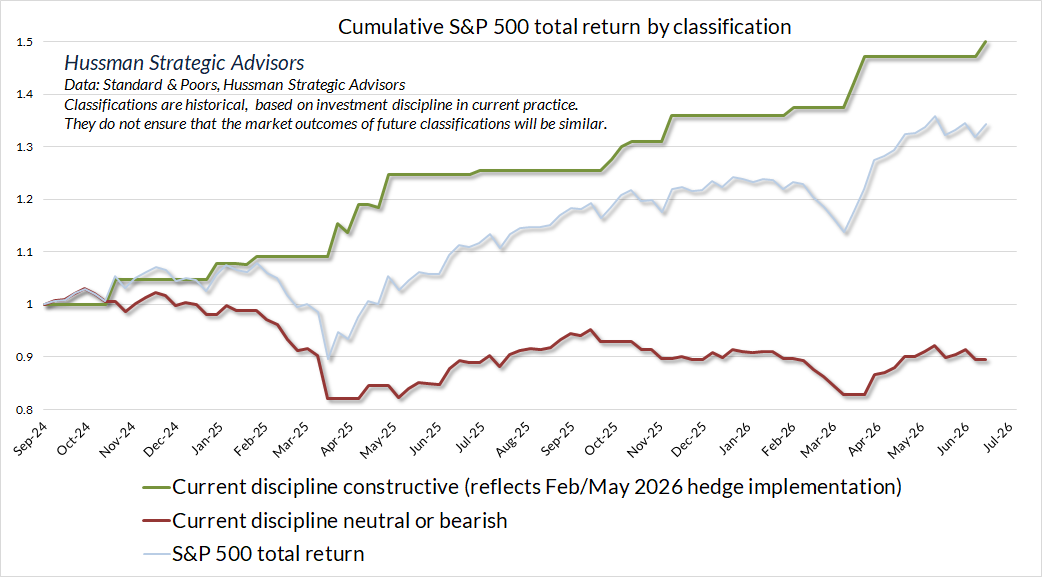
Long-term returns are always set by valuation arithmetic – which determines the “slope” between the current price and the very long-term stream of cash flows that will be delivered into the hands of investors long into the future. Yet at any particular moment, the market price will be whatever the collective psychology of investors chooses it to be. Short-term returns are driven by data only to the extent that the data affects what’s in the minds of speculators and investors. That’s why – beyond valuations – our discipline attends to measures like market internals, investor sentiment, credit spreads, implied volatility, commitments of differing sets of futures traders, insider transactions, and other measures that offer a look into the psychology prevailing in the heads of market participants.
When I write about not “discriminating” against the bubble, it doesn’t mean that we don’t have a long-term outlook, or that we’ve suddenly embraced the bubble generally (we haven’t). Non-discrimination doesn’t erase discernment. It frees discernment from coarse, rigid, dualistic concepts that imply coarse, rigid, dualistic responses. We can spend a lot of our lives imagining that there’s a solid boundary between this and that, bull market and bear market, desirable conditions and aversive conditions. The distinctions we construct with our minds may be the root cause of our difficulties, because they can prevent us from seeing things as they are.
Whether in the financial markets or in life, concepts and classifications can be useful, but if we allow them to harden into fixed views – seeing only “this versus that” rather than how “this and that” are interrelated and interdependent – we miss the reality that’s actually present: that the one thing is contained in the other.
If we imagine that an apple is distinct from the air, the water, and the earth, we might inadvertently do things to the air, water, and earth that destroy our apple. If we imagine – as I admittedly did for too long – that a speculative bubble is only garbage and compost and trap doors, we might not discover the flowers already budding in maybe 20% of the soil, that alone can fill a garden larger than the bubble itself. If we think of the market as only favorable, or only unfavorable, we’re in trouble either way. The bubble already contains the crash; the crash already contains the bull market. If we look deeply enough into one, we see the other, and we become better prepared to navigate both.
The same insight extends far beyond markets. The implications may be more difficult to admit because they require us to take responsibility – the surplus of one sector is made of the deficits of the others; the wealth enjoyed by one group is often a mirror image of the unmet needs of others; the happiness and difficulties of our loved ones are not just given facts, but are shaped, at least in part, by our own actions; the people we call enemies and outsiders may suffer in ways we haven’t even attempted to understand – even if we’ve contributed to their difficulties, or their perceptions of injustice. If we look closely enough into one thing, we see the other – this is, because that is; this is not, because that is not; they are like this because we are like that. That insight points us to what we can do right away to make things better.
Ok, so if extreme valuations and unfavorable internals aren’t even enough to lock us into a hard forecast, what should we expect as this market cycle progresses? Well, mindful of where valuations and internals stand, any constructive tilt we periodically adopt here will necessarily go hand-in-hand with a safety net. We expect to encounter those tilts about 20% of the time even at current extremes, and more often in less extreme conditions. Our present discipline, as adapted, classifies about two-thirds of historical periods as constructive, including 40% of the past decade.
The rest of the time, we should expect poor market outcomes or sideways churn to be the norm from these extremes. We can expect, but cannot rely, on a 55-75% retreat in the S&P 500 in the next few years. Meanwhile, we have to bend as frequently as possible toward a constructive stance (albeit with a safety net) when causes and conditions tilt toward “fast, furious” rebounds, even at record valuations.
Going forward, my hope is that our discipline will be effective not only in raising the return/risk profile of a diversified portfolio, as it has done even in recent years (see the section last month titled “Portfolio construction and alternative investments”), but also as an effective standalone discipline relative to the S&P 500, as it was across complete market cycles prior to the bubble portion of this one.
Mindful of how reliant extreme profit margins are on fiscal policies and political opportunism that serve as instruments of wealth concentration – coupled with social division that operates to conceal and enable the progressive hollowing out of the middle class, the growing anxiety of working families, and the withdrawal of resources from the most vulnerable – I suspect that all of this will likely end in economic dislocation and policy upheaval. The epiphany may be when the public recognizes the profound difference in the way that current U.S. policy treats a dollar earned as wages and salaries compared with the same dollar earned as profits and financial gains.
Mindful that speculators have attached unlimited imagination and leverage to novel technologies, as they have in every bubble in history, I expect that visions of glorious profit, particularly in the information technology sector, will transform into oversupply, broken dreams, and breathtakingly straight lines down – though as always, leaving useful consumer surplus that suppliers won’t capture.
Amidst it all, we have to be mindful that current economic distortions are based on foundations that have no obvious or well-defined endpoint. So we’ve become content to take mindful steps one at a time, each responding to the conditions, risks, and evidence we observe at every moment.
Mountain, cliff, or ocean in the distance, we choose our footing for the terrain beneath us.
Our investment discipline has always been like that – focused on aligning our investment stance to prevailing, observable market conditions. If anything, though, that flexibility didn’t go far enough. I do believe that the expansion of our September 2024 hedging implementation – in February and May of this year – has liberated us from fixed views, even amid the most extreme speculative conditions in history.
As Zen master Eihei Dōgen wrote circa 1223–1252
do not ask me where I am going,
as I travel in this limitless world,
where every step I take is my home
To paraphrase my beloved friend and teacher Thich Nhat Hanh – with each breath, with each step, we arrive, in the here and the now, where we have our appointment with life.
The same is true of our investment discipline. No forecasts are required.
Valuations and other extremes
The chart below shows our most reliable gauge of market valuations in data since 1928: the ratio of nonfinancial market capitalization to gross value-added (MarketCap/GVA). Gross value-added is the sum of corporate revenues generated incrementally at each stage of production, so MarketCap/GVA might be reasonably be viewed as an economy-wide, apples-to-apples price/revenue multiple for U.S. nonfinancial corporations.
At its recent extreme, MarketCap/GVA pushed to a record high of 4.2. To put that level in perspective, the historical norm across history is only about 1.0. That’s also the level that has corresponded to run-of-the-mill subsequent S&P 500 annual total returns of 10% annually, in market cycles since 1928. In prior market cycles, the gap between prevailing valuations and historical norms has generally been closed, which is part of the reason why our baseline risk estimate for the S&P 500 is a loss of about 75%. The same consideration is largely what informed our March 2000 projection of an 83% loss in technology stocks, which proved both correct and improbably precise.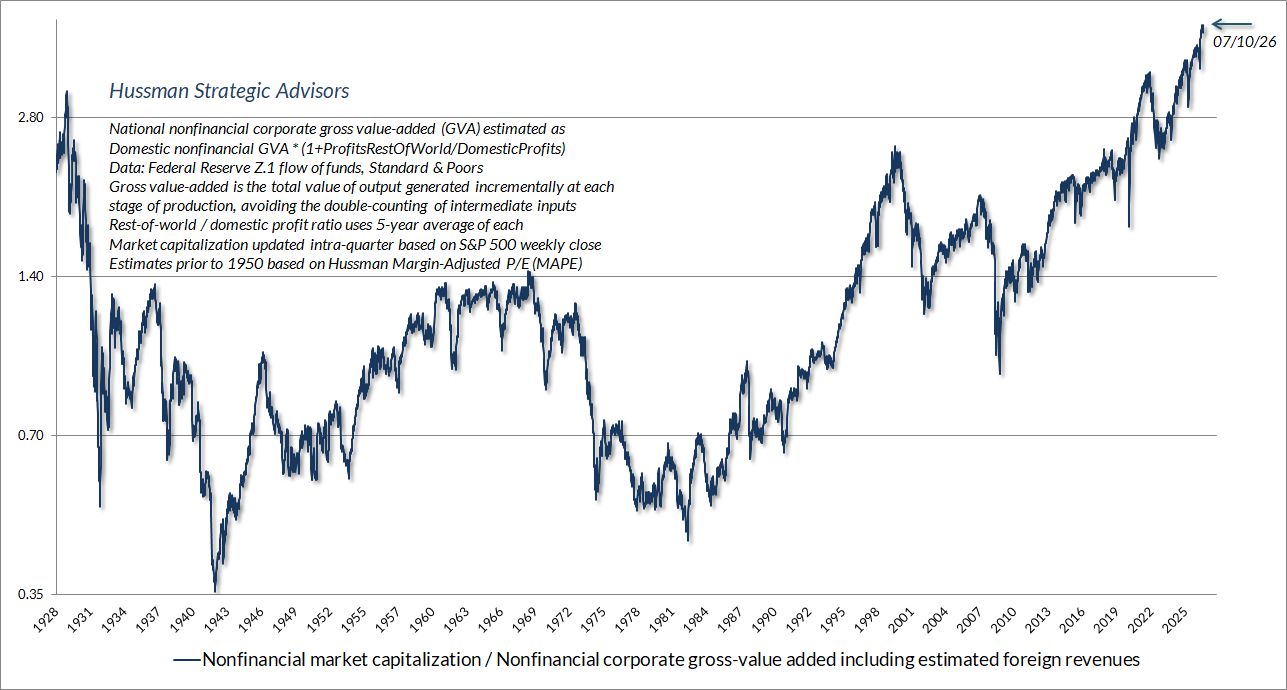
Undoubtedly, the main uncertainty surrounding MarketCap/GVA here is that it’s not responsive to the extreme level of profit margins that we presently observe. Now, historically, it turns out that this is a feature, not a bug. While profit margins can remain elevated for years at a time, the historical fact is that valuation measures that mute the impact of profit margin fluctuations do a far better job at projecting likely long-term returns than valuation measures that take profit margins at face value.
Without going all the way to the extreme assumption that current unprecedented margins will be sustained forever, we can give due consideration for the elevated level of profit margins by adjusting MarketCap/GVA by the 10-year average nonfinancial profit margin, which gives us a MarketCap/GVA version of Robert Shiller’s Cyclically Adjusted P/E (CAPE). The chart below shows the mapping between this adjusted measure, which I’ve dubbed GVA_PE10, and actual subsequent S&P 500 12-year average annual nominal total returns. The current level is over 25, while the historical norm associated with subsequent 10% annual S&P 500 returns is less than 11. That’s the comparison that gives us a narrower baseline market risk estimate of a potential 55% loss from these levels over the completion of this market cycle.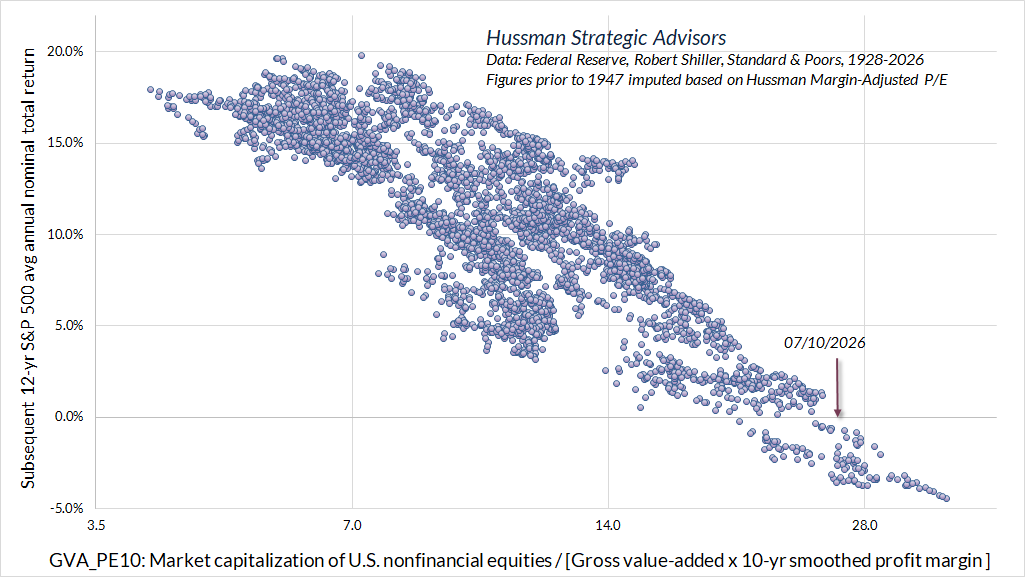
Of course, before we jump at the assumption that even the profit margins of the past decade will be sustained indefinitely, it’s worth recalling that the current extreme in corporate profit margins and free cash flow is the mirror image of massive deficits in the government and household sectors.
The deficit of one sector emerges as the surplus of other sectors, and the liabilities issued by one sector become the assets of the other sectors. This enormous domestic imbalance between ‘haves’ and ‘have nots’ means that the ‘haves’ accumulate the financial obligations of the ‘have nots.’ That’s how this house of cards keeps standing. Neither the government nor the average American household is taking in enough income to meet their expenditures. The majority of Federal expenditures are an offset to the fact that U.S. households, in aggregate, don’t earn enough to finance basic needs like healthcare and retirement expenditures. To a large extent, the combined deficit reflects a single underlying dynamic. From an accounting standpoint, record corporate profits are the mirror image of that dynamic.
John P. Hussman, Ph.D, An Unsustainable Equilibrium, October 28, 2025
The chart below shows the current status of this wildly skewed equilibrium. I doubt that it’s prudent to assume it will persist forever, which is the quiet, underlying assumption that one needs to swallow in order to endlessly extrapolate record profit margins into future.
This chart isn’t a theory, it’s not the Kalecki equation (though Kalecki is related), it’s just an accounting identity – derived by taking the two equivalent definitions of GDP (income-based and expenditure-based) from the national income and product accounts (NIPA) and rearranging. A surplus here is defined as income in excess of consumption and net investment. A deficit here is defined as consumption and net investment in excess of income. In aggregate, all of the surpluses and deficits must add to exactly zero (aside from a small item called the “statistical discrepancy”)
When we consider the fact that nearly 90% of corporate equities are owned by the wealthiest 10% of households, and that the other 90% finance their shortfalls by issuing liabilities like consumer debt that’s accumulated directly or indirectly by the top 10%, we see very clearly that the wealth enjoyed by one group is the mirror image of the income shortfalls of others.
Now, there’s certainly a lot of additional borrowing and lending that occurs within sectors, but in equilibrium – for any group we choose, the surpluses accumulated by one group are precisely the deficits of other groups. Financially, those surpluses take the form of new liabilities issued by the deficit sectors in order to finance their shortfalls.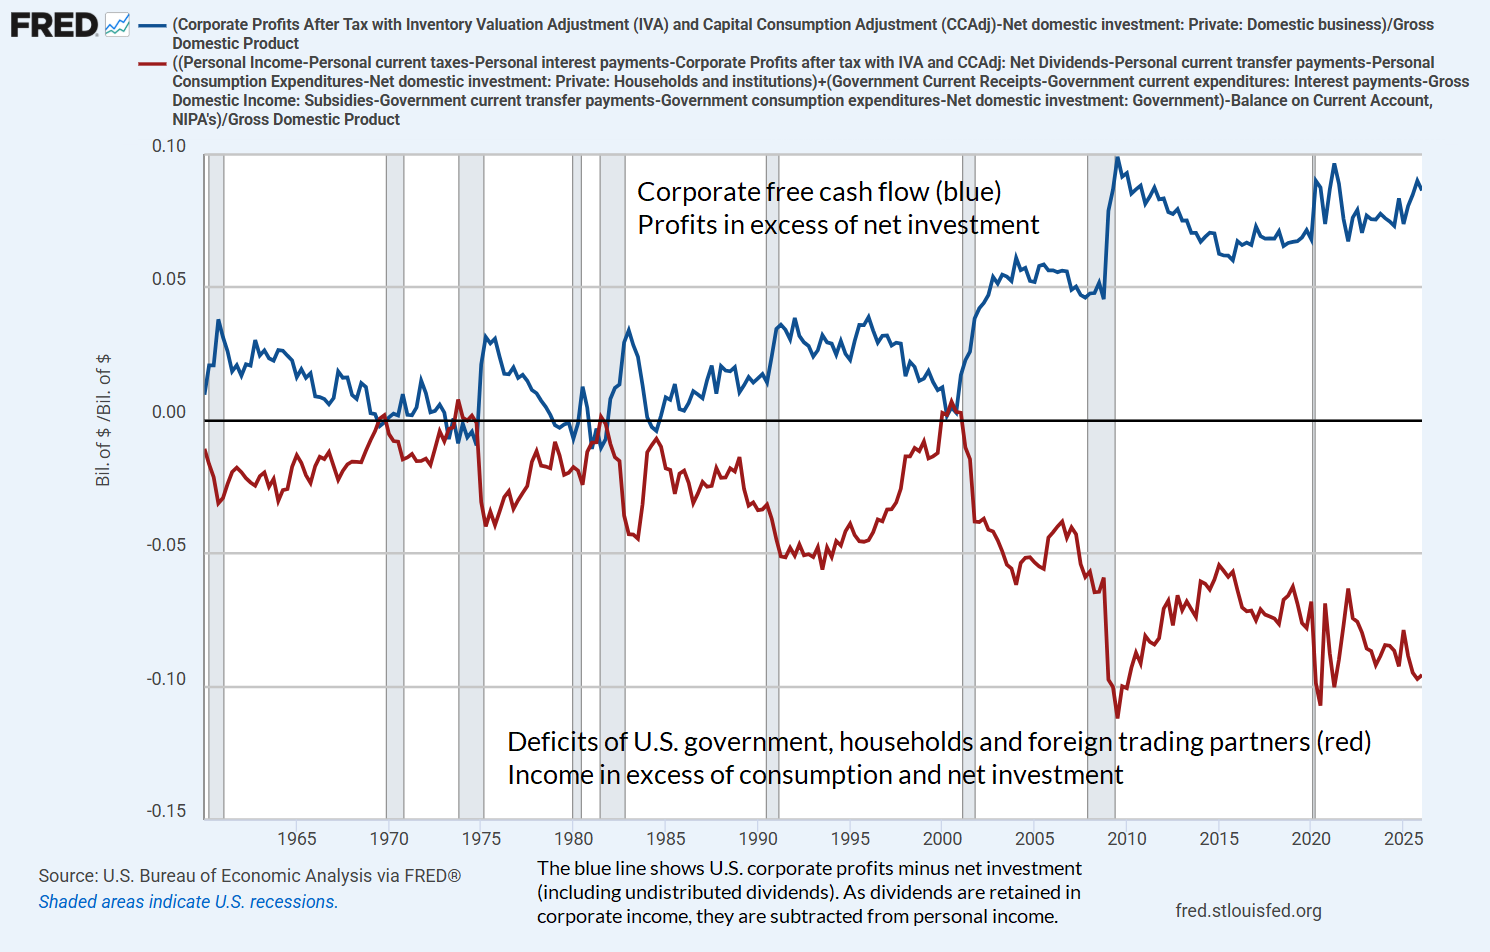
When we talk about profit margins, using the qualifier – “at the moment” – is essential, because current profit margins are the artifact and mirror image of the deepest shortfalls across government and household sectors in history, coupled with a tax system that has not yet come to grips with nature of the unprecedented level of profits in the U.S. economy. These profits are not simply normal compensation for productive contribution and risk-bearing, but increasingly take the form of dominance rents – derived not simply from entrepreneurial innovation, but from the private capture of network effects and publicly created content (which includes not only user content on say, social media, but also uncompensated materials used in the training of AI models). Much of the potential profit of AI models, in particular, relies on exploiting the creativity and intellectual property of others, without providing any compensation.
Unlike the sort of “top hat and cane” sort of monopoly we usually think of, which maximizes profit by limiting supply and elevating price, the profitability of “hyperscalers” is a version of what economists call “natural monopoly” – which benefits from declining marginal costs and profound economies of scale that create profits that are disproportionate to the inputs. Because it’s usually inefficient to duplicate expensive infrastructure, natural monopoly typically creates barriers to market entry by competitors (as we typically see in the utility industry). The exception is when investors are perfectly willing to throw money at a new technology, in which case we get the other extreme of duplicative and dangerously unproductive investment (as we saw in the tech bubble, then the mortgage bubble, and now in the AI space). It will take time, but this entire landscape – policy environment, “swarm like” overinvestment (to use Schumpeter’s phrase), and lopsided profitability – will change. Count on it.
The current extreme in margin debt offers one way to gauge the speculative exuberance of investors. The chart below shows the ratio of margin debt to GDP. As I noted in March, what matters for this particular measure isn’t the specific level, but the very discrete “spikes” – these tell you something about herd exuberance. My impression is that much of the recent spike has been focused on information technology stocks. Historically, as bubbles burst, these spikes add a layer of “forced selling” onto the market losses of speculative glamour stocks – hence my earlier comment about “breathtakingly straight lines down.” Like many indicators, Margin debt / GDP is best used as part of a broader set of information. The spike we see at present isn’t a powerful indicator in itself, but it does reinforce the signals we see in other areas, particularly valuations.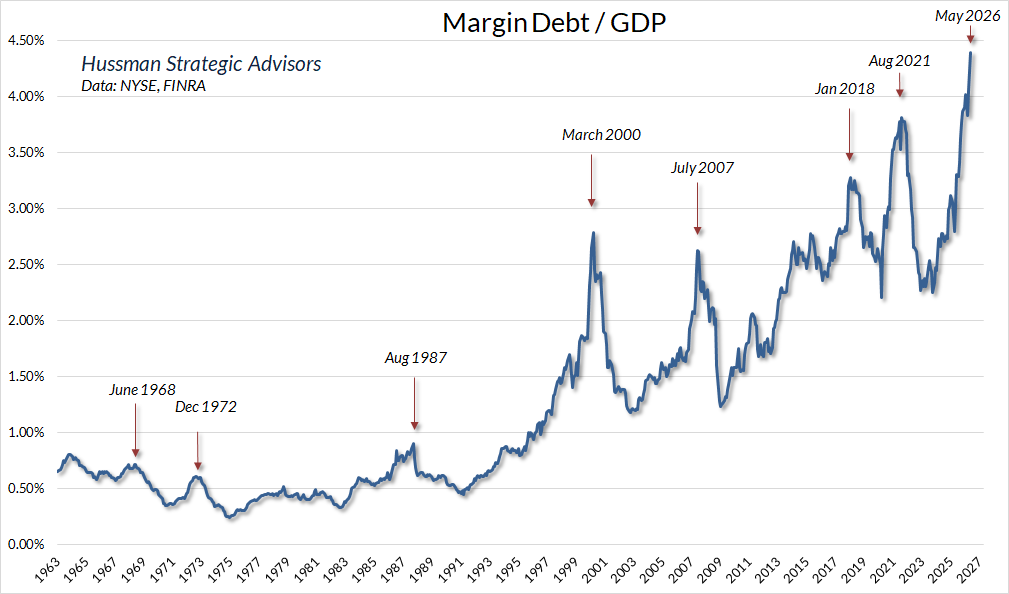
Finally, if neither record valuations, sectoral imbalances, or margin debt are enough to take your breath away, I give you the current frenzy of initial public offerings – which is not only striking in terms of money raised but in terms of post-IPO market capitalization. The difference is that companies typically sell only a fraction of their shares to investors in an IPO, with the rest held by early-stage investors, founders and insiders. By contrast, market capitalization is equal to price times shares outstanding, and reflects the amount that holders of the company’s stock count as “wealth” – ephemeral as that paper wealth may ultimately be.
At currently indicated valuations, companies going public or expected to go public in 2026 could enter the market with aggregate valuations of roughly 12% of U.S. GDP – over twice the previous records of 1999 and 2021.
I’ll note again that nothing in our investment discipline relies on a retreat in valuations. We’ve adapted to the point where we could be perfectly happy with a never-ending speculative bubble (though a normal amount of market fluctuation is vastly preferable to diagonal ramps at record highs). Still, I don’t believe we’ll get a never-ending speculative bubble. History has always brought today’s sort of speculative exuberance to much more distressing conclusions.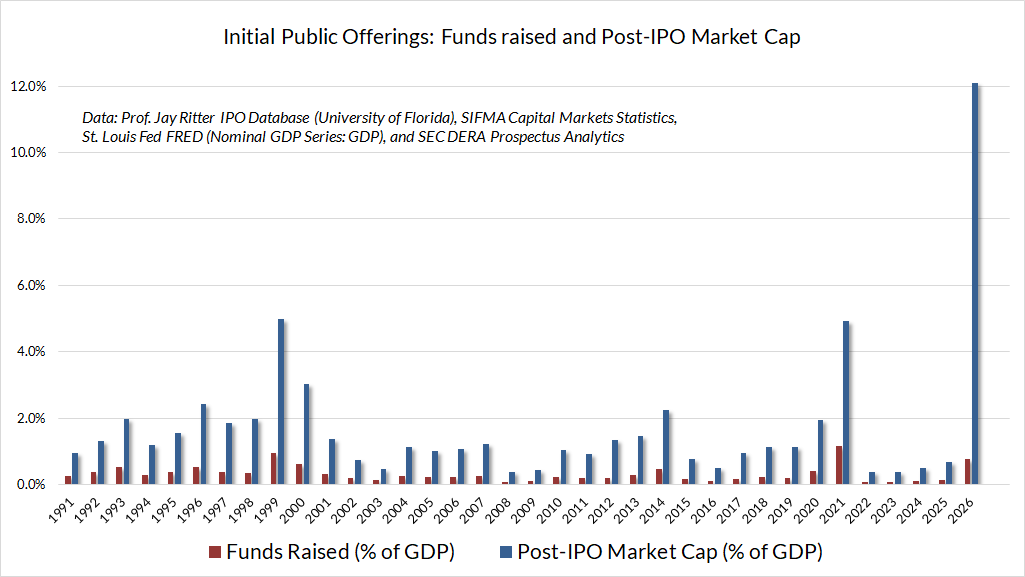
If one fact is glaringly clear in stock-market history, it is that a new-issues craze is always the last stage of a dangerous boom – a warning of impending disaster almost as infallible as Cheyne-Stokes breathing is a warning of impending death. But not so inexorable; if heads could be cooler and memories longer, investors both large and small, professional and amateur, might ward off danger by reading the signs, eschewing the new issues, and lightening their commitments generally. But investors, like other human beings, tragically repeat their mistakes; when the danger signs are plain, the lure of easy money blanks their minds and dissipates their calm.
In 1929, the shooters were jerrybuilt investment trusts like Alleghany, Shenandoah, and United Corporation. In 1961 they were tiny scientific companies put together by glittery-eyed young Ph.D.’s, their company names ending with “-onics.” In 1968-1969, what a promoter needed to launch a new stock, apart from a persuasive tongue and a resourceful accountant, was to have a “story” – an easily grasped concept, preferably related to some current national fad or preoccupation, that sounded as if it would lead to profits. Such stories, like most stories, were best told quickly and concisely, and best of all within the name of the company itself.
– John Brooks, The Go-Go Years, 1973
The foregoing comments represent the general investment analysis and economic views of the Advisor, and are provided solely for the purpose of information, instruction and discourse.
Prospectuses for the Hussman Strategic Market Cycle Fund, the Hussman Strategic Total Return Fund, and the Hussman Strategic Allocation Fund, as well as Fund reports and other information, are available by clicking Prospectus & Reports under “The Funds” menu button on any page of this website.
The S&P 500 Index is a commonly recognized, capitalization-weighted index of 500 widely-held equity securities, designed to measure broad U.S. equity performance. The Bloomberg U.S. Aggregate Bond Index is made up of the Bloomberg U.S. Government/Corporate Bond Index, Mortgage-Backed Securities Index, and Asset-Backed Securities Index, including securities that are of investment grade quality or better, have at least one year to maturity, and have an outstanding par value of at least $100 million. The Bloomberg US EQ:FI 60:40 Index is designed to measure cross-asset market performance in the U.S. The index rebalances monthly to 60% equities and 40% fixed income. The equity and fixed income allocation is represented by Bloomberg U.S. Large Cap Index and Bloomberg U.S. Aggregate Index. You cannot invest directly in an index.
Estimates of prospective return and risk for equities, bonds, and other financial markets are forward-looking statements based the analysis and reasonable beliefs of Hussman Strategic Advisors. They are not a guarantee of future performance, and are not indicative of the prospective returns of any of the Hussman Funds. Actual returns may differ substantially from the estimates provided. Estimates of prospective long-term returns for the S&P 500 reflect our standard valuation methodology, focusing on the relationship between current market prices and earnings, dividends and other fundamentals, adjusted for variability over the economic cycle. Further details relating to MarketCap/GVA (the ratio of nonfinancial market capitalization to gross-value added, including estimated foreign revenues) and our Margin-Adjusted P/E (MAPE) can be found in the Market Comment Archive under the Knowledge Center tab of this website. MarketCap/GVA: Hussman 05/18/15. MAPE: Hussman 05/05/14, Hussman 09/04/17.
Disclosure Notice
Performance data quoted represents past performance. Past performance does not guarantee future results. Investment return and principal value of an investment will fluctuate so that an investor’s shares, when redeemed, may be worth more or less than their original cost. Current performance may be lower or higher than the performance data quoted. More current performance data through the most recent month-end are available at the Fund’s website www.hussmanfunds.com or by calling 1-800-487-7626.
Investors should consider the investment objectives, risks, and charges and expenses of the Funds carefully before investing. For this and other information, please obtain a Prospectus and read it carefully.
The Hussman Funds have the ability to vary their exposure to market fluctuations depending on overall market conditions, and they may not track movements in the overall stock and bond markets, particularly over the short-term. While the intent of this strategy is long-term capital appreciation, total return, and protection of capital, the investment return and principal value of each Fund may fluctuate or deviate from overall market returns to a greater degree than other funds that do not employ these strategies. For example, if a Fund has taken a defensive posture and the market advances, the return to investors will be lower than if the portfolio had not been defensive. Alternatively, if a Fund has taken an aggressive posture, a market decline will magnify the Fund’s investment losses. The Distributor of the Hussman Funds is Ultimus Fund Distributors, LLC., 225 Pictoria Drive, Suite 450, Cincinnati, OH, 45246.
The Hussman Strategic Market Cycle Fund has the ability to hedge market risk by selling short major market indices in an amount up to, but not exceeding, the value of its stock holdings. However, the Fund may experience a loss even when the entire value of its stock portfolio is hedged if the returns of the stocks held by the Fund do not exceed the returns of the securities and financial instruments used to hedge, or if the exercise prices of the Fund's call and put options differ, so that the combined loss on these options during a market advance exceeds the gain on the underlying index. The Fund also has the ability to leverage the amount of stock it controls to as much as 1 1/2 times the value of net assets, by investing a limited percentage of assets in call options.
The Hussman Strategic Allocation Fund invests primarily in common stocks, bonds, and cash equivalents (such as U.S. Treasury bills and shares of money market mutual funds, aligning its allocations to these asset classes based on prevailing valuations and estimated expected returns in these markets. The investment strategy adds emphasis on risk-management to adjust the Fund’s exposure in market conditions that suggest risk-aversion or speculation among market participants. The Fund may use options and futures on stock indices and Treasury bonds to adjust its relative investment exposures to the stock and bond markets, or to reduce the exposure of the Fund’s portfolio to the impact of general market fluctuations when market conditions are unfavorable in the view of the investment adviser.
The Hussman Strategic Total Return Fund has the ability to hedge the interest rate risk of its portfolio in an amount up to, but not exceeding, the value of its fixed income holdings. The Fund also has the ability to increase the interest rate exposure of its portfolio through limited purchases of Treasury zero-coupon securities and STRIPS. The Fund may also invest up to 30% of assets in alternatives to the U.S. fixed income market, including foreign government bonds, utility stocks, convertible bonds, real-estate investment trusts, and precious metals shares.
The Prospectus of each Fund contains further information on investment objectives, strategies, risks and expenses. Please read the Prospectus carefully before investing.
The Market Climate is not a formula but a method of analysis. The term "Market Climate" and the graphics used to represent it are service marks of Hussman Strategic Advisors (formerly known as Hussman Econometrics Advisors). The Fund Manager has sole discretion in the measurement and interpretation of market conditions. Information relating to the investment strategy of each Fund is described in its Prospectus and Statement of Additional Information. A schedule of investment positions for each Fund is presented in the annual and semi-annual reports. Except for articles specifically citing investment positions held by the Funds, general market commentary does not necessarily reflect the investment position of the Funds.
A message from Advisor Perspectives and VettaFi: Discover something new! Click here to register for our upcoming webcasts.
Membership required
Membership is now required to use this feature. To learn more:
View Membership BenefitsSponsored Content
Upcoming Virtual Events View All