A week of rising oil prices and higher interest rates sent stocks lower across the board as investors increasingly priced in the likelihood that the Federal Reserve (Fed) will begin a rate-hiking cycle at its September 16 meeting. Following the August Consumer Price Index (CPI) report, futures markets implied an 88 percent probability that the Fed will, or at least should, raise rates at next week's meeting.
I’ve written before about why the federal debt may be less dire than the headlines suggest, and I still think much of that argument holds. You cannot know whether a national crisis is coming. You can, however, assess the risk of a crisis for your own budget and take action to reduce that risk.
Treasury yields are closing in on an inflection point where, historically, stocks and bonds have reinforced losses in one another. That points to a regime shift of higher bond and stock volatility and wider credit spreads.
Kevin Warsh has rightly called into question the effectiveness of the Federal Reserve’s communications — but his arrival as chairman only seems to have made the problem worse. To put this right after the next Fed meeting this week, he’ll need to rethink his approach to explaining where things stand.
The latest inflation report points to a hard truth: The US is not going back to a 2% inflation rate anytime soon. At least not easily.
Periods like this can feel especially tense, with higher stakes and more urgent headlines. Yet over time, markets have shown they are forward-looking and resilient, absorbing uncertainty rather than freezing in it. While today’s geopolitical backdrop may feel unsettling, it fits a long history of disruptions that markets have ultimately navigated.
Chris Galipeau discusses high-conviction insights that go beyond media headlines.
Last week, the refining margin on European gasoil, the benchmark that sets the price of diesel and heating oil across much of the world, closed at roughly $94 a barrel over Brent crude, according to Bloomberg data. That figure is normally somewhere between $12 and $18.
As policymakers adapt to new leadership, navigate a challenging geopolitical backdrop and contend with meaningful internal debate over the path of interest rates, the stakes remain high. Below, we discuss what to expect from next week’s Federal Reserve (Fed) meeting and provide perspective on the recent rise of Treasury yields to multi-year highs.
Attractive yields and resilient credit conditions are creating opportunities across fixed income, but uncertainty around inflation and interest rates makes flexibility, selectivity and disciplined risk management especially important.
Heading into the September 16 FOMC meeting, the debate over whether the Fed should raise rates or hold is heated. To help you appreciate the range of views, I present this article as a courtroom exercise. I will let the prosecution make its case for a rate hike, and the defense for a hold.
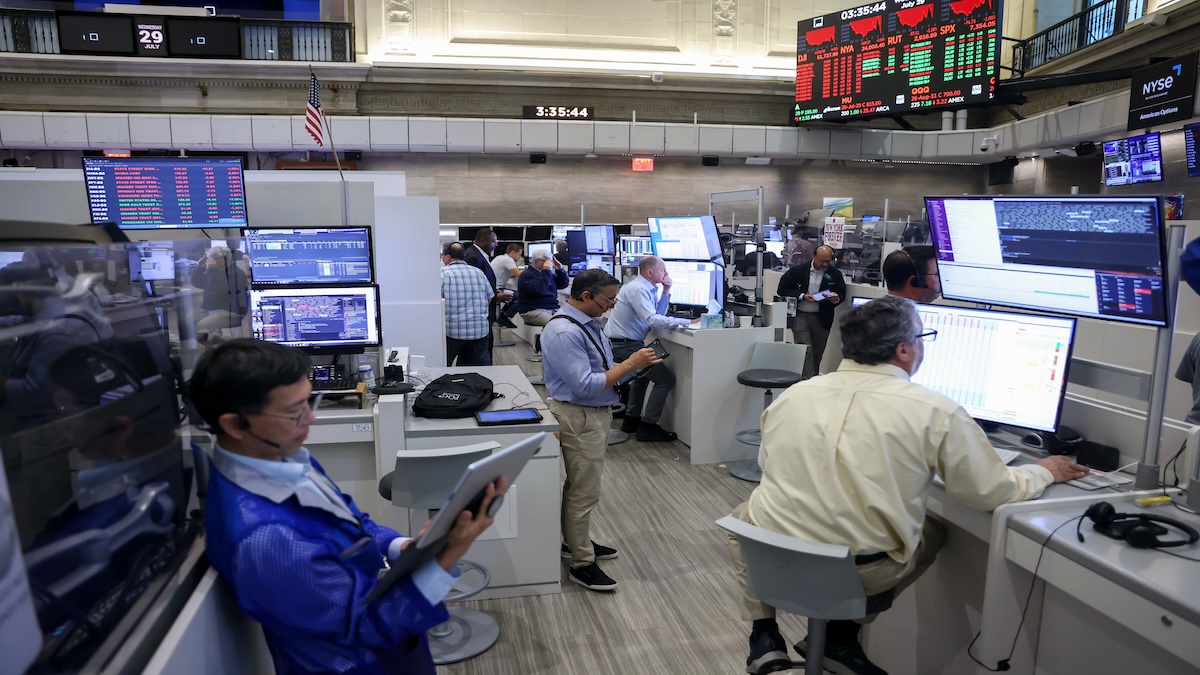
The list of challenges confronting Wall Street piled up this week. Oil firmly above $100. Inflation refusing to disappear. A defiant bond market that all but dared Scott Bessent to bring more policy firepower.
The bond selloff has driven a key Treasury yield to the verge of 5%, worsening angst from Wall Street to Washington about higher borrowing costs hitting the US economy.
Every few months, a new essay declares that the US debt trap has finally sprung. The latest one making the rounds from The Economist is well written and genuinely unsettling. It argues that Washington has borrowed so recklessly that the Federal Reserve no longer dares to raise interest rates. Doing so, the piece warns, would detonate the whole structure and send financing costs spiraling out of control.
Equity markets generally moved lower as rising yields and energy prices created a more challenging backdrop. Higher yields can be particularly difficult for long-duration equities, where a greater share of expected cash flows sits further into the future.
Some investors are questioning how much further this year’s rally can run with the S&P 500 Index up 12.3% through the first eight months of the year. Encouragingly, history suggests that strong starts tend to persist; when the S&P 500 has gained more than 10% through August it has advanced from September through December in 25 of 28 instances, an 89% positive hit rate.
Occasionally, we are confronted with decisions where there are no easy options. The prevailing circumstances bound our choices, and we may face criticism no matter what we do. Collectively, the Federal Open Market Committee (FOMC) finds itself in just such a situation as it prepares for its upcoming meeting.
The recent employment report provided reassurance that the US labor market remains resilient. The economy added 162,000 jobs in August; the previous two months’ gains were revised higher by a combined 55,000, and the unemployment rate held steady at 4.1%.
There is so much going on, it is hard to know where to begin. The data is all over the place. I had a long and epic dinner in New York with David Bahnsen, Rene Aninao, and Brian Syztel which has my mind buzzing with ideas and new concepts.
Don't let September's macro headline noise fool you. Today’s economic backdrop won’t likely trigger a broad market freeze like 2022, but there will be winners and losers. Cash-rich mega-caps, AI infrastructure plays, and scaled market leaders (the SpaceX, Anthropic and OpenAI tier) command their own gravity.
U.S. equities were little changed on the week – the S&P 500 rose 0.1 per cent, the NASDAQ gained 0.4 per cent, and the Russell 2000 added 0.12 per cent – but those modest moves masked a far more turbulent week in the global rates markets.
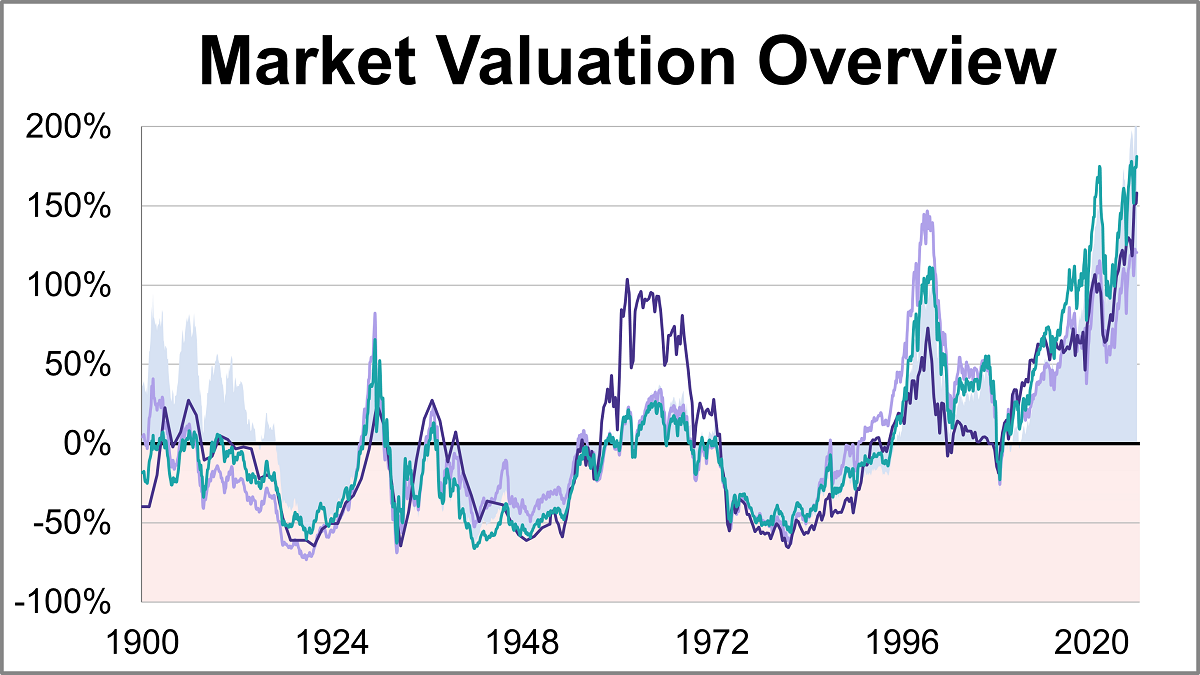
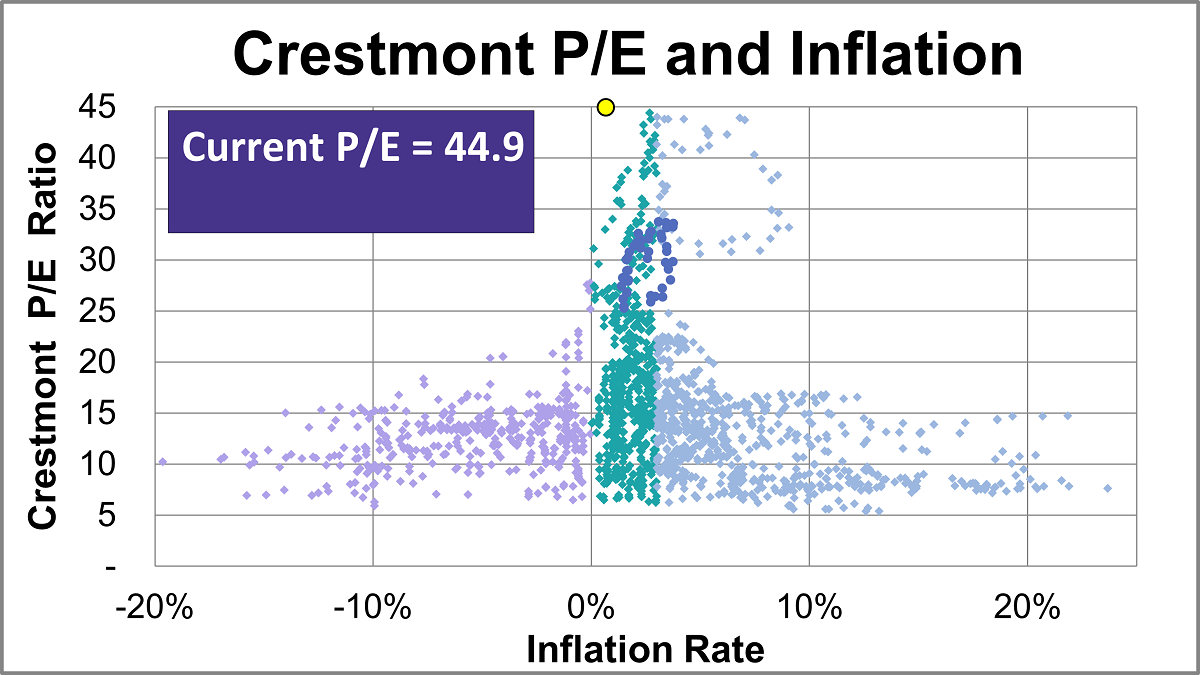
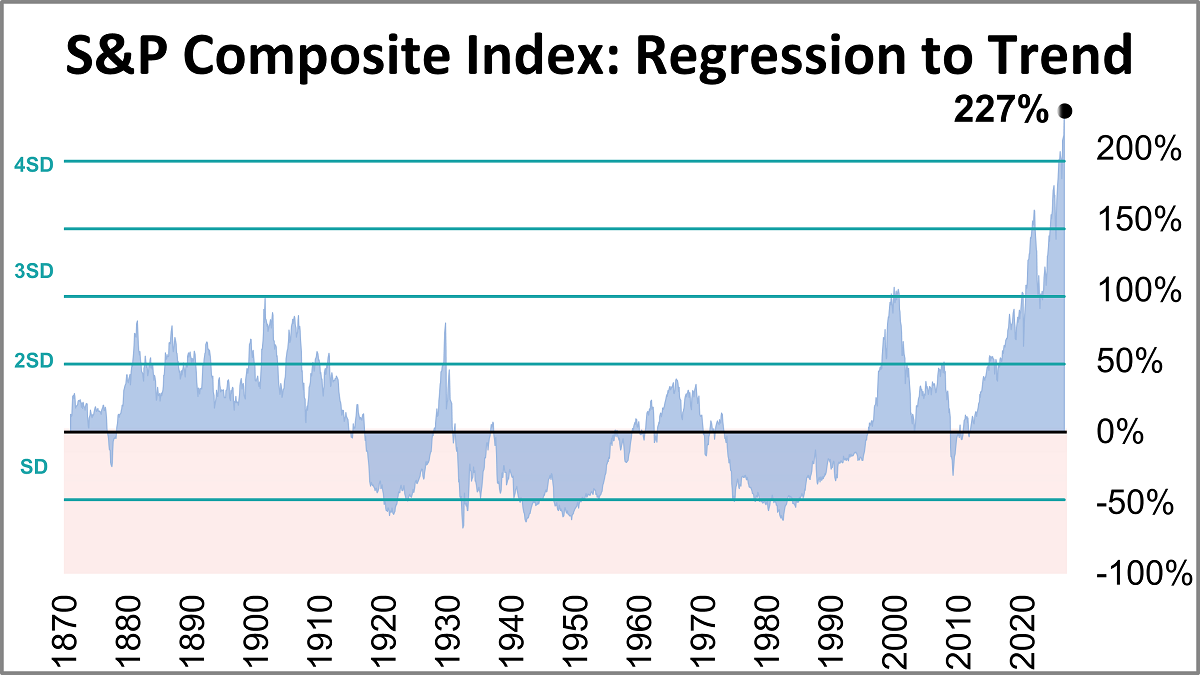
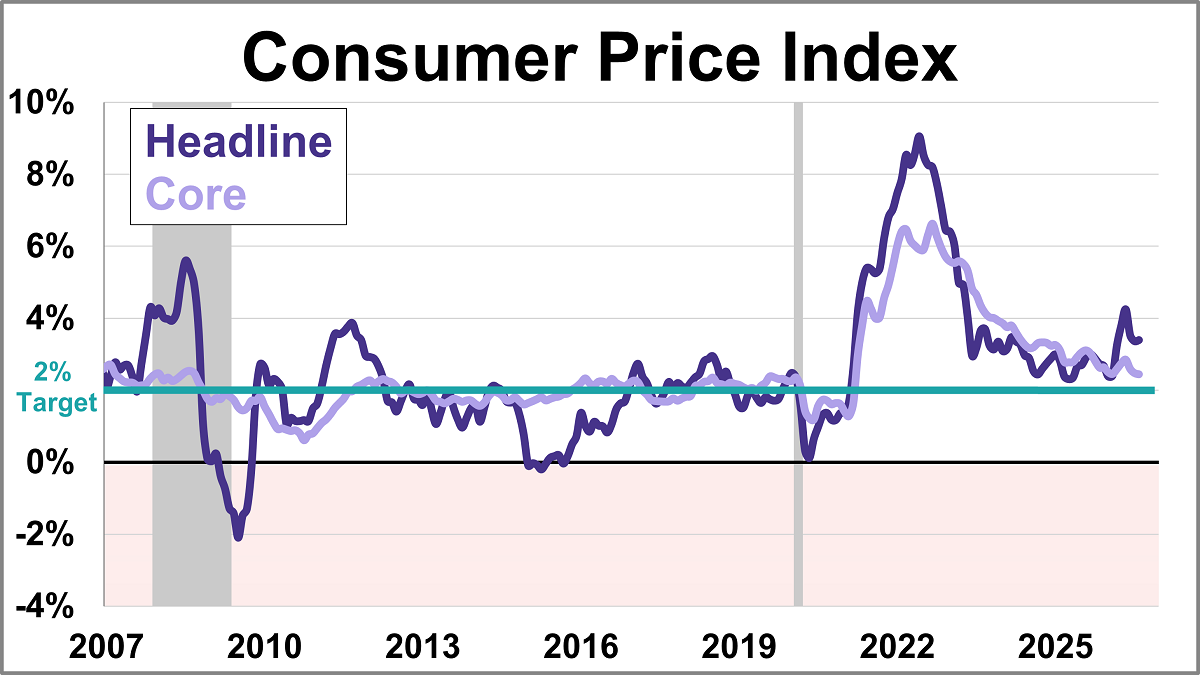
Here is a summary of the four market valuation indicators we update on a monthly basis.
Based on August's S&P 500 average of daily closes, the Crestmont P/E of 44.9 is 191% above its arithmetic mean, 220% above its geometric mean, and is in the 100th percentile of this 14-plus-decade series.
The inflation-adjusted S&P Composite Index was 227% above its long-term trend at the end of August.
Inflation rose 3.4% year-over-year in August, as it did for the 12 months ending July. The headline figure for the Consumer Price Index (CPI) was in line with economist estimates.
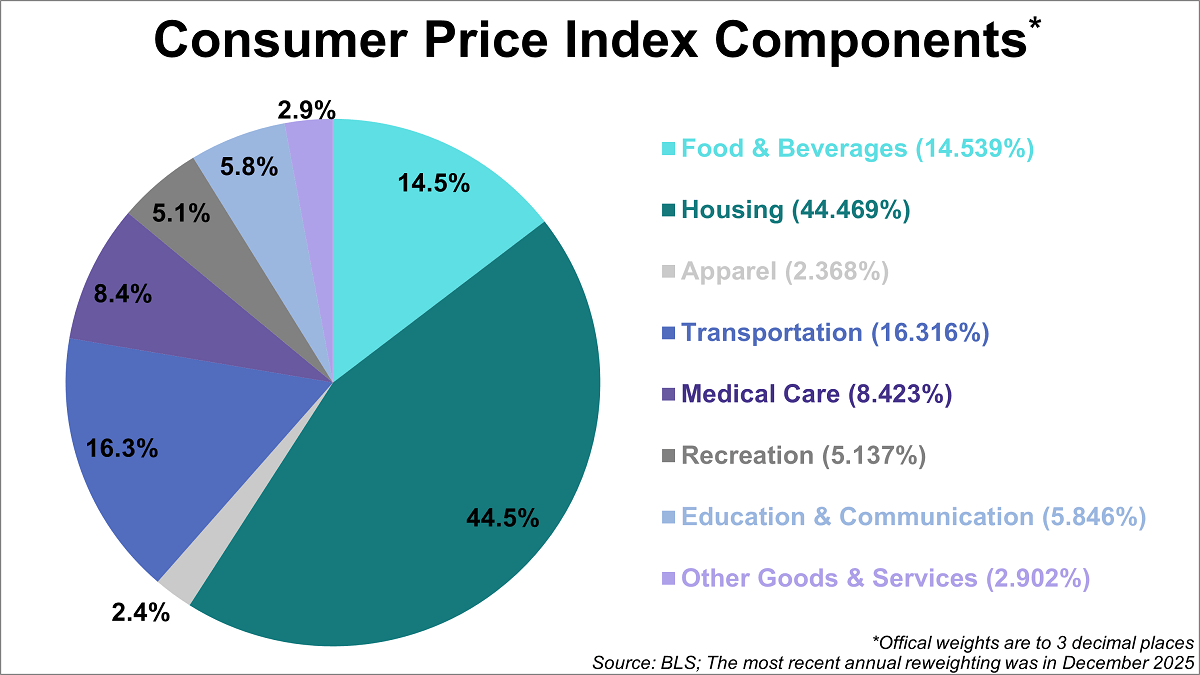
Inflation affects everything from grocery bills to rent, making the Consumer Price Index (CPI) one of the most closely watched economic indicators. The Bureau of Labor Statistics (BLS) tracks this by categorizing spending into eight categories, each weighted by its relative importance.
With a handful of stocks attracting most of the recent headlines, it’s easy to forget that investors continue to find opportunities across a broad range of sectors.
US stocks fell for a fourth straight day, their longest slide since June, as the relentless climb in oil prices and fresh evidence of sticky inflation boosted Treasury yields and bets the Federal Reserve will lift interest rates.
A key gauge of US consumer prices rose by more than expected last month, bolstering the case for Federal Reserve officials to raise interest rates next week.
History suggests slower Fed tightening tends to support stronger market returns and firmer economic growth, while faster hikes typically deepen drawdowns.
Portfolio Managers Jonathan Coleman and Aaron Schaechterle outline why they believe momentum in small-cap stocks relative to large caps can continue, highlighting favorable earnings growth prospects, appealing relative valuations, and other structural tailwinds.
2026 began with 10-year Treasuries right around 4%, which many viewed as a comfortable place. The comfort came from some simple math—2 plus 2 equals 4. The long-term real yield on the 10-year Treasury was around 2% and the Fed’s inflation target is 2%.
Market volatility persisted in August as investors were again forced to reassess escalating tensions and an exchange of military strikes in the Middle East, while softer labor-market data was countered by mixed inflation readings.
With so much attention focused on what the Federal Reserve (Fed) might do at its policy meeting next week, it’s a good time to look back at history to get a sense of how stocks might respond should the Fed hike rates as the market (barely) expects.
Benchmark-Free has been a flagship strategy for half of GMO's history. As we approach our 50th anniversary in 2027, Ben Inker reflects on our first 25 years of Benchmark-Free investing.
The Producer Price Index (PPI) was up 0.4% in August, better than expectations.
Federal Reserve officials have signaled they’re prepared to raise interest rates if inflation doesn’t improve soon, but they may find their main policy tool will do little to restrain some of the forces pushing up prices now.
Gold hovered near $4,400 an ounce, as traders awaited US inflation data due later this week for clues as to whether the Federal Reserve will hike interest rates this month.
Brent oil spiked to $105 a barrel as rising tensions in the Middle East heightened concerns over global supplies.
For much of the past decade and a half, investors saw little reason to favor bonds over equities. Yields were low and returns were muted, especially in passive strategies. Equities seemed to offer a much clearer path to long-term capital appreciation. For many investors, bonds were, at best, ballast: a dull but generally stable component of a broader portfolio. Then the experience of 2022 had investors questioning even that view, as areas of high quality fixed income generated equity-like losses that eroded much of the prior decade’s real return.
The August employment report was much stronger than expected and reinforces my view that the U.S. economy remains remarkably resilient. Payrolls increased by 162,000, above every estimate, while revisions added another 55,000 jobs to the previous two months. The workweek increased by one-tenth of an hour, the household survey was extremely strong, and the participation rate finally moved higher.
On Friday, the August U.S. employment report surprised to the upside, with 162,000 jobs added during the month. Year to date, the labor market has shown impressive resilience, with hiring also becoming more balanced across sectors than in previous years.
Before Friday’s jobs report, it was roughly a toss-up in the financial markets whether the Fed would raise rates at the next meeting in mid-September. Now, the odds favor a rate hike and it’s not hard to see why.
When markets become volatile, many investors gravitate toward assets they perceive as “safe.” Cash, certificates of deposit (CDs), money market funds, U.S. Treasury securities, and high-quality bonds can all play an important role in a diversified portfolio. But “safe” doesn’t necessarily mean “risk-free.”
LPL Research analyzes rising U.S. debt, Treasury yields, and fiscal trends, highlighting implications for markets and investors.
From an earnings perspective, this summer proved to be a largely fruitful one for many companies within the S&P 500.
At least a third of all Federal Reserve officials have said they would consider meeting less frequently to set interest rates, giving Kevin Warsh an early opening for one of the biggest structural changes he’s proposed as the central bank’s new chairman.
Labor Day signals more than summer’s end. It marks a return of focus to the economic and market forces that will shape the remainder of the year. From resilient earnings and record AI spending to rising bond yields and the midterm elections, there is no shortage of forces shaping the market outlook.
If you’re planning on driving anywhere this Labor Day weekend, be prepared to pay the highest gas prices ever for this time of year. The national average hit $4.14 per gallon on Thursday, an approximately 30% increase from last year, according to AAA.
The Federal Reserve has spent the past four years trying to cool price increases through higher interest rates. The federal funds rate is still well above its pre-pandemic average, mortgage rates remain elevated, and borrowing costs for households and businesses are considerably higher than they were in the era of ultra-low interest rates.