The National Football League is holding off on making any alliances with prediction market companies even as many other top leagues and events embrace the new form of sports betting.
US job growth surged in August and the unemployment rate held steady, suggesting the labor market has more momentum than previously thought.
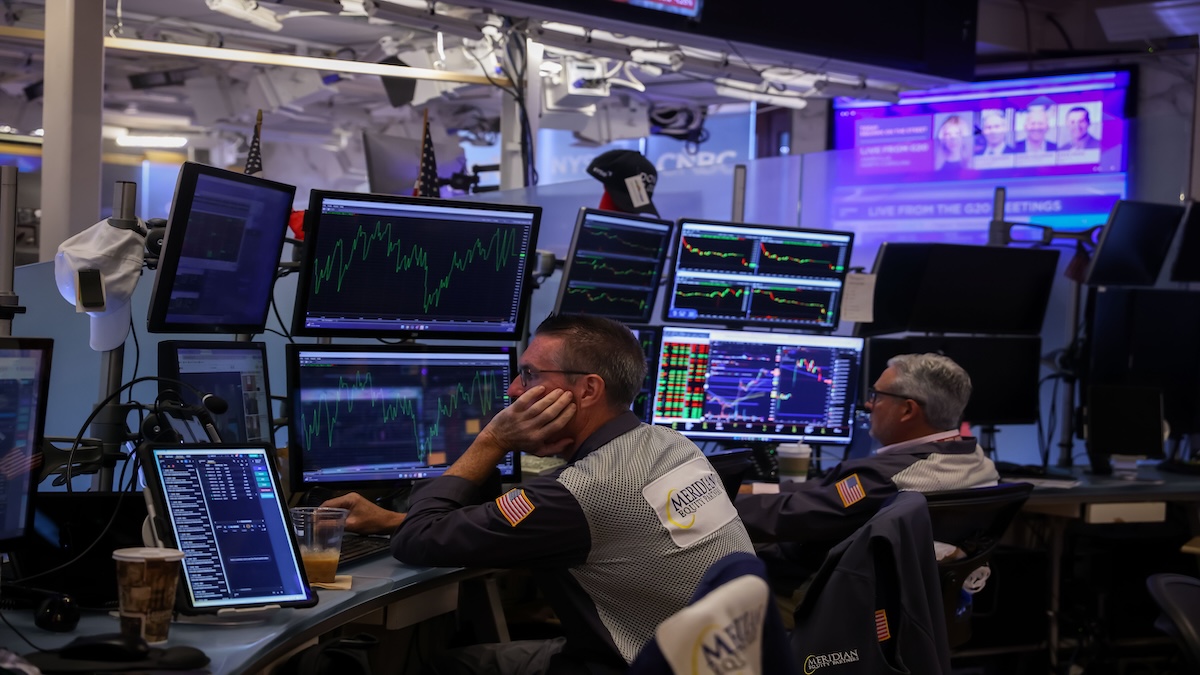
US stock futures erased early gains to briefly touch session lows on Friday after the US added 162,000 jobs in August, raising concerns that the Federal Reserve may hike interest rates soon.
Products and services often benefit from great marketing. A catchy commercial, headline, or gimmick can attract potential customers. Sometimes marketing can be so effective that customers seek or support an average or even inferior product.
More than a year after wildfires devastated Pacific Palisades, a nonprofit is advancing a plan to tap the public debt market to create housing in the slow-to-recover Los Angeles wealthy enclave.
After several challenging years, important parts of the health care sector appear to be reaching an inflection point. Policy uncertainty has weighed on pharmaceutical companies, constrained biotech funding has pressured the drug-development ecosystem and the normalization of pandemic-era has challenged select tool and device companies. More recently, however, several of these headwinds have begun to moderate.
For many investors, years of disciplined saving, equity compensation, business ownership, or a handful of exceptional investments can produce a portfolio that grows faster than expected. While that may sound like an ideal outcome, it can also create what we often think of as a wealth overhang: a situation in which the complexity of your wealth begins to outpace the financial plan supporting it.
Emerging-market (EM) equities have benefited enormously from the global AI investment boom. But headline market gains show that EM leadership has become concentrated in a handful of mega-cap technology stocks. In our view, today’s EM benchmark is far less diversified than many investors assume, creating opportunities to seek differentiated sources of return.
Famous market bubbles share some characteristics, but it's nearly impossible to predict how big a bubble might get and when one is about to burst.
Global bond yields have climbed to the highest levels in almost two decades, pushing up mortgage repayments and corporate financing costs. But one corner has remained unusually resilient: emerging markets.
Global fixed income and equity ETF strategies posted gains and saw inflows surge in August, even amid ongoing macroeconomic turbulence and elevated long-term borrowing costs. International equities maintained their year-to-date lead over U.S. stocks throughout the month, led by notable strength in emerging markets.
Stocks have enjoyed a powerful run off the spring lows and have largely shrugged off concerns around growth, inflation, higher interest rates, the effects of artificial intelligence (AI), geopolitics, and policy uncertainty. As the calendar turns to September, however, they are entering what has historically been, from a seasonality perspective, the most challenging month of the year for equities.
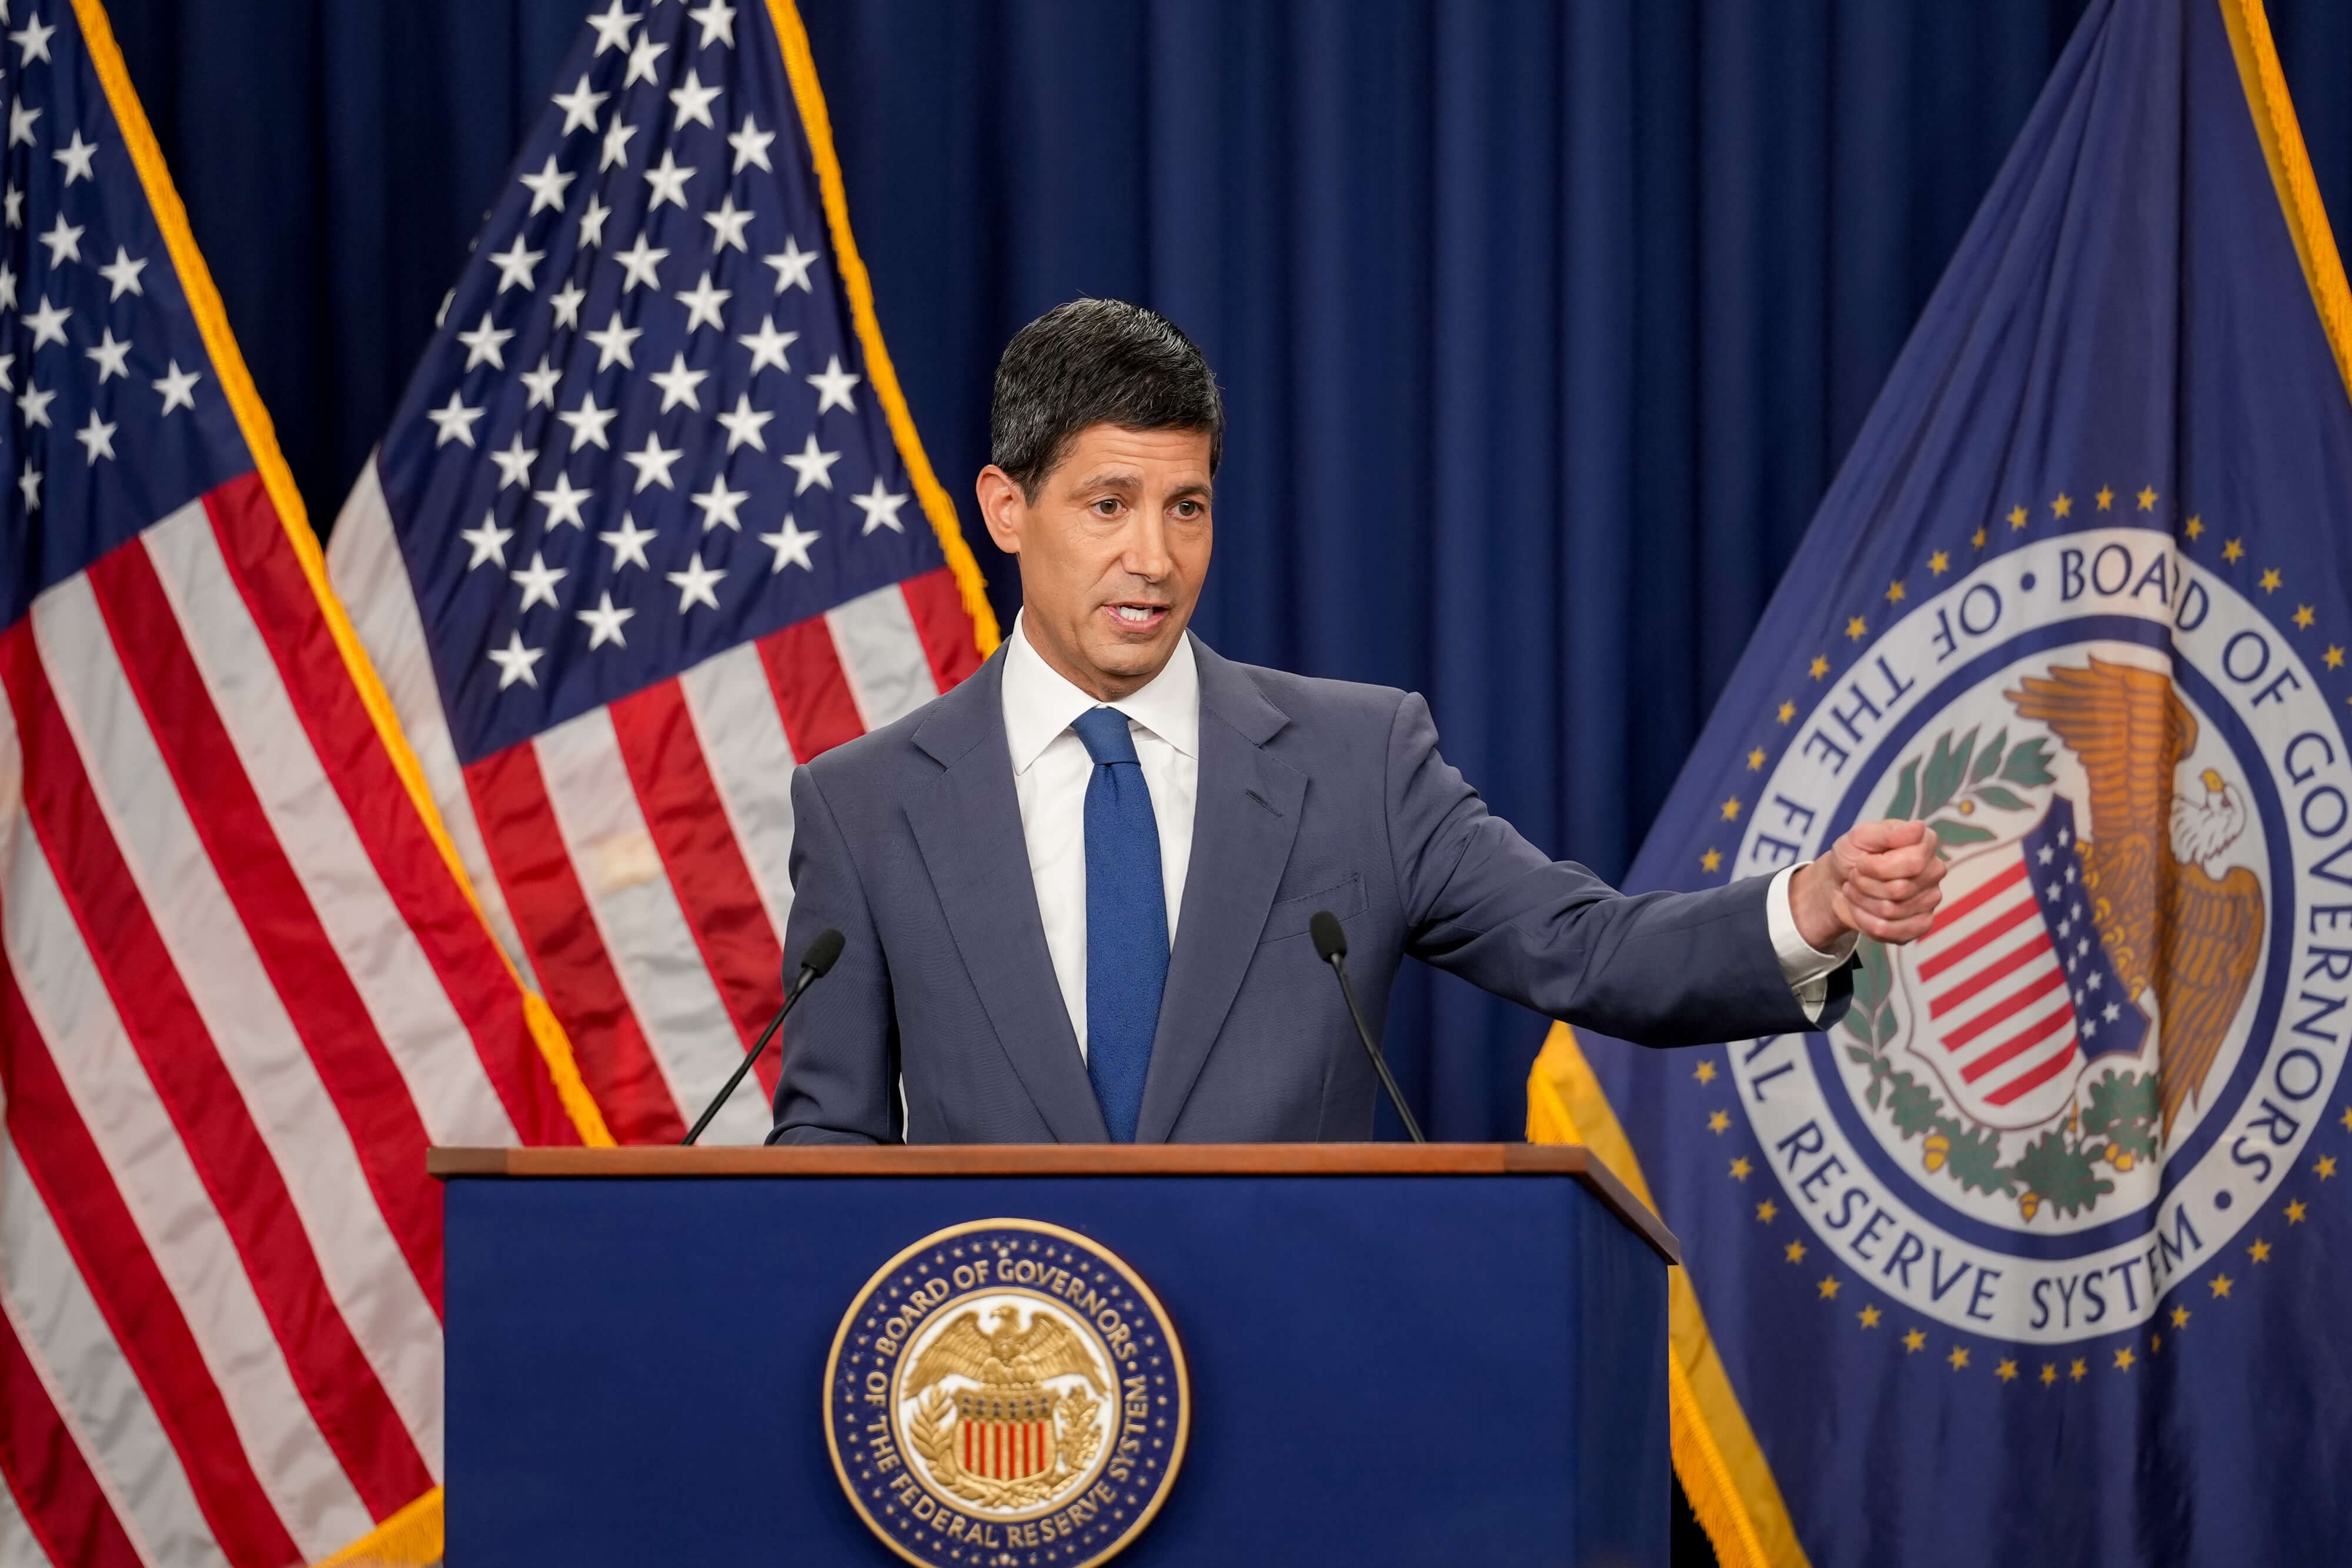
Kevin Warsh's Jackson Hole speech struck a decidedly hawkish tone and was arguably the clearest signal yet that the Federal Reserve is actively considering additional tightening. Markets responded by raising the probability of a September hike to roughly 60% and pricing approximately 60 basis points of cumulative tightening through the middle of next year.
With recent data weakening the case for an immediate increase in rates, markets have sharply pared expectations for near-term tightening, with a hike no longer fully priced before early 2027.3 This moderation in rate-hike fears has been supportive for gold.
The saying “May you live in interesting times” is becoming relevant in the bond market for all the wrong reasons. “Interesting” usually means “trouble.”
On Wednesday, September 2, State Street Investment Management announced the debut of the State Street SPDR UC Investments 90/10 Endowment Strategy Index ETF (UCBG). Notably, this fund was created through a collaboration between State Street and UC Investments, the investment arm of the University of California.
A recent plunge in US labor force participation has sparked competing theories about whether persistent drivers — like aging and immigration — or more temporary seasonal shifts are to blame. Any evidence in upcoming jobs reports could reshape how policymakers view the labor market.
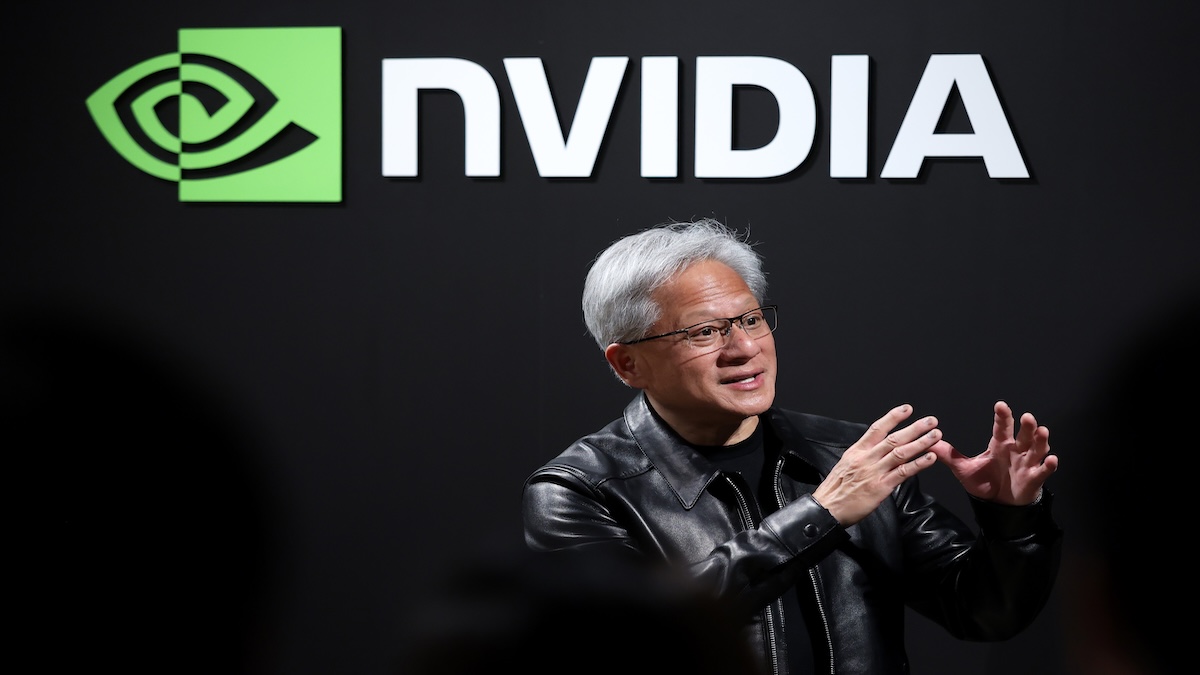
Nvidia Corp. has agreed to acquire artificial intelligence startup Hugging Face in a transaction valued at about $13 billion.
Wall Street dealers were already bracing for a potential record in September for high-grade US corporate bond sales, and recent surging yields may give the blue-chip companies even more reason to borrow now before funding costs rise further.
Federal Reserve Governor Christopher Waller said his next decision on interest rates will be “heavily influenced” by August inflation data due next week, adding it may not take much to nudge him toward supporting a rate hike at the Fed’s upcoming policy meeting.
By enhancing the input that goes into so much of what we do—intelligence—AI’s potential to drive higher economic growth is enormous. But with fears of the technology's unintended consequences affecting the pace and depth of adoption, the promise of long-term gains must be set against more immediate risks.
August 2026 was a blockbuster month for ETF acquisitions.
Anchoring is one of the most powerful—and underestimated—forces in financial decision‑making. Once an emotional label attaches itself to an idea, it becomes the lens through which people interpret everything that follows.
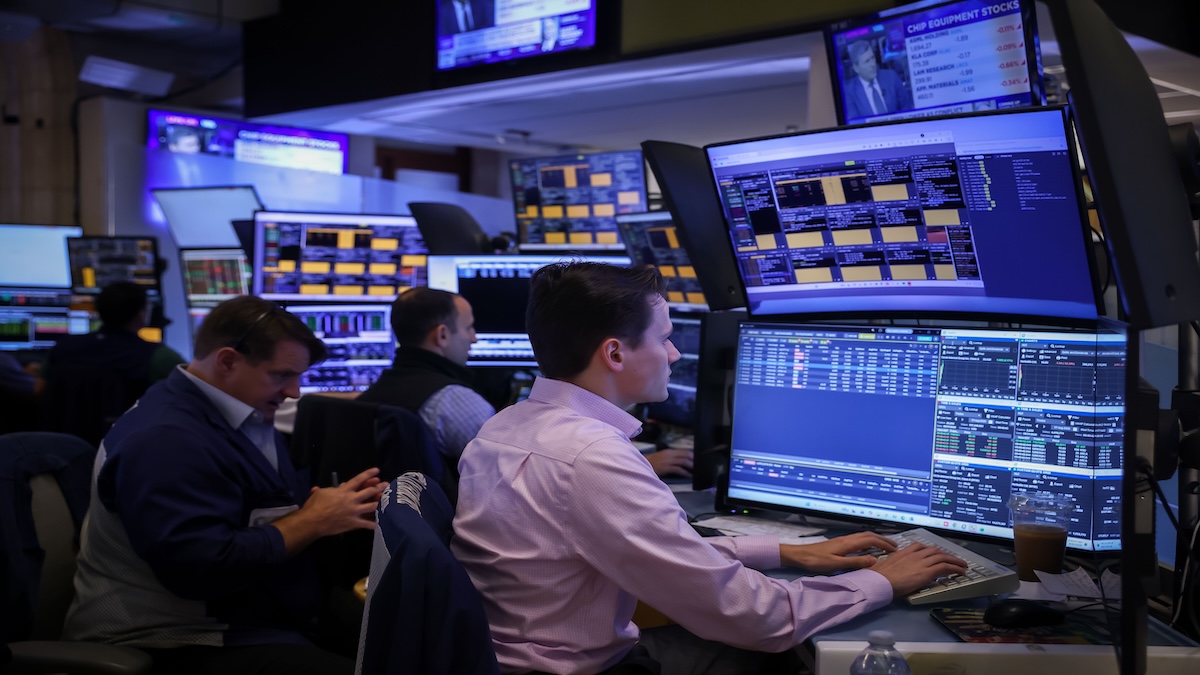
US stock futures posted modest gains Thursday as bond yields stabilized near multi-year highs and investors digested latest commentary from Federal Reserve Governor Christopher Waller. Chip stocks fell after Broadcom Inc.’s results.
House poised to pass bill to avoid government shutdown, two new members set to join the House, Fed chair speech boosts rate hike possibility, and national debt hits $40 trillion.
Geopolitical headlines can quickly move markets, but investors do not need to predict every headline to identify potential opportunity. The more useful question is what governments, businesses and consumers are doing in response to a changing strategic environment, and which companies may benefit.
The month of August reminded many investors that the markets rarely move in a straight line. A combination of encouraging economic fundamentals, uncertainty in the bond market and renewed geopolitical turmoil led to increased volatility and shifting market leadership. But the underlying backdrop reinforced that the US economy continues to expand at a sustainable pace.
The topic d’jure is that Kevin Warsh just gave his first Presser (Oh yes, we love that word) as new Chairman of the Federal Reserve, and it was fascinating, although in fairness, I have a Zen and the Art of Motorcycle Maintenance streak in me that delights in what others might consider head-rolling minutiae.
In this article, Russ Koesterich explains how strong fundamentals have supported stocks, but rising bond yields may soon begin to challenge market valuations.
Interim data takes center stage, with Costco, Ford, Robinhood and Charles Schwab offering fresh reads on consumers, autos and retail trading
US Treasury Secretary Scott Bessent made waves with his recent announcement that the Treasury would at least double the size of its buybacks of long-term debt in the coming months. He argues that long-term yields do not reflect fundamentals, suggesting that the Treasury's intervention is aimed to restore proper market functioning.
Markets opened on a sour note on Monday after Treasury Secretary Scott Bessent unveiled “Operation Economic Outcast.” This initiative was to include sweeping sanctions against Iran and the networks that enable the regime to evade existing restrictions. Bessent did not explicitly mention Iran’s enablers, but many assumed China was the primary culprit.
It’s back-to-school season, and the ETF market is closing out a summer that proved anything but slow. August brought $180 billion in fresh net ETF asset inflows and saw the number of new ETFs coming to market cross 1,000 for the year. August also saw a barbell strategy against macro risks become a popular approach with ETF investors.
The recent IPO of SpaceX and the anticipated IPOs of Anthropic and OpenAI are focusing attention on how to invest following a liquidity event. Here, we discuss several important decision points.
August was a good month in financial markets, with the S&P 500 up around 2.7%. The market leaders came from the commodity complex, with gold and bitcoin (not sure how this should be classified) being the two top performers.
This summer has delivered "blockbuster" returns, both positive and negative, while the possibility of quick and seemingly easy gains continues to draw investors toward speculative areas of the market. In his latest insight, Richard Bernstein, Global Head of Macro & Customized Investing, shares five charts that cut through the noise and highlight important shifts in credit creation, inflation, global growth, market leadership, and asset class performance.
The future of financial planning is not about advisors becoming therapists. It is about advisors becoming better facilitators of meaningful, structured conversations that lead to better decisions. You don’t have to start with perfect skills. Start with a better process.
There are ways to learn how to work with difficult people. I have a process I call ARTICA that I teach to help you shift your approach when someone is being difficult. Their behavioral style isn’t going to change, so you need to be the one to think of a different approach to see if you can shift yours. In turn, they might change their approach.
The firms I see succeeding with AI right now aren't the ones with the flashiest assistants. They're the ones whose compliance officers helped design the architecture instead of it being handed over after the fact. That single change — inviting compliance into the build, not just the review — is the difference between an AI program you can defend and one you're hoping no one ever questions.
Record fixed income ETF inflows in August pushed year-to-date ETF totals past $1.4 trillion, with short-term bonds leading the surge.
Billions in federal support are flowing toward nuclear energy, but most investors can't tell you which companies actually receive it. When a $17.5 billion manufacturing loan program was announced for AP1000 reactor supply chains, social media tagged the wrong tickers entirely. This session breaks down where that capital is really headed and how a thoughtful approach to index construction can provide more focused exposure to companies benefitting from that headline number.
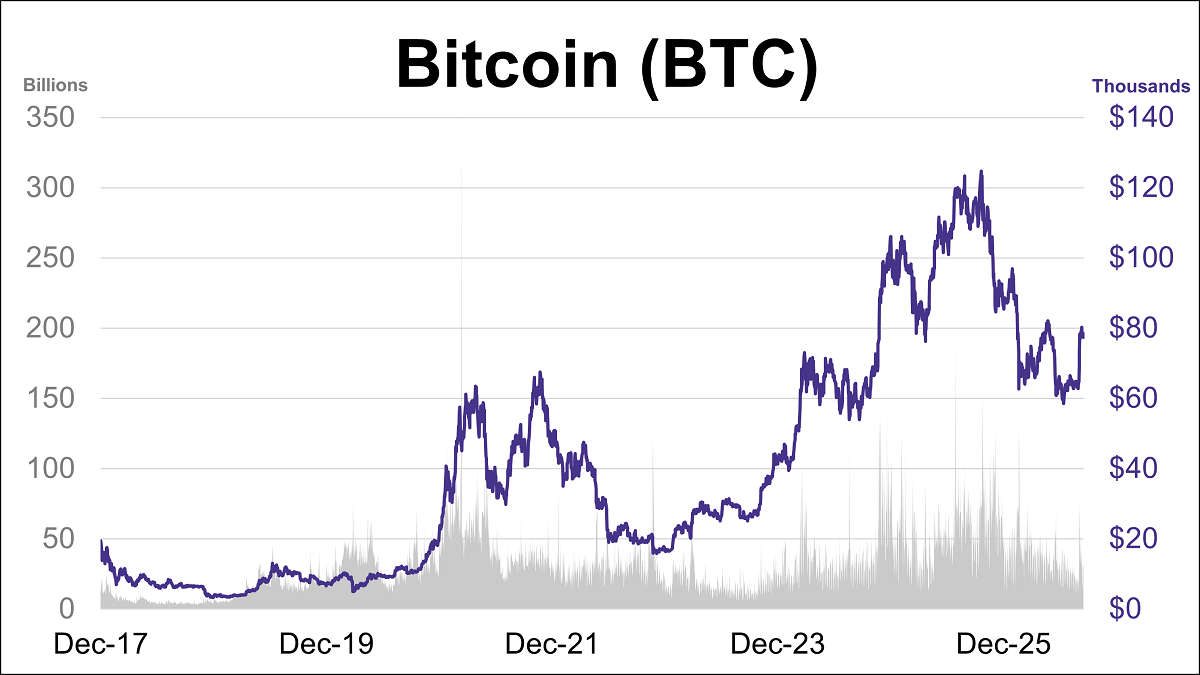
Bitcoin's closing price was down 1.5% this week. BTC is currently down approximately 12% year-to-date and sits about 38% below its October 2025 record high.
Americans like to spend money, and they’re good at it. But they also feel kind of bad about it.
Investors are being offered a new way to bet on space via a fund that focuses exclusively on a sector thrust into the limelight by the IPO of Elon Musk’s SpaceX.
US stocks flipped between small gains and losses on Wednesday after a three-day skid, as oil prices halted a sharp advance, easing inflation concerns as traders weigh the Federal Reserve’s potential path for interest-rate hikes.
Federal Reserve Chairman Kevin Warsh used his keynote speech in Jackson Hole, Wyoming, last week to map out some of the key data points he leans on to read the US economy, offering new insight into his approach to policy making.
Most people experience transportation through roads and airports. Traffic jams on highways and delays at major hubs are familiar frustrations. But the world's most important transportation network lies largely out of sight.
Kevin Warsh’s Jackson Hole speech was notably hawkish. But I came away from the speech even more confident in Warsh and thought it was one of the best speeches I’ve heard from a Federal Reserve chair. Most importantly, Warsh is refocusing on factors missing from the Fed’s framework for years: an explicit recognition that money supply and bank credit matter for the Fed’s inflation outlook.
Highly concentrated US equity markets have been a consistent theme in recent years. Now, after the latest reconstitution of a major US equity benchmark, concentration is taking on a new form, with the Magnificent Seven’s grip loosening and semiconductor stocks gaining more influence. In essence, millions of passive investors received a new portfolio without making a single decision.
Brightline has reached a deal with municipal-bond insurer Assured Guaranty Ltd. that would provide the debt-laden Florida railroad with at least $350 million in new loans if it heads into Chapter 11 bankruptcy, according to people familiar with the matter.