The S&P 500 hit a new record high in 3Q as strong earnings offset headwinds from oil returning to $100/bbl, the Fed hiking rates, and the 10-year Treasury crossing 5%.
The dollar rally is forging ahead as soaring oil prices weigh on currencies of energy importing nations and global inflation fears persist.
SpaceX investors are finally getting some reprieve after months of being whipsawed by volatility as the Elon Musk-led company’s stock breaks above the level it’s been stuck below since July.
Emerging markets (EMs) have historically been associated with commodity exports and low-cost manufacturing. Those characteristics remain relevant in parts of the investable universe, but the sources of competitive advantage have broadened materially.
Consumer sentiment falls in October to a five month low. The preliminary October reading for the University of Michigan Consumer Sentiment Index came in at 46.3. This marks a 3.7% (1.8 points) decrease from September.
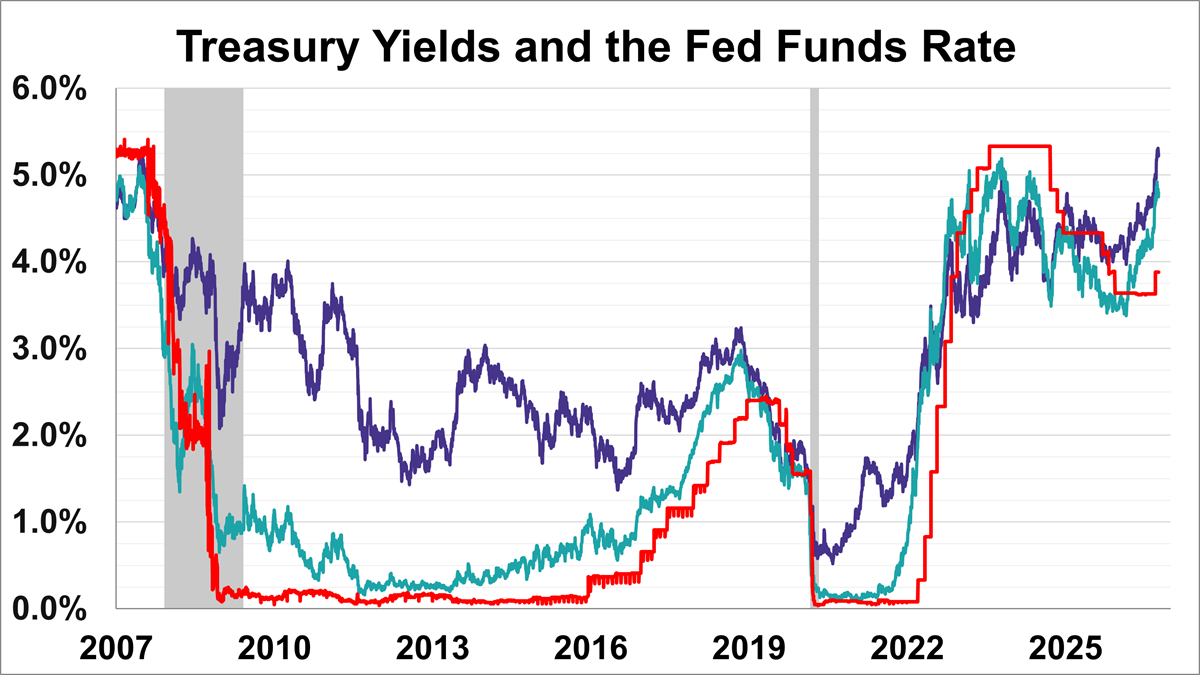
The yield on the 10-year note finished October 9, 2026 at 5.24% while the 2-year note ended at 4.80%.
With markets around the globe rattled by the bond sell-off, it may be time to pivot towards safe havens that still generate strong yield.
Active ETF flows offer a window into where the ETF ecosystem is going, and what its shifts and changes might mean for broader ETF innovation.
September ETF launches highlighted active strategies and an AI hardware ETF as year-to-date inflows reached a record $1.54 trillion.
Gold advanced as oil fell and an auction of 30-year US debt on Thursday drew solid demand, helping to pull long-dated yields from the highest levels in more than two decades.
The bull market in US stocks is showing few signs of stress as it approaches its fourth anniversary: Corporate profits are rock-solid, the S&P 500 Index is near a record and volatility appears subdued.
Advisors choosing between two similar ETFs often let the lower expense ratio decide, but that fee says little about a fund’s liquidity. It may not even point to the cheaper fund to own, according to State Street Investment Management research.
The important thing — the key to coming to a reasoned evaluation — is to understand the math of declines and advances.
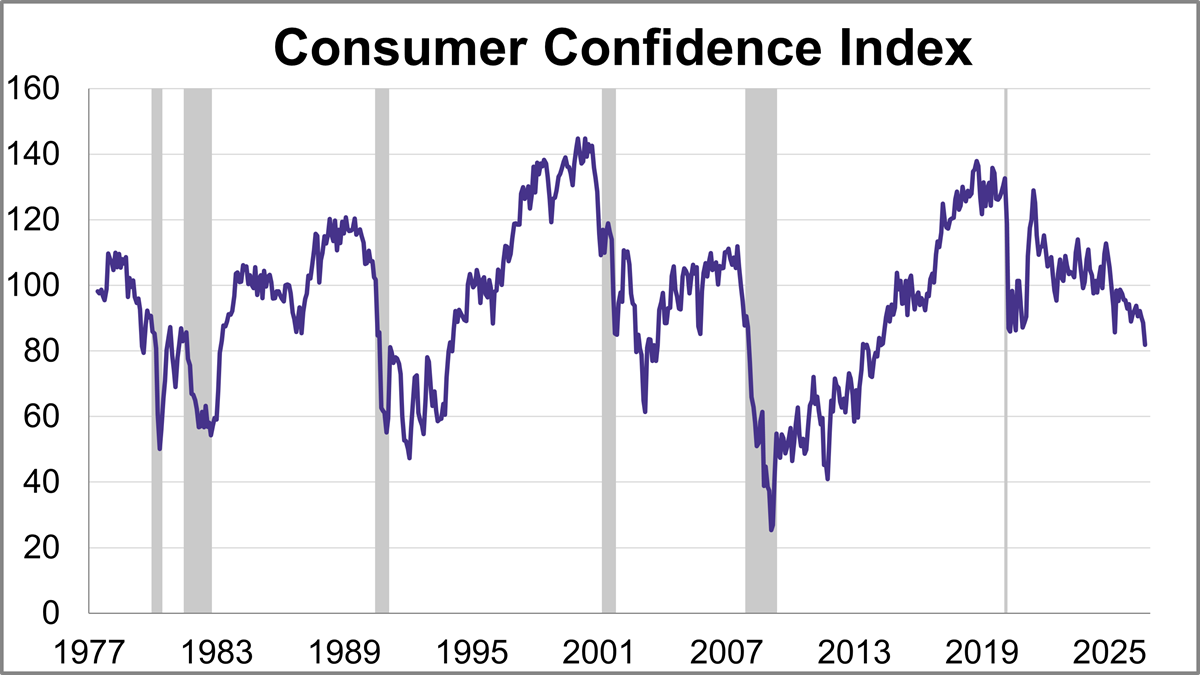
Consumer confidence is collapsing, hiring is weak and the housing market is largely frozen. All of which serves to underscore that the US economy is only holding up because of the boom in artificial intelligence and an aging population spending ever more on healthcare.
In 1954, golfer Tommy Bolt won the inaugural Rubber City Open at Firestone Country Club in Akron. Four years later, he returned to Akron as the reigning US Open champion, where in the third round he was paired with an 18-year-old amateur making his tour debut.
Investment performance is often measured by what a portfolio earns. But for investors with substantial assets across taxable, tax-deferred, and tax-free accounts, what they keep after taxes can be just as important.
ClearBridge Investments: With the economy still resilient, a gradual Federal Reserve hiking cycle could help broaden market leadership beyond the Magnificent Seven.
Sometimes, there’s safety in size. Semiconductor Goliath Nvidia (NVDA) is proving as much. Already one of the world’s largest companies by market capitalization, Nvidia is up 29.5% year-to-date. That extends a five-year run in which the stock surged 1,066%.
Broadly speaking, when advisors and investors consider adding focused industry exposure to a portfolio, there needs to be a strong justification for doing so. Take the AI industry, for example, where sustained buildout has driven many to target key tech players for exposure.
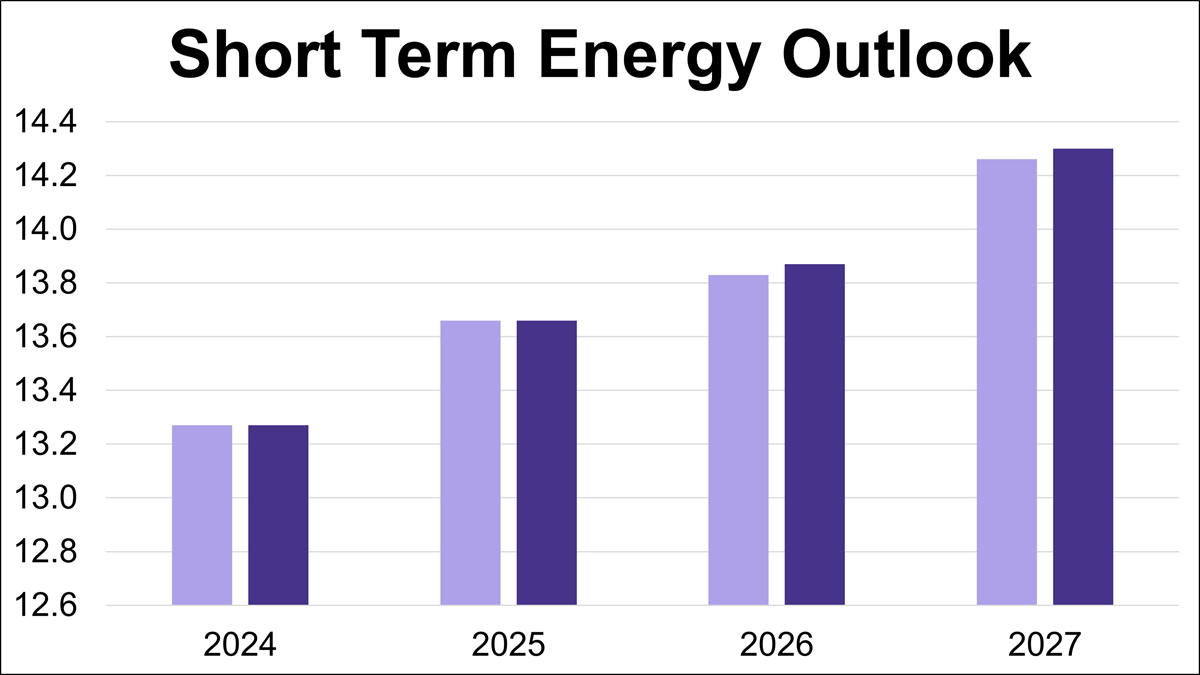
The U.S. Energy Information Administration (EIA) has released its latest Short-Term Energy Outlook (STEO), providing forecasts for energy markets. This article presents the annual production outlooks for crude oil, natural gas, and natural gas liquids (NGLs), comparing the October 2026 projections against the previous month's estimates.
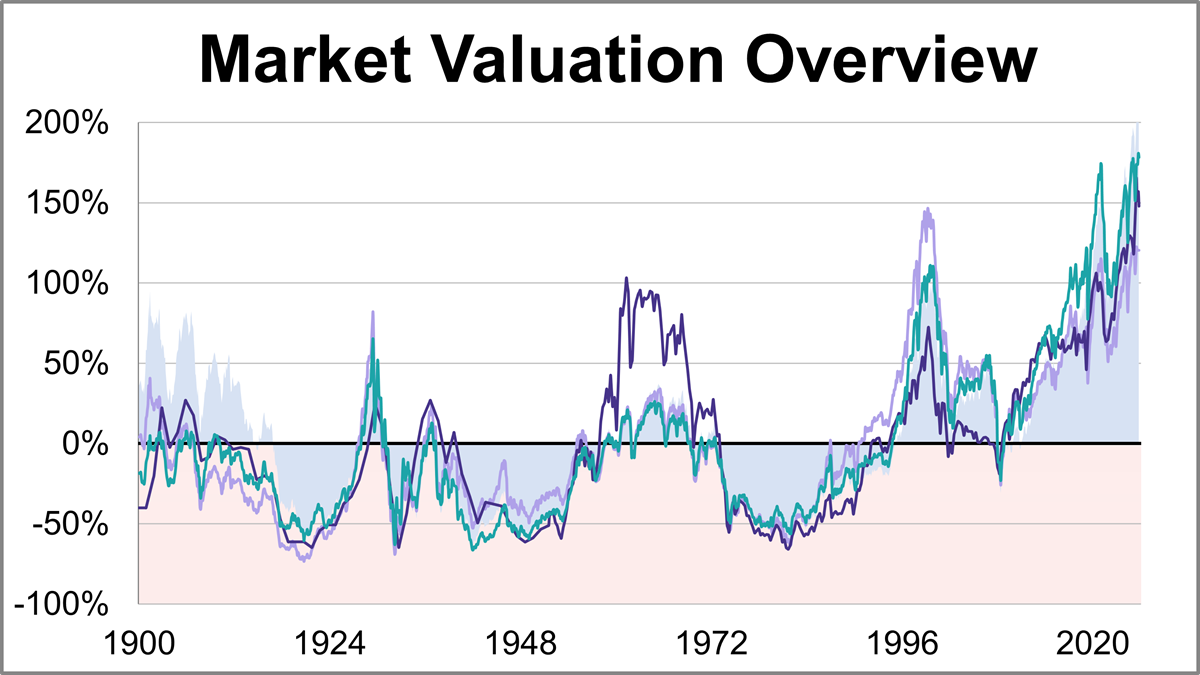
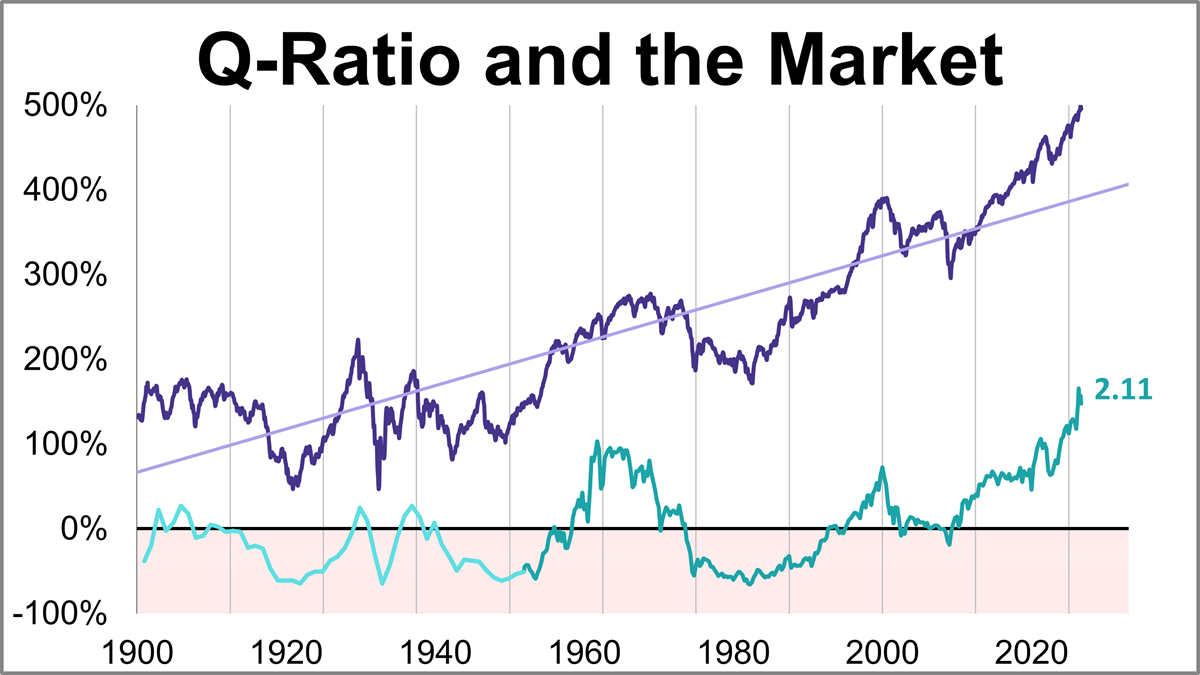
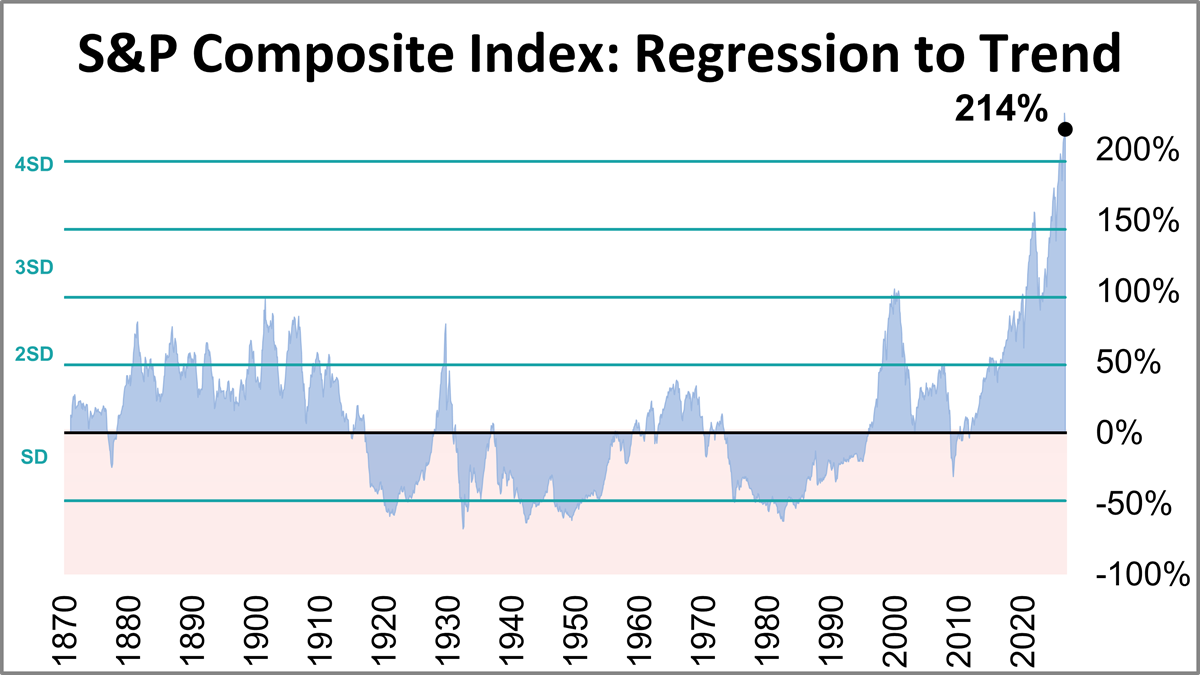
Here is a summary of the four market valuation indicators we update on a monthly basis.
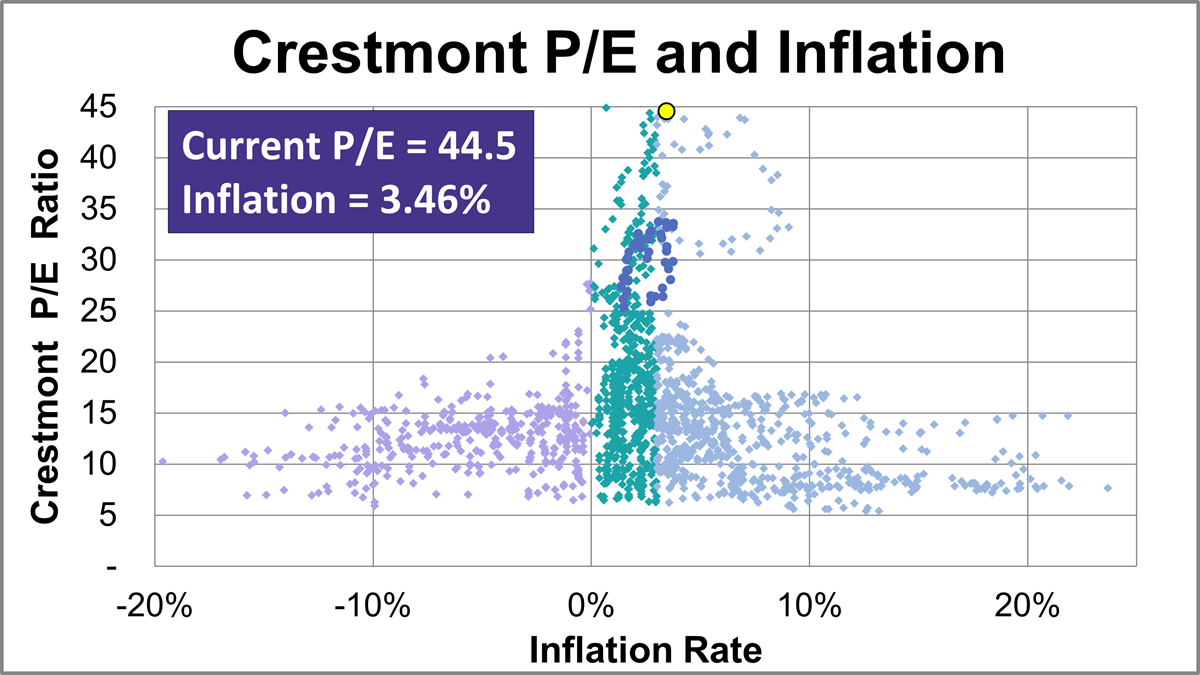
Based on September's S&P 500 average of daily closes, the Crestmont P/E of 44.5 is 188% above its arithmetic mean, 217% above its geometric mean, and is in the 100th percentile of this 14-plus-decade series.
The Q Ratio is the total price of the market divided by the replacement cost of all its companies. As of September 2026, the latest Q-ratio is at 2.11.
The inflation-adjusted S&P Composite Index was 214% above its long-term trend at the end of September.
Wall Street’s biggest banks are set to extend a months-long borrowing binge and issue more bonds than usual in the fourth quarter, raising funds to meet the insatiable financing needs fueling the artificial intelligence boom.
Is now the time for senior loans? Shifting yields and rising pressure make the floating rate yield vehicles an intriguing place to watch.
Amid heated discussion of the astonishing (and also rather worrying) capabilities of artificial intelligence, investors are realizing that the underlying computing and energy infrastructure relied upon by OpenAI, Anthropic PBC and their ilk is much harder to construct than a chatbot prompt.
Morgan Stanley Investment Management’s Vishal Khanduja, a top-performing bond investor, is turning bullish on US debt for the first time in a decade, with yields at two-decade highs serving as a check on economic growth.
Free-market-oriented economists probably live in a state of perpetual despair these days. Politicians and voters on both the left and right are turning on markets. Polls suggest widespread support for interventionist policies that economists long discarded for causing more harm than good.
Interest rates are on the rise, and, according to market expectations, the ascension may not be over quite yet.
On the surface, the municipal bond market may not check the “dynamic” box. After all, individual muni bonds and ETFs such as the ALPS BBH Intermediate Municipal Bond ETF (MNBD) are positioned, rightly so, as conservative, income-bearing investments.
Stocks chopped this summer as high hopes for AI product and infrastructure development were offset by rising inflation and an increasingly hawkish Federal Reserve.
Rising interest rates can affect more than investment portfolios. Explore how changing IRS interest rates may influence several estate, charitable and tax-planning strategies.
International stock funds outpaced U.S. large caps in September, as ETF inflows cooled and investors leaned toward defensive sectors.
Market participants have been conditioned to expect clear Forward Guidance from Fed Chairs and Ben Bernanke, Janet Yellen, and Jay Powell provided it continuously, especially after the Financial Crisis. Chairman Warsh has made it clear that Forward Guidance will be less under his leadership, but he has offered a very important qualifier that many have yet to grasp.
China’s latest effort to prop up its battered housing market and spur the economy is getting a poor reception. The measures are underwhelming and unlikely to achieve much beyond improving Beijing’s chances of meeting its already restrained growth ambitions.
Signs of resilient economic momentum are reinforcing the bull case for US small caps, which have been under pressure lately in the face of soaring borrowing costs.
In a world defined by rampant energy demand and electrification, battery tech is one of the more intriguing places to invest. While attention has turned to the big AI narratives and debates in the market, tech categories like battery innovation have plenty of opportunities.
Bond yields still look attractive, but investors are earning little extra for taking on corporate credit risk, according to Thornburg Investment Management.
Industrials are supported by increased capital spending in electricity capacity, construction around the artificial intelligence-related (AI) infrastructure buildout, defense, and energy, although higher costs and possible delays in data center construction could temper growth.
The most-read articles on Advisor Perspectives in September included a variety of topics, though the top story for the month focused on a key part of practice management — how you charge your clients.
If you only looked at the price of gold in September, you’d be forgiven for believing the bull market had run out of steam. The yellow metal fell 6.3% during the month, and some in the financial press were quick to say it had failed as a safe haven.
Paramount Skydance Corp. closed its $110 billion acquisition of Warner Bros. Discovery Inc. on Tuesday, completing one of the biggest media mergers of all time after engaging in a bruising battle for control with Netflix Inc. and fending off antitrust lawsuits.
Societal angst about AI continues to grow. Whether it’s concern about misalignment or potentially misdirected investment, the AI-may-be-bad narrative is gaining traction. In stark contrast, the AI trade in financial markets was alive and well in September of 2026.
Google parent Alphabet Inc. agreed to buy nuclear power from Constellation Energy Corp. in a deal that will spur the addition of 890 megawatts of new reactor capacity. The power producer’s stock soared.
The S&P 500 rose 0.6%, reaching its first record high in two months, buoyed by resilient corporate profits and a pullback in oil prices.
Our real gross domestic product (GDP) forecast for 2026 is 2.5% (based on our Global Investment Management Survey) versus the Federal Reserve’s (Fed's) forecast of 2.2% and the Wall Street consensus of around 2%.
Long viewed as an emergency brake for macroeconomic panic, gold is starting to prove itself as much more than a crisis asset.
September’s fixed income sell-off marked a watershed moment for muni bond markets, delivering the steepest drawdown since the 2008 Great Financial Crisis. As benchmark yields spiked, prices across muni ETFs fell in tandem, and the volatility has not let up. This week, both 10-year and 30-year Treasury yields climbed to their highest levels since 2002.
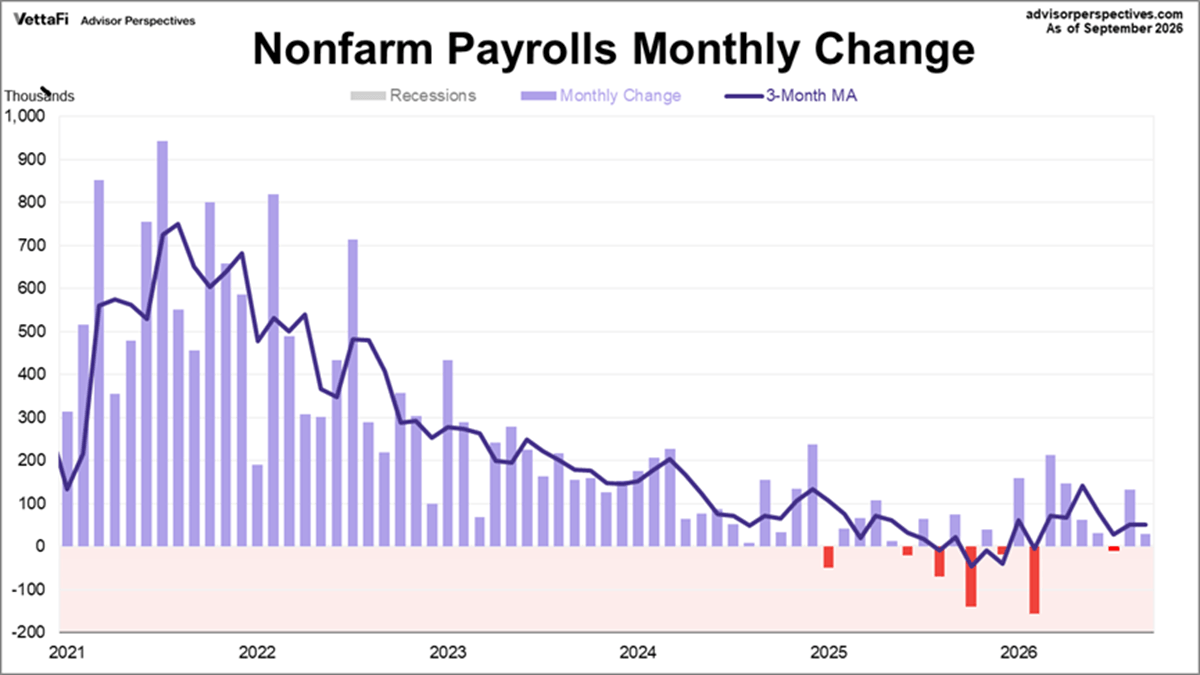
The latest employment report showed that 29,000 jobs were added in September, compared to August's 133,000 gain. This figure was significantly lower than the projected addition of 89,000 jobs. Meanwhile, the unemployment rate increased slightly from 4.1% to 4.2%.