In the week ending January 4th, initial jobless claims fell to their lowest level since February 2024. Initial jobless claims were at a seasonally adjusted level of 201,000, a decrease of 10,000 from the previous week's figure. The latest reading was better than the 214,000 forecast.
With 2024 behind us, let's revisit the top 10 most-read charts of the year.
The Conference Board Leading Economic Index (LEI) increased slightly in November. The index rose 0.3% from the previous month to 99.7 after eight consecutive monthly declines.
As 2023 comes to an end, let’s revisit the top 10 most-read AP charts of the year.
The latest Underlying Inflation Gauge full data set for September is 2.9%, down 0.1% from last month, while the prices-only measure is 2.2%, down 0.2% from last month. Current Headline CPI is now 3.7% and Core CPI is 4.2%.
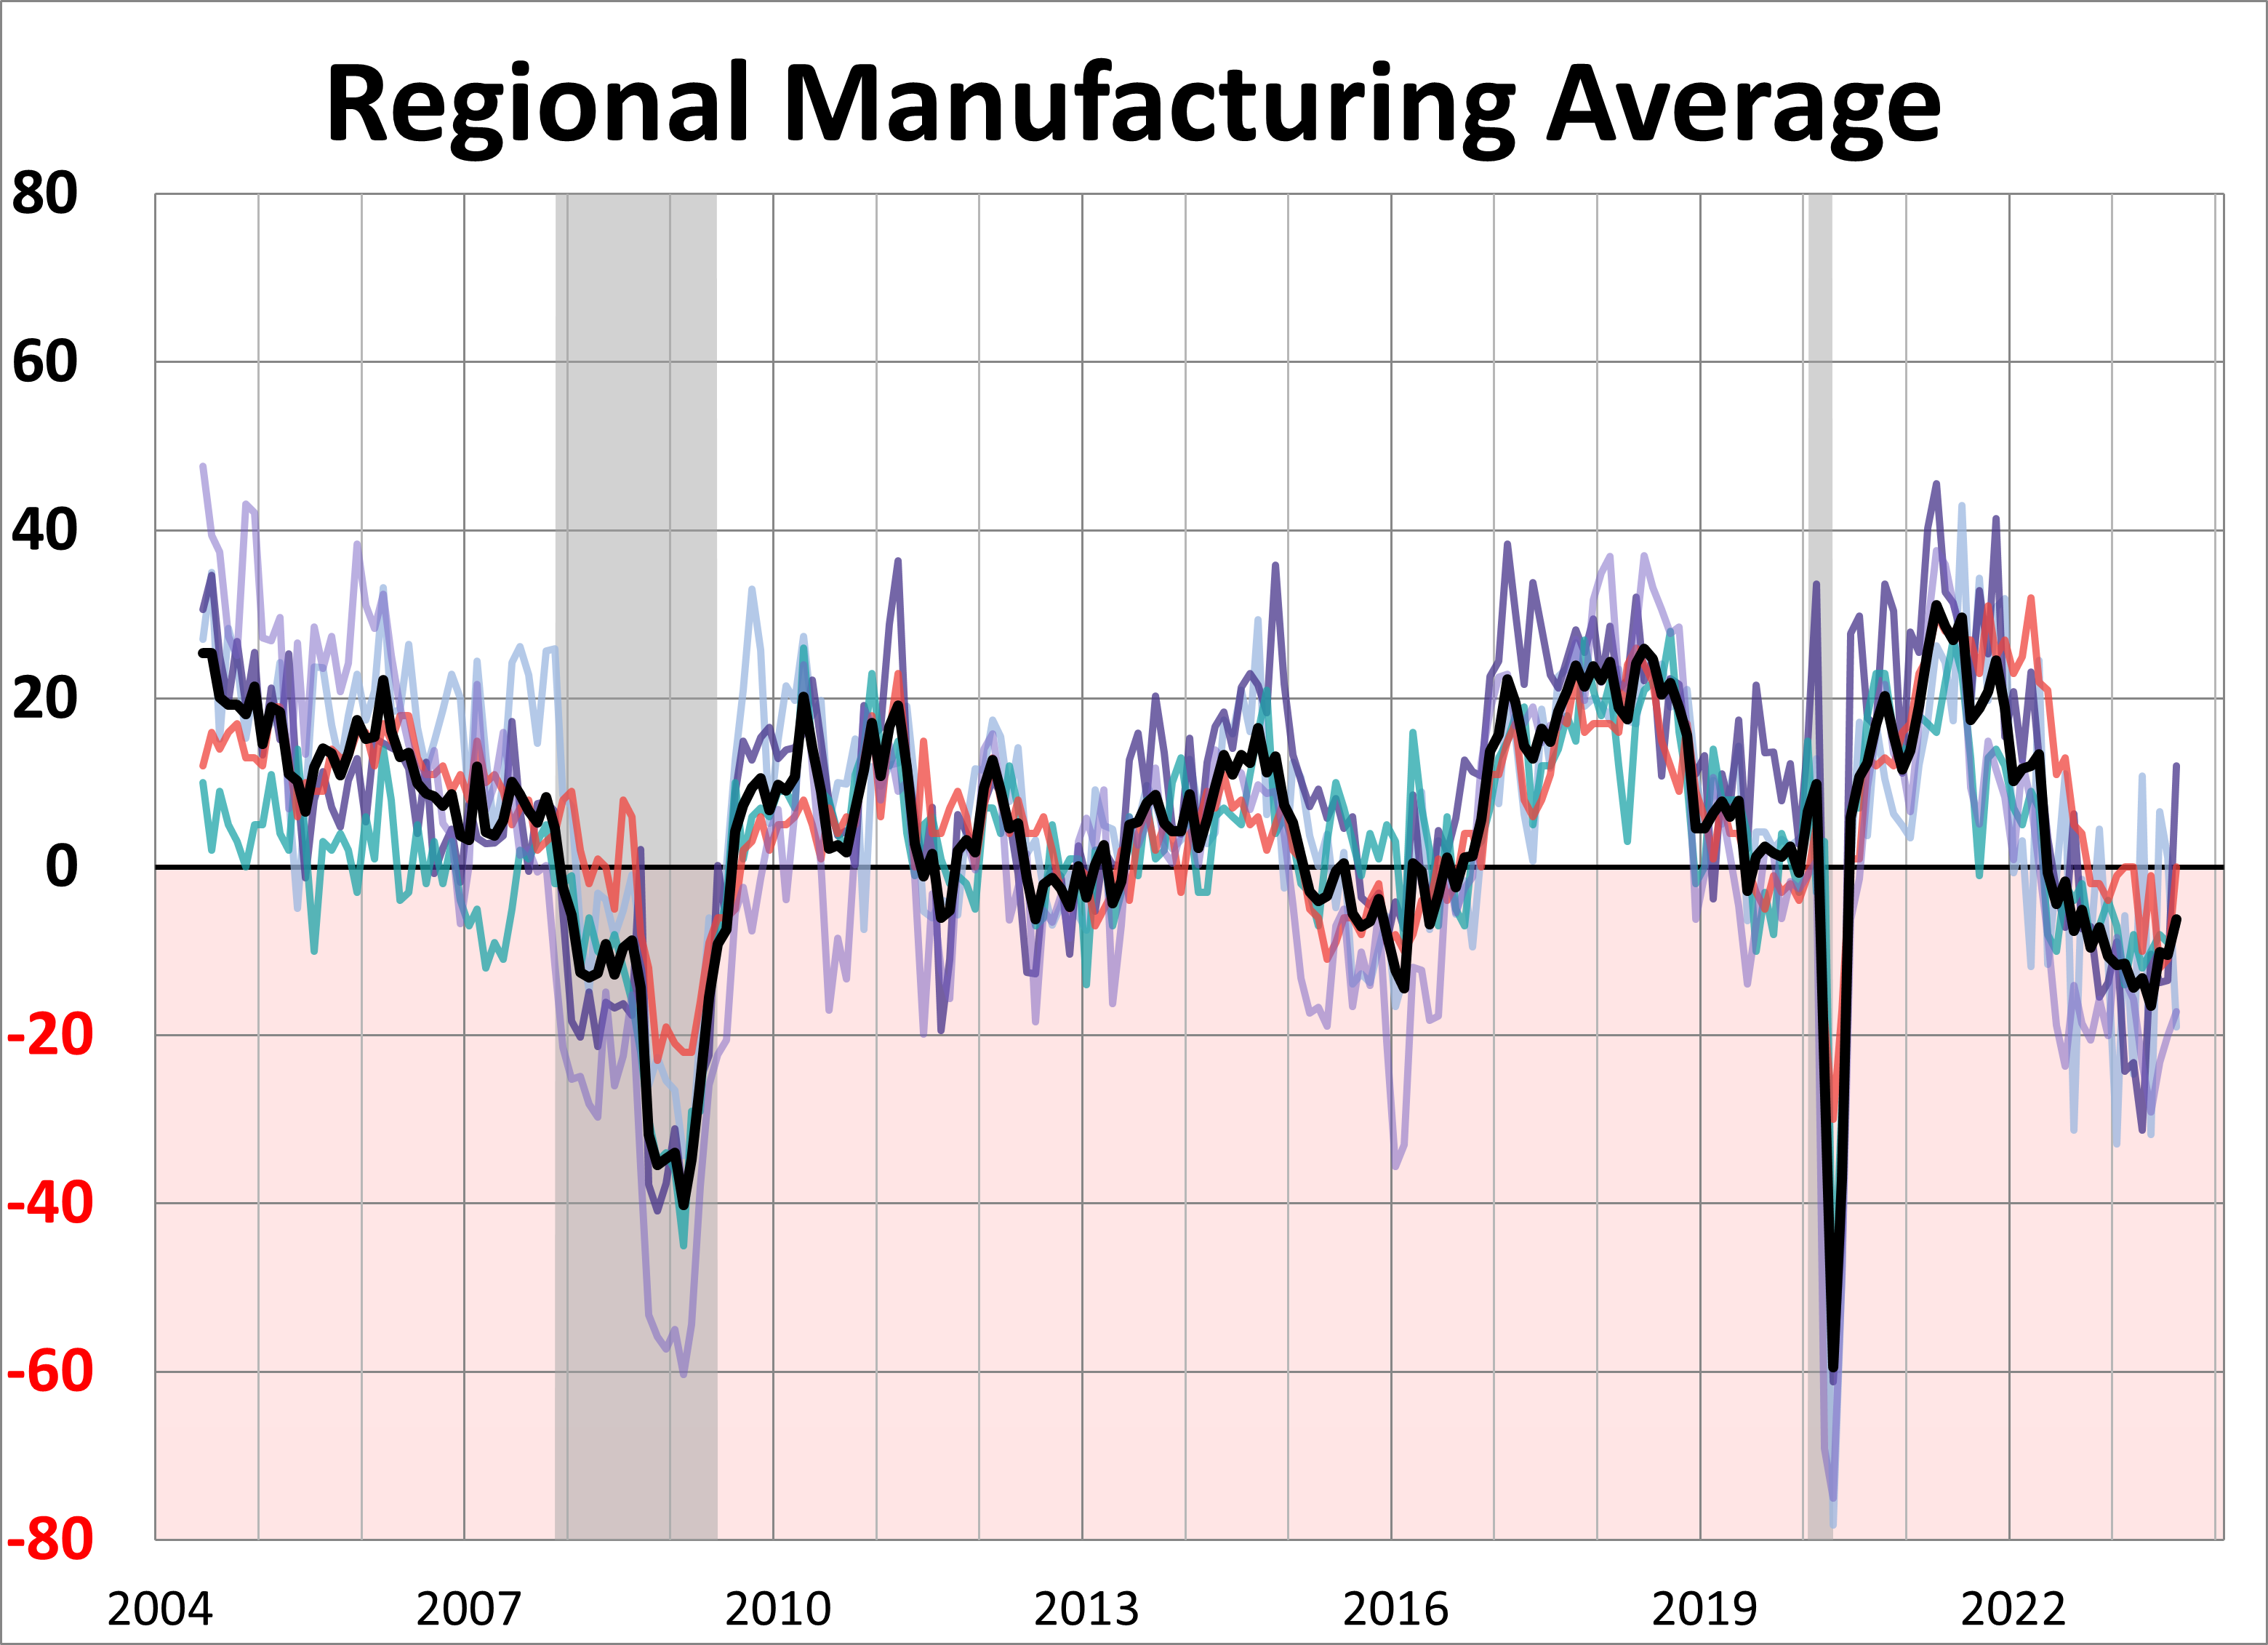
Five out of the 12 Federal Reserve Regional Districts currently publish monthly data on regional manufacturing: Dallas, Kansas City, New York, Richmond, and Philadelphia. The September average of the five districts is -6.5, down from the previous month.
We've updated our periodic look at the Philly Fed ADS Index which includes real GDP (Q2 2023 third estimate) and initial jobless claims through 9/23.
The Census Bureau has posted its advance report on new orders for durable goods for August. This series dates from 1992 and is not adjusted for either population growth or inflation. Let's review durable goods data with those two adjustments.
The Chicago Fed's National Activity Index is based on 85 economic indicators drawn from four broad categories of data. Two of the four broad categories of indicators used to construct the index decreased from July. All four categories made negative contributions in August.
The U.S. Census Bureau and the Department of Housing and Urban Development published their August findings for new residential housing starts and building permits. Over the long haul, the two series offer a compelling study of trends in residential real estate. Here is an overlay of the two series since the 1959 inception of the starts and permits data, which was tracked beginning a year later.
The latest monthly employment report showed 187,000 nonfarm jobs were added in August. An industry breakdown of that number shows a gain of 151,000 service-providing jobs and a gain of 36,000 goods-producing jobs.
Here's the top 10 most popular AP Charts of 2022.