RILAs: Buffers are Still Much Better than Floors
Membership required
Membership is now required to use this feature. To learn more:
View Membership Benefits Registered index-linked annuities (RILAs), also called indexed-variable annuities and structured annuities, continue to gather significant assets. I originally released a paper for the Alliance for Lifetime Income, as well as series of articles in Advisor Perspectives (see here, here, here and here), exploring RILAs in April 2021. In one particular article, I noted that buffer RILAs were significantly more efficient than floor RILAs. These findings are worth revisiting given the change in market conditions since then (e.g., the increase in bond yields).
Using a similar utility-based portfolio optimization framework, updated to reflect the current market environment, I had relatively identical findings, where buffer RILAs (technically a 10% buffer with annual point-top-point crediting with the S&P 500 as the underlier) received significant portfolio allocations, while the floor RILAs received no portfolio allocation whatsoever, even if the assumed cap is doubled (from 14% to 28%).
Overall, this analysis shows that the potential benefits of RILAs vary significantly by design and that buffer RILAs have historically been a more attractive addition to a portfolio than floor RILAs.
Buffers and floors
RILAs are a riskier version of fixed-index annuities (FIAs), where the upside potential is going to be higher than a FIA, but the investor has the possibility of incurring a loss (i.e., negative return), depending on the structure. RILA strategies typically come in two flavors: floor and buffer.
With floor products, the downside is limited to a stated percentage, such as 10%. For example, if the floor is 10%, apart from the insurer’s default or inability to honor its claims-paying commitments, you can’t lose more than 10% regardless of the return of the underlying index (e.g., the S&P 500). A RILA with a 0% floor would have the same risk profile as a FIA.
With buffer products, the first amount of loss is absorbed by the product, based on the buffer level; but the investor would suffer any loss beyond that point. For example, if the buffer is 10% and the return of the underlier was -40%, the investor would lose 30%. If the return of the underlier is negative but greater than the noted buffer, the return would be 0% (e.g., if the buffer is 10% and the underlier returns -5%, the investor return would be 0%).
The risks for buffers and floors vary notably, where the floor provides the worst possible return, while the buffer exposes the annuitant to downside tail risk. The next exhibit illustrates the differences in the expected strategy return for different underlier returns for a 10% floor RILA with an assumed cap of 14% and a 10% buffer RILA with an assumed cap of 20%, as well as the total return of the index (RILA returns are credited based on the price return of the index, which exclude dividends).
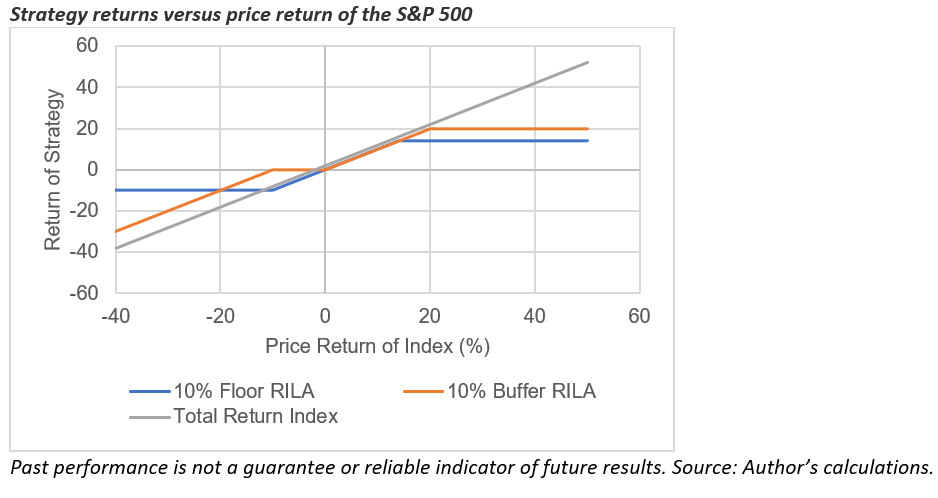
While the 10% buffer RILA clearly has more downside risk than the 10% floor RILA (when the underlier returns are worse than -20%) that downside needs to be contrasted with higher credited returns when the return is negative but greater than -20%. Additionally, the 10% buffer RILA has more upside. Therefore, viewing the credited returns doesn’t necessarily provide context for how efficient the respective strategies are, which I explore in the next section.
Analysis
Optimal portfolios for this analysis are determined using a constant relative risk aversion (CRRA) utility function where the goal is to maximize the certainty-equivalent wealth given the respective risk aversion levels, assuming a one-year investment period. This utility model captures the unique return distribution associated with RILAs (i.e., does not have to assume returns are normally distributed). For the analysis, I generated 1,000 years of returns using the capital market assumptions (CMAs) below (which are based on PGIM Quantitative Solution’s Q4 2022 estimates) assuming returns are multivariate normal.
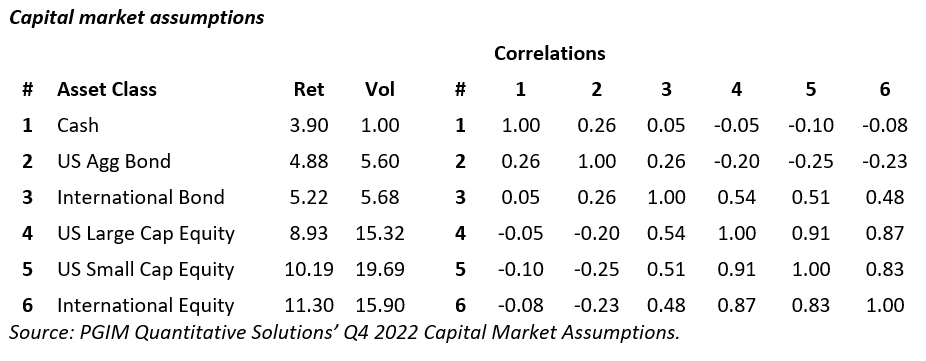
The dividend yield on U.S. large-cap equity is assumed to be 1.8%, which reduces the credited return of the RILA, since it is based on price return. A .5% fee is assumed to reduce the return of the portfolio. This is because the RILAs considered for the analysis include advisor compensation. The allocation to international equity is constrained to 30% of the total equity allocation so that it does not dominate the portfolio allocation.
Two RILAs are considered for the analysis, one with a 10% buffer and one with a 10% floor. Both are assumed to have the S&P 500 as the underlier. The cap for the 10% buffer RILA is assumed to be 20%, while the cap for the 10% floor RILA is assumed to be 14%. These caps are based on actual caps consistent with products available today and verified using actual options prices as well as a model based on the Black-Scholes options-pricing model.
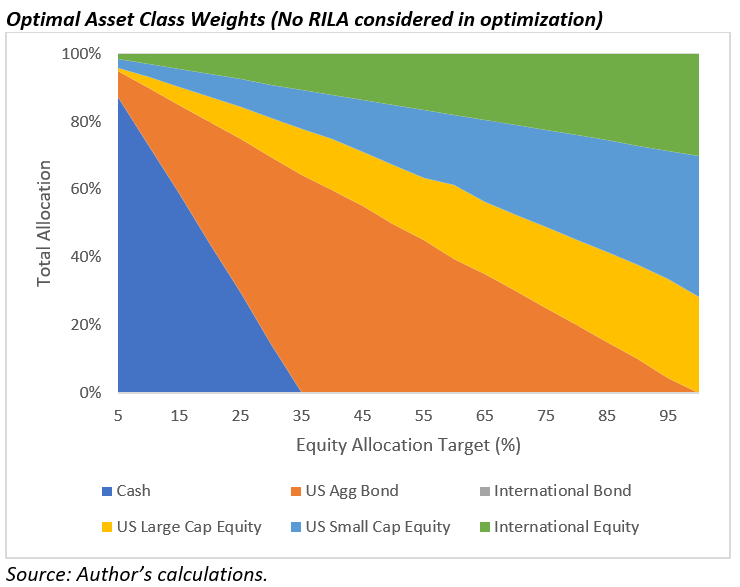
For the analysis, I determined the risk aversion coefficient (γ) for the CRRA required to generate an equity allocation for optimizations that does not include the RILAs from 5% to 100% in 5% increments (i.e., 20 portfolios). I did not consider the 0% equity portfolio because this would be for an incredibly conservative portfolio for which a RILA would likely not be suitable (an FIA could be worth considering, though).
The exhibit below provides context for the optimal asset class weights for optimizations that do not include the RILAs.
Next, I ran the same series of optimizations but included both the 10% buffer RILA and the 10% floor RILA in the opportunity set. The resulting allocations are included in the exhibit below.
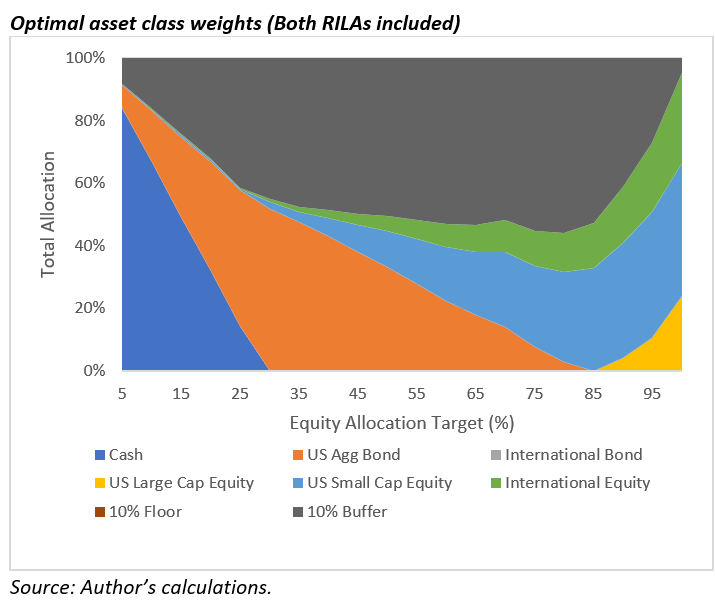
While the 10% buffer RILA allocations are relatively significant, representing 55% of total weights for the 65% equity allocation target, the 10% floor RILA did not receive an allocation for any of the optimizations. Even when I reran the 10% floor RILA without the 10% buffer RILA, the 10% floor RILA did not receive an allocation.
Additionally, I doubled the assumed cap for the 10% floor RILA, and even then, it did not receive an allocation. In other words, the results of the optimizations suggest that the buffer RILA is significantly more beneficial than a floor, consistent with my past findings.
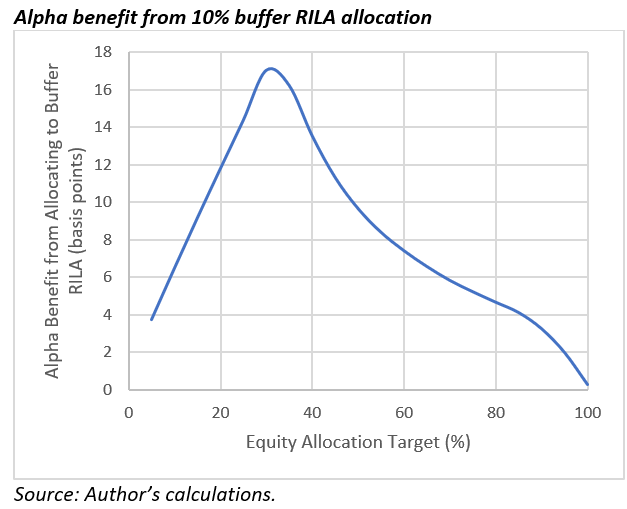
The exhibit below provides context on the alpha benefit from allocating to the RILA in the portfolio, which is estimated by comparing the certainty-equivalent wealth for the portfolios that exclude the 10% buffer RILA to those that do. The alphas increase as the allocations increase, peaking at approximately 17 basis points for the 30% equity allocation target.
The equity-like risk of the buffer RILA
One important question that many advisors have regarding RILAs is how they should be considered in a portfolio. This is a topic I’ve tackled previously using a substitution approach, where I found the equity-like risk of buffers could be approximated using the following formula (which was focused on products with one-year term):
Equity-like risk = 100 – 4 * (the buffer level).
The estimated equity-like risk for a 10% buffer RILA would be 60%.
The original research exploring this topic was published in July 2021 when interest rates were notably lower (e.g., yields on the 10-year Treasury was approximately 1.3% versus 3.5% in January 2022). Therefore, it’s worth revisiting this model to ensure it is still relevant.
To determine the equity-like risk of the 10% buffer RILA, I estimated the implied equity allocation for the buffer RILA to equal the target equity allocation, taking into to account the other allocation to equities. This is a simpler type of substitution analysis than the previous approach, but it does provide useful context. The estimated risk levels are included below.
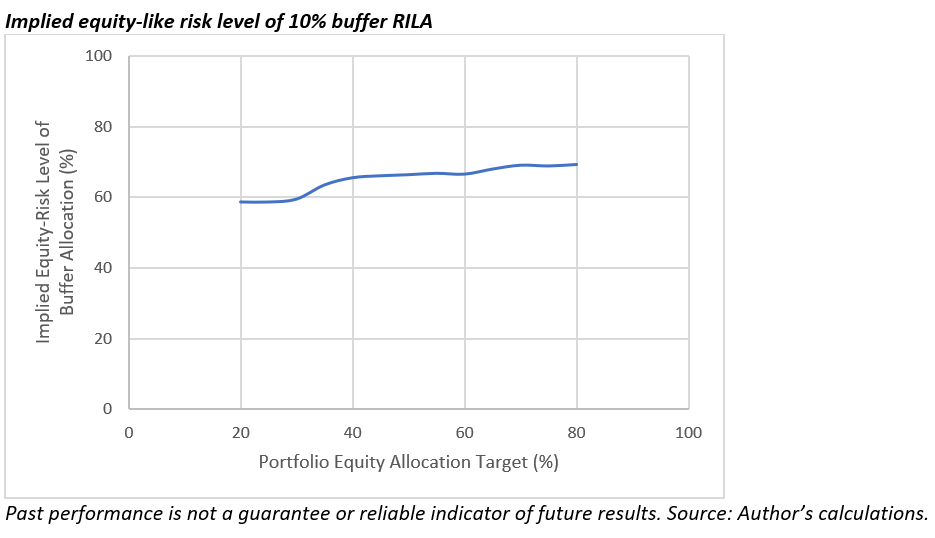
The results were notably consistent with past findings, where for most allocations the approximate equity-like risk for the 10% buffer RILA is approximately 60% (although closer to 65% in the graphic).
Conclusions
An emerging variety of RILAs are available for financial advisors and their clients. This analysis demonstrates that the potential benefits of a RILA vary significantly by structure. For example, while the buffer RILA considered in the analysis received relatively significant allocations (up to approximately half of the total portfolio), the floor RILA considered did not receive an allocation, even if the cap was doubled.
This analysis shows not only should financial advisors prefer buffer RILAs over floor RILAs, but understanding the potential benefits of a given RILA strategy before using it is critical.
David Blanchett, PhD, CFA, CFP®, is managing director and head of retirement research at PGIM DC Solutions. PGIM is the global investment management business of Prudential Financial, Inc. He is also an adjunct professor of wealth management at The American College of Financial Services and a research fellow for the Retirement Income Institute.
Disclosure
Past Performance does not indicate future results.
Index-linked variable annuity products are complex insurance and investment vehicles and are long-term investments designed for retirement purposes. There is risk of loss of principal if negative index returns exceed the selected protection level. Gains or losses are assessed at the end of each term. Early withdrawals may result in a loss in addition to applicable surrender charges. Please reference the prospectus for information about the levels of protection available and other important product information.
Investors should carefully consider the features of the contract, index strategies, and the underlying portfolios' investment objectives, policies, management, risks, and charges and expenses. This and other important information are contained in the initial summary prospectus and the index strategies prospectus for the contract and the summary prospectus or prospectus for the underlying portfolios (collectively, the "prospectuses") which can be obtained by contacting the National Sales Desk. Clients should read the prospectuses carefully before investing.
It is possible to lose money by investing in securities.
This material is being provided for informational or educational purposes only and does not take into account the investment objectives or financial situation of any clients or prospective clients. The information is not intended as investment advice and is not a recommendation about managing or investing a client’s retirement savings. Clients seeking information regarding their particular investment needs should contact a financial professional.
All guarantees, including benefit payment obligations, index strategy crediting, or annuity payout rates, are backed by the issuing company's claims-paying ability and do not apply to the underlying variable investment options.
The S&P 500® Index is a product of S&P Dow Jones Indices LLC ("SPDJI"), and has been licensed for use by Pruco Life Insurance Company. Standard & Poor's®, S&P® and S&P 500® are registered trademarks of Standard & Poor's Financial Services LLC ("S&P"); Dow Jones® is a registered trademark of Dow Jones Trademark Holdings LLC ("Dow Jones"); and these trademarks have been licensed for use by SPDJI and sublicensed for certain purposes by Pruco Life Insurance Company. Pruco Life Insurance Company's Product(s) is not sponsored, endorsed, sold or promoted by SPDJI, Dow Jones, S&P, their respective affiliates, and none of such parties make any representation regarding the advisability of investing in such product(s) nor do they have any liability for any errors, omissions, or interruptions of the S&P 500 Index. It is not possible to invest directly in an index.
For Financial Professional Use Only. Not for Use With the public.
1071132-00001-00 Ed. 06/2023
PGIM DCS-3063688
A message from Advisor Perspectives and VettaFi: Equities are essential portfolio building blocks. Join VettaFi for the Equity symposium.
Membership required
Membership is now required to use this feature. To learn more:
View Membership BenefitsSponsored Content
Upcoming Virtual Events View All


