This is the second piece in a series focused on strategies that use financial options to “reshape” the expected return distribution of an index such as the S&P 500. In part 1, I provided an overview of registered index-linked annuities (RILAs), which can be thought of as a riskier version of fixed index annuities (FIAs). With a RILA, there is the possibility of a loss, but the potential upside improves.
In part 2, I will explore three potential approaches to implement these options-based strategies:
- Do-it-yourself (DIY), where an investor builds the strategy on their own;
- Use an ETF; or
- Use a RILA.
In Part 3, I will more explicitly contrast floor and buffer approaches and, in part 4 will provide perspective about how options-based strategies can fit within a portfolio framework.
The explicit and implicit costs and potential benefits of the three implementation approaches differ. For example, some advisors and investors are likely to be attracted to the relatively low costs associated with a DIY approach. ETFs simplify implementation but come with fees (around 75 bps). RILAs are less liquid than a DIY or ETF strategy (e.g., have terms that typically last five or more years), but the illiquidity comes with a higher options budget (i.e., greater cap rate). Plus, RILAs can have lower fees than similar ETF strategies (25 bps versus 75 bps).1
A DIY strategy can work, but it’s not clear how many investors or advisors will be interested in directly purchasing options – especially if it’s only for a small piece of a portfolio. ETFs are attractive for an investor who wants to create the respective risk exposure but isn’t interested in buying and selling individual options, despite the fees (something I’ll address more directly in part 4). RILAs are the best approach for investors who are okay with the illiquidity given the increased expected returns associated with the approach, which are higher than both the DIY and ETF options.
Options pricing
The overarching theme of this series is the benefits of using financial options within an investor’s portfolio. There’s no free lunch when it comes to investing (other than, maybe, diversification) and therefore the costs of a given strategy must be weighed against its expected benefits.
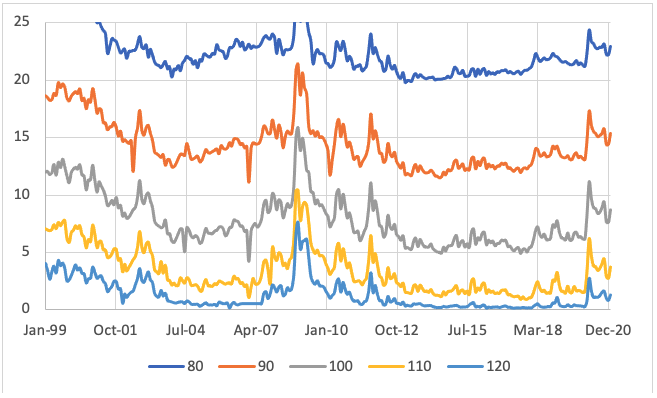
The cost of financial options varies based on various factors such as implied volatility, interest rates, etc. The exhibit below demonstrates how historical options prices have varied from December 1999 to December 2020 based on data obtained from deltaneutral.com on the SPX. Since options are not generally available that have a precise one-year expiration, I used interpolation and regressions to estimate the respective premiums.
The cost of call options at various relative strike prices: December 1999 – December 2020
For strategies with no downside risk, such as a FIA, the exposure can be obtained by purchasing a zero-coupon bond and an at-the-money call option, and selling an out-of-the-money call option. The difference in the strike prices for the call options is based on the respective cost of the options (i.e., premiums) and the available budget. The higher the budget (i.e., higher the interest rate), the greater the potential upside.
FIAs have no potential for loss, assuming the product is held to its term and ignoring the implications of insurer default. By introducing the potential for a negative return (i.e., selling puts), the options budget can increase, potentially significantly.
Determining the options budget
In theory, the money available to purchase options to create the upside exposures (the options budget) should be identical across investor-types (DIY, ETF and RILA), but that’s not the case. The product structure and investor type will impact the effective cost of the zero-coupon bond.
For example, for an individual investor, the risk-free rate is best proxied by government bond yields for the respective term under consideration. For this analysis, I assumes one-year term, and one-year government bond yields are effectively zero.2
While an investor could use a riskier bond (or bond fund) as the zero-coupon, it would add default risk. The “yield” of any type of corporate bond investment is not necessarily its realized return, given the impact of defaults, which can be significant.
Therefore, I assume the interest rate for a DIY approach is effectively based on government bond yields (or some other form of super high-quality bond), which would also apply to the ETF.
For RILAs, the interest rate (i.e., options budget) is likely to be higher than for a DIY approach for two reasons. RILAs typically have specific product terms, such as six years, which increases the duration for the zero-coupon bond. For example, yields increase by approximately 85 bps moving from one to five-year government bonds. This is an illiquidity premium, due to the higher yields attributable to reduced access within a RILA. Second, insurance companies are able to leverage their balance sheets to generate higher returns than other similar “guaranteed” assets. This effect is evident when comparing the yield on multi-year guaranteed annuities (MYGAs) to other similar “guaranteed” assets. Combined, the options budget for a RILA will be higher than other similar liquid strategies, something I empirically address later in this piece.
Product costs
While there were once significant costs for trading in financial markets, the cost to purchase options (and stocks) is effectively zero given commission-free trading on a variety of online brokerage platforms. While there may be some small explicit trading costs on different platforms, many offer trading at little or no cost. While an individual investor may need to get special approval to sell certain types of options (e.g., a naked out-of-the-money put option), this is unlikely to be a significant barrier to someone interested in pursuing such a strategy.
Also, while there may be some small expenses associated with implementation (e.g., depending on the assumed safe investment), the cost should not be material.
While there may be an additional cost imposed by the financial advisor, I’m assuming this is constant across approaches (i.e., the advisor is going to charge the same whether it’s DIY versus ETF versus RILA).
There are going to be additional explicit costs when selecting a prepackaged solution, such as an ETF or RILA. When focusing on ETFs, there are relatively few companies offering floor-and-buffer strategies, and there are differences with respect to underliers and expense ratios. For example, Allianz offers its “Buffered Outcome ETFs” that are released quarterly with either 10% or 20% buffer on the S&P 500 with a 74 bps expense ratio. Innovator offers a wider variety of underliers in its “Defined Outcome ETF” series,3 however, with expense ratios closer to 80 bps.
There are potential tax advantages to owning ETFs versus the options directly. Assuming there are no distributions, any gains would only be realized when the ETFs are sold.
ETFs should be priced competitively/fairly when the expense ratios represent the only explicit cost for the strategy and serve as a “convenience fee” with respect to implementation. If an investor is interested in using an options-based strategy for a significant portion of the portfolio, it may make sense to go the DIY route – but the ETF is worth the ~75 bps for investors who aren’t interested in creating the exposures themselves but want the strategy in their portfolio (especially if it’s a buffer approach). More on this in parts 3 and 4.
ETFs versus RILAs: Product example
The ETF versus RILA decision is more nuanced. Both are prepackaged products, but with important differences. While an ETF is has daily liquidity, a RILA requires an investment for some minimum term (e.g., six years), where access to principal will be limited and penalties could be accessed if the product is surrendered before the full term.
The lack of liquidity will be unattractive for some investors; however, there is a benefit associated with illiquidity. As noted previously, the longer product term of a RILA enables the insurance company to invest its funds at a higher rate of return, which increases the options budget.
The fees for a RILA may be lower than for comparable ETFs. For example, the Allianz Index Advantage Variable Annuity (which is a RILA) has an annual expense ratio of 25 bps, compared to the 74 bps for the Allianz Buffered Outcome ETFs. These products offer the same buffer levels for the same period (which reset annually) with the same underlier (S&P 500) by the same company (Allianz). The obvious difference is that the RILA investment is committed for the product term (six years) in the annuity, while the monies in the ETF are liquid.
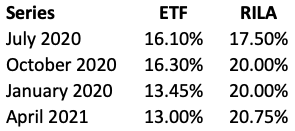
If an investor is comfortable with some illiquidity, there is a notable upside (i.e., higher caps). For example, here is a comparison of actual historical caps between the two previously discussed Allianz products based on the ETF series release dates.
Cap rates for ETFs and RILAs
For each “vintage,” the RILA cap rate is higher, especially for the last three releases. To generate the higher caps, I estimated that the options budget for the RILA was approximately 100 bps higher over the period.
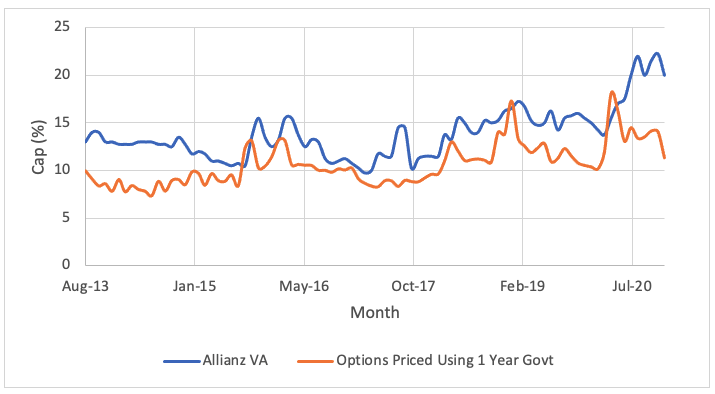
I can go even further back and compare the historical cap rates for the Allianz VA to what the expected cap would be using one-year government bonds to set the options budget for the 10% buffer product (i.e., proxy the cap for the ETF). This information is below.
Estimated and historical caps for a 10% buffer
The historical cap rates for the Allianz VA are consistently higher than what a DIY investor would receive, with an average implied increase in the cap rates estimated to be a result from an options budget increase of approximately 60 bps over the period.
Overall, the Allianz VA has a lower internal expense ratio than the ETF (25 bps versus 74 bps, respectively) and has had higher caps that suggest an additional options budget (between 60 bps and 100 bps). Assuming an investor is interested in the strategy and comfortable with the illiquidity associated with RILAs, there is a clear expected return differential (+~125 bps options budget) when contrasting a RILA to an ETF with a similar investment strategy.
Conclusions
There are a variety of approaches an investor can use to implement an options strategy. I touched on the pros and cons of doing it yourself, ETFs, and RILAs.
For an investor who wants liquidity, a DIY or ETF approach is the way to go. For an investor who doesn’t mind some illiquidity, there are clear benefits associated with RILAs, which can potentially improve the expected returns.
In the next piece in the series (part 3), I’ll build off this analysis and provide a detailed discussion of buffer-and-floor products and, in part 4, I’ll provide more explicit guidance about how these products can work in a portfolio framework.
David Blanchett is head of retirement research for Morningstar Investment Management LLC. Views expressed are his own and do not necessarily reflect the views of Morningstar Investment Management LLC. This blog is provided for informational purposes only and should not be construed by any person as a solicitation to effect, or attempt to effect transactions in securities or the rendering of investment advice.
Note: References to specific securities or other investment options should not be considered an endorsement of or a recommendation or offer to purchase or sell that specific investment.
1 For example, when comparing the Allianz Buffer ETFs to the Allianz Index Advantage Variable Annuity
2 https://www.treasury.gov/resource-center/data-chart-center/interest-rates/pages/textview.aspx?data=yield
3 For the record, the outcome is no more “defined” in a buffer or floor strategy than a traditional long-only investment. Therefore, I think this term is misleading. MYGAs, and other investments with guaranteed have a “defined outcome”, buffers/floors do not.
Read more articles by David Blanchett
 This is the second piece in a series focused on strategies that use financial options to “reshape” the expected return distribution of an index such as the S&P 500. In part 1, I provided an overview of registered index-linked annuities (RILAs), which can be thought of as a riskier version of fixed index annuities (FIAs). With a RILA, there is the possibility of a loss, but the potential upside improves.