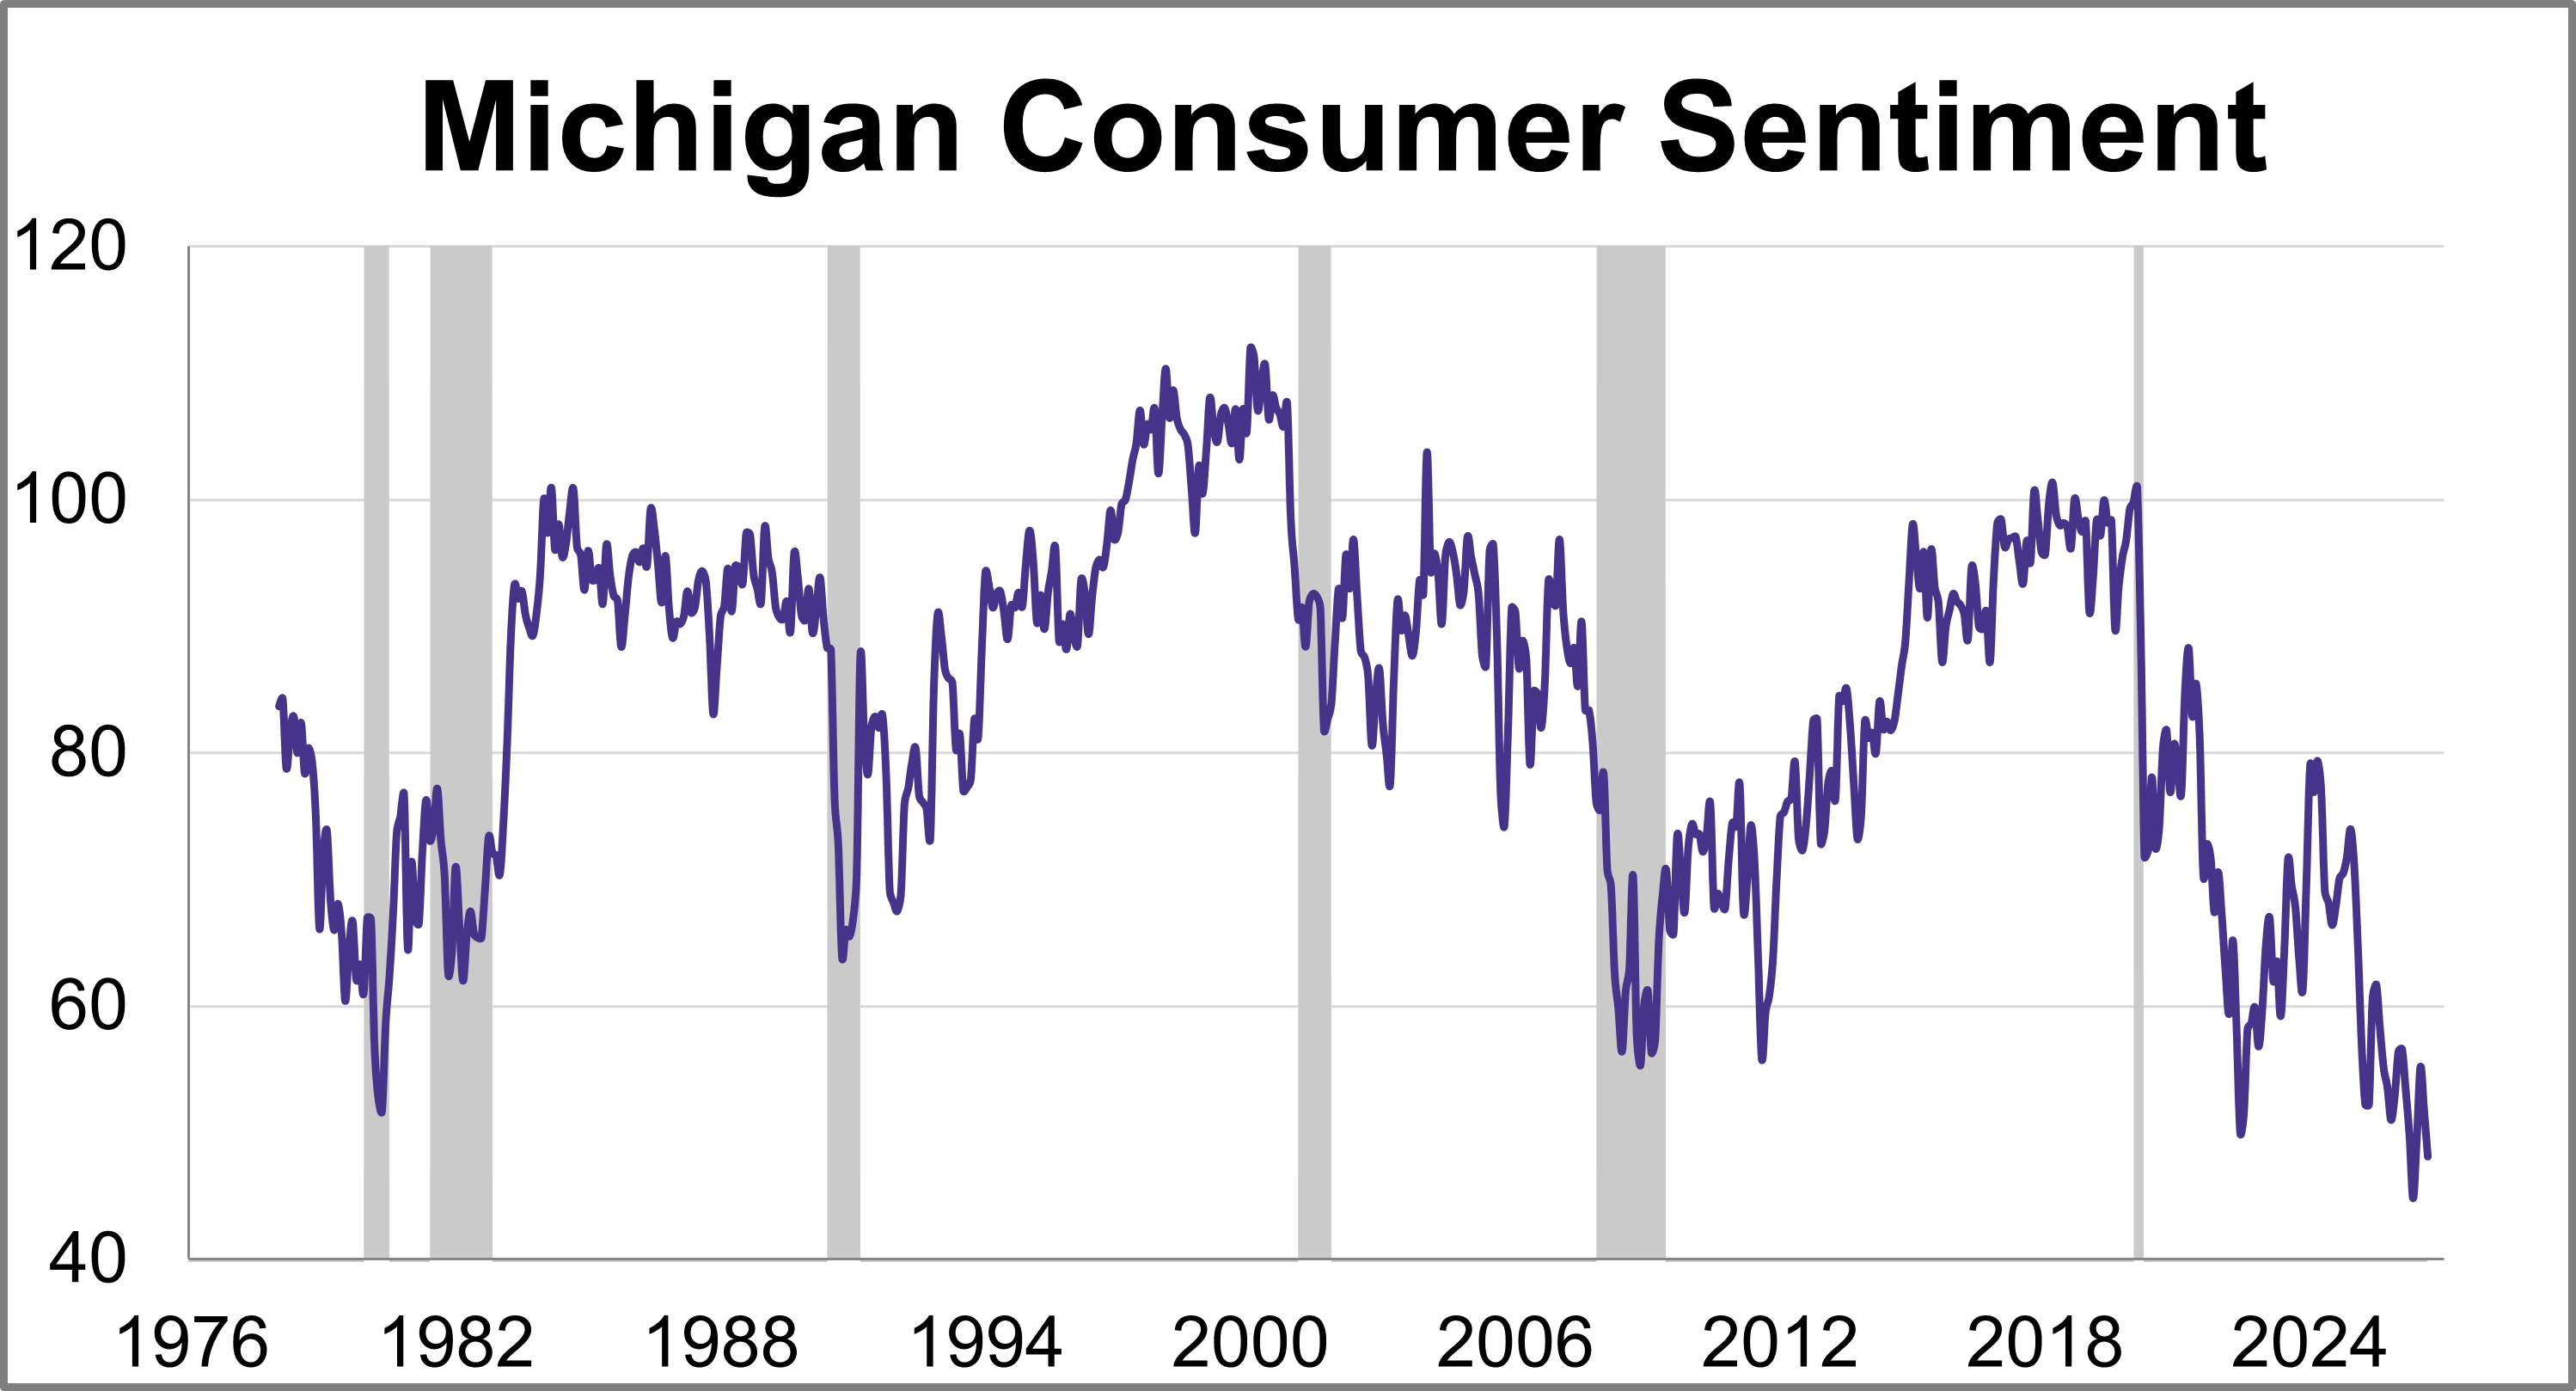
Consumer sentiment falls in September for two consecutive months. The final September reading for the University of Michigan Consumer Sentiment Index came in at 48.1. This marks a 7.0% (3.6 points) decrease from August.
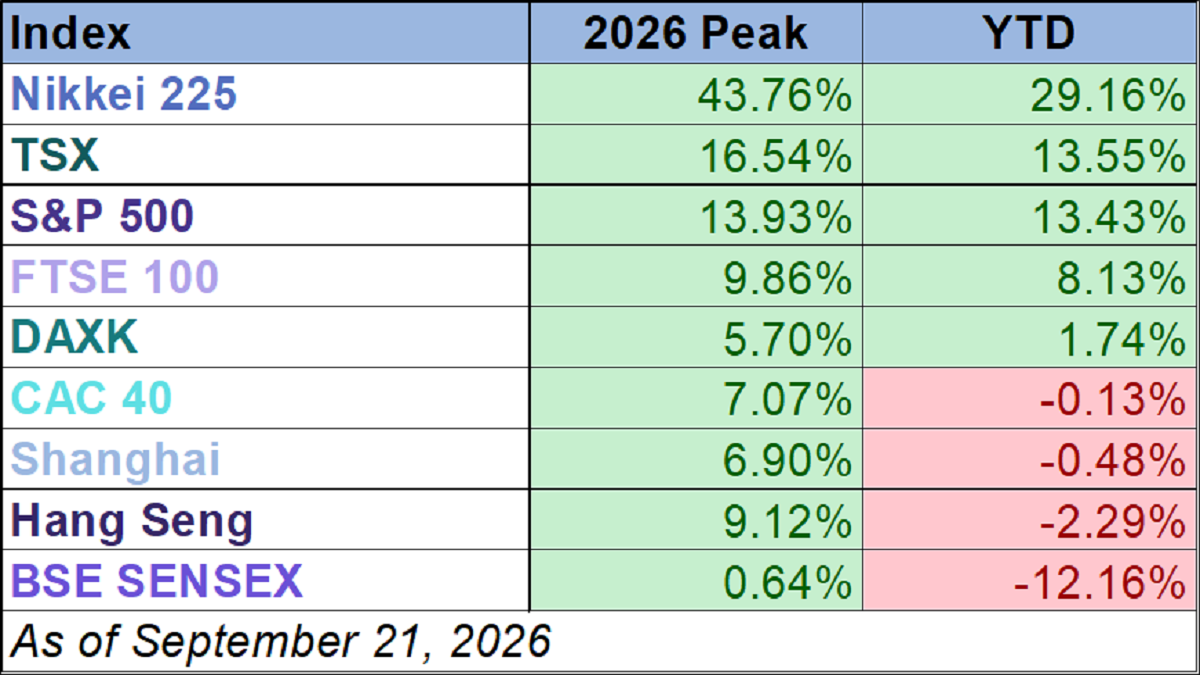
Six of the nine indexes on our world markets watch list posted year-to-date gains through September 21, 2026.
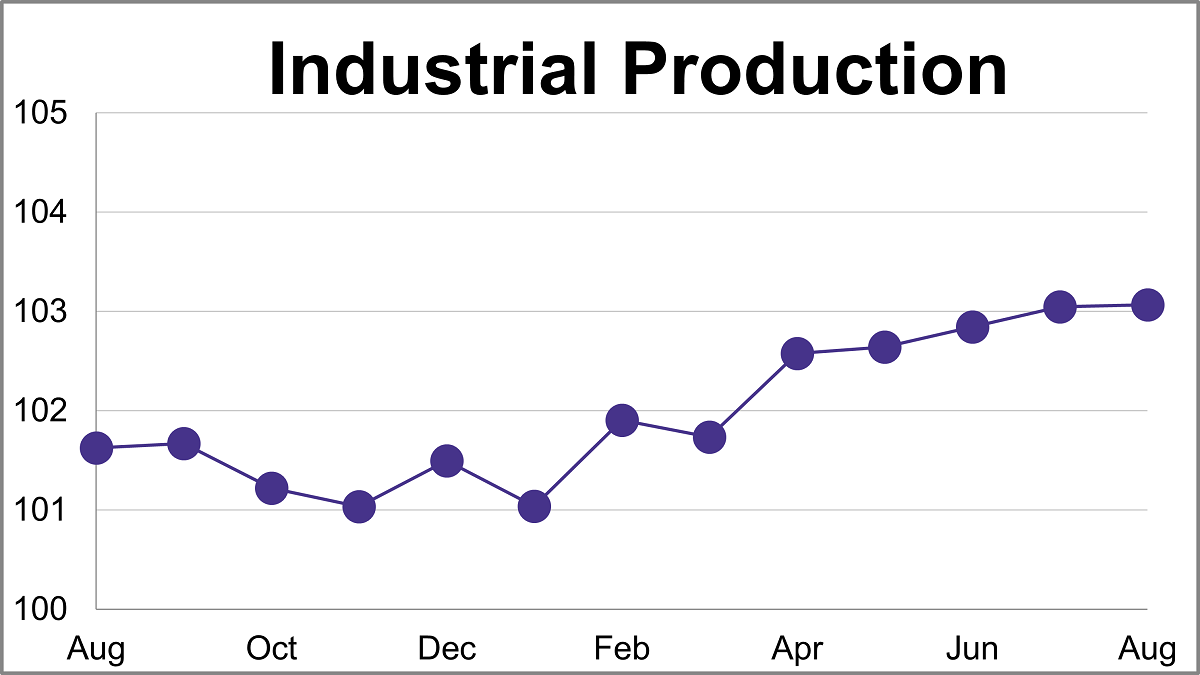
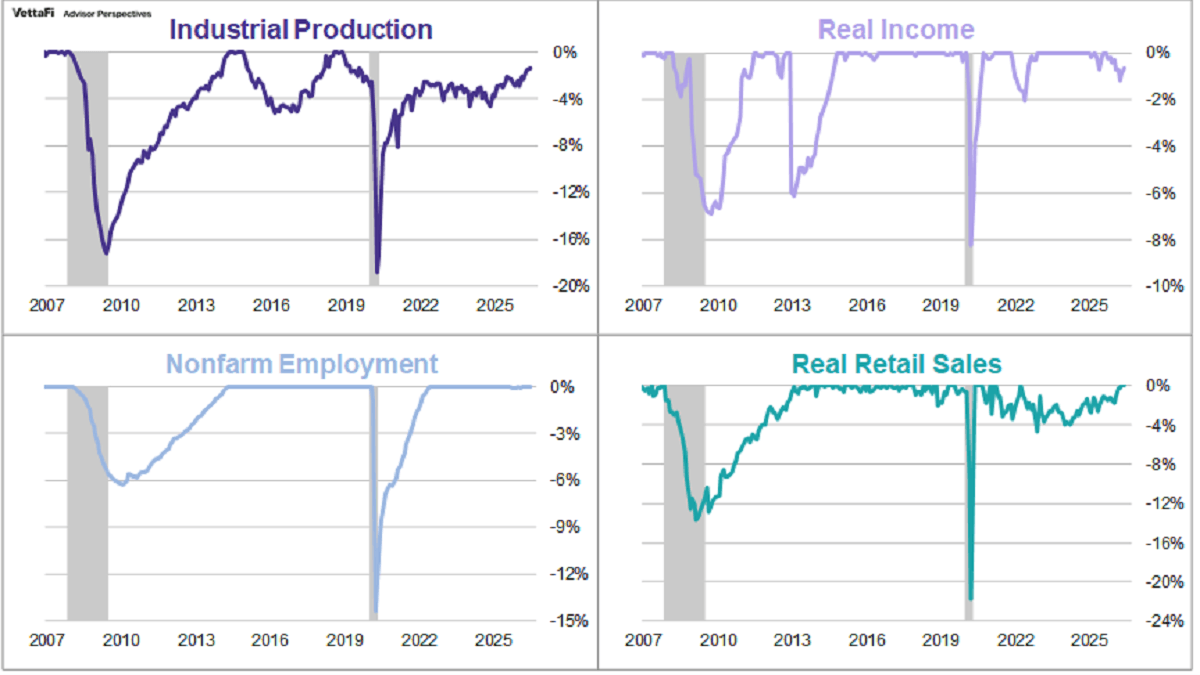
Industrial production grew 0.02% in August after July's 0.2% growth. This was lower than the expected 0.3% growth and marks a 1.4% increase compared to one year ago.
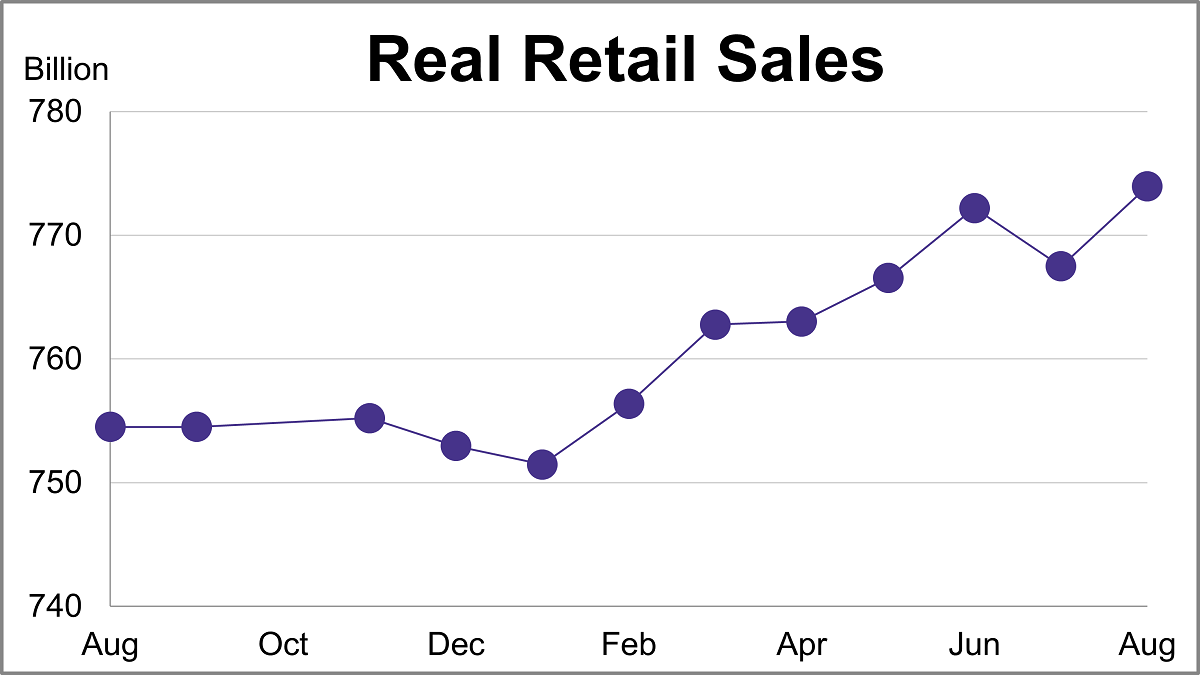
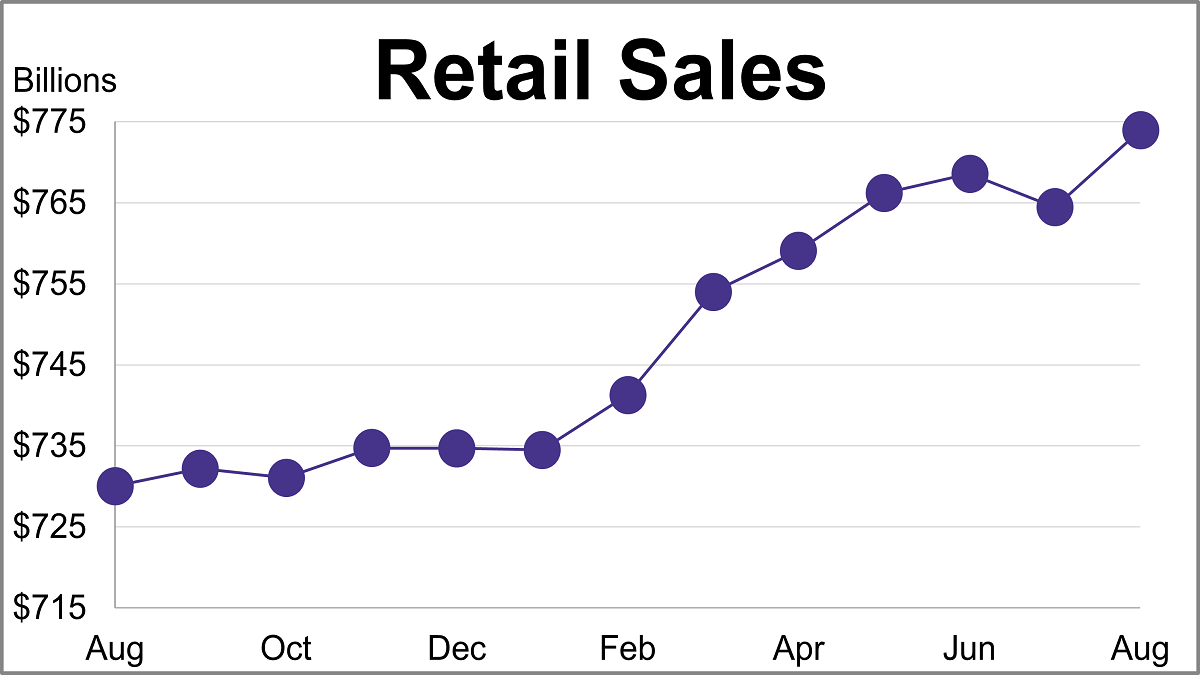
Nominal retail sales were up 1.2% month-over-month and up 6.0% year-over-year in August. After adjusting for inflation, real retail sales were up 0.8% month-over-month and up 2.6% year-over-year.
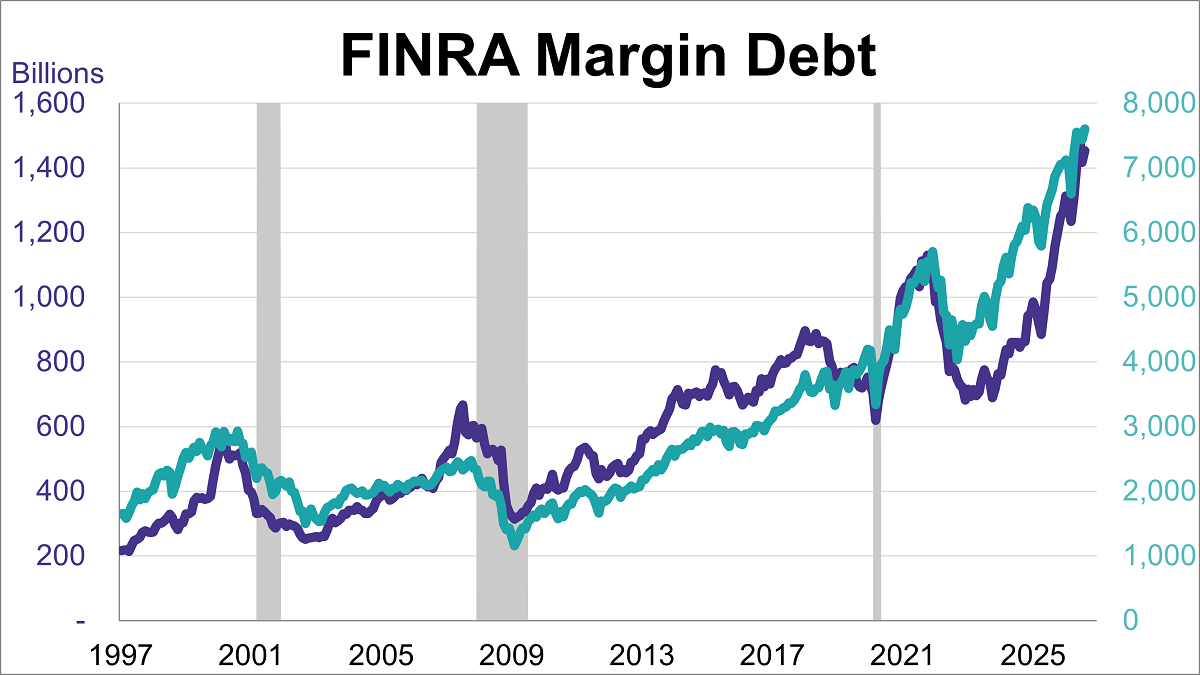
Margin debt increased in August to $1.45 trillion after decreasing last month. This marked a 2.6% increase from July and a 37.2% rise compared to the previous year.
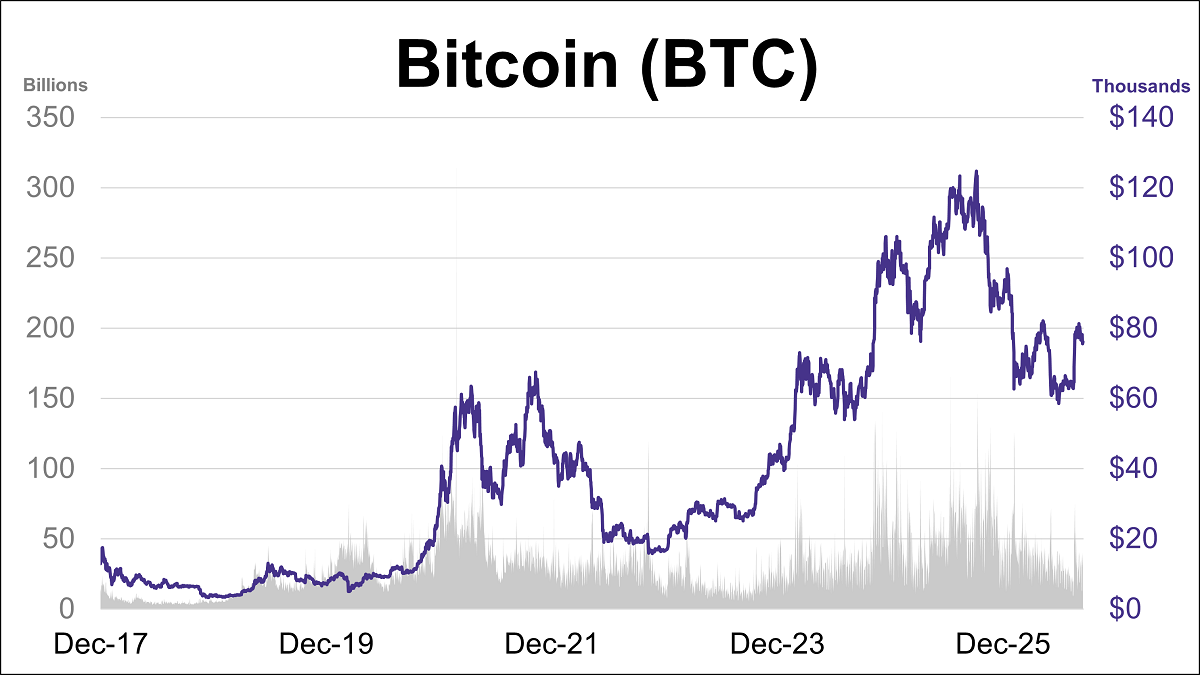
Bitcoin's closing price was down 2.7% this week. BTC is currently down approximately 13% year-to-date and sits about 39% below its October 2025 record high.
U.S. headline retail sales rebounded in August, up 1.2% to $773.9 in August, while core retail sales increased by 1.4%.
The U.S. Energy Information Administration (EIA) has released its latest Short-Term Energy Outlook (STEO), providing forecasts for energy markets. This article presents the annual production outlooks for crude oil, natural gas, and natural gas liquids (NGLs), comparing the September 2026 projections against the previous month's estimates.
The Producer Price Index (PPI) was up 0.4% in August, better than expectations.
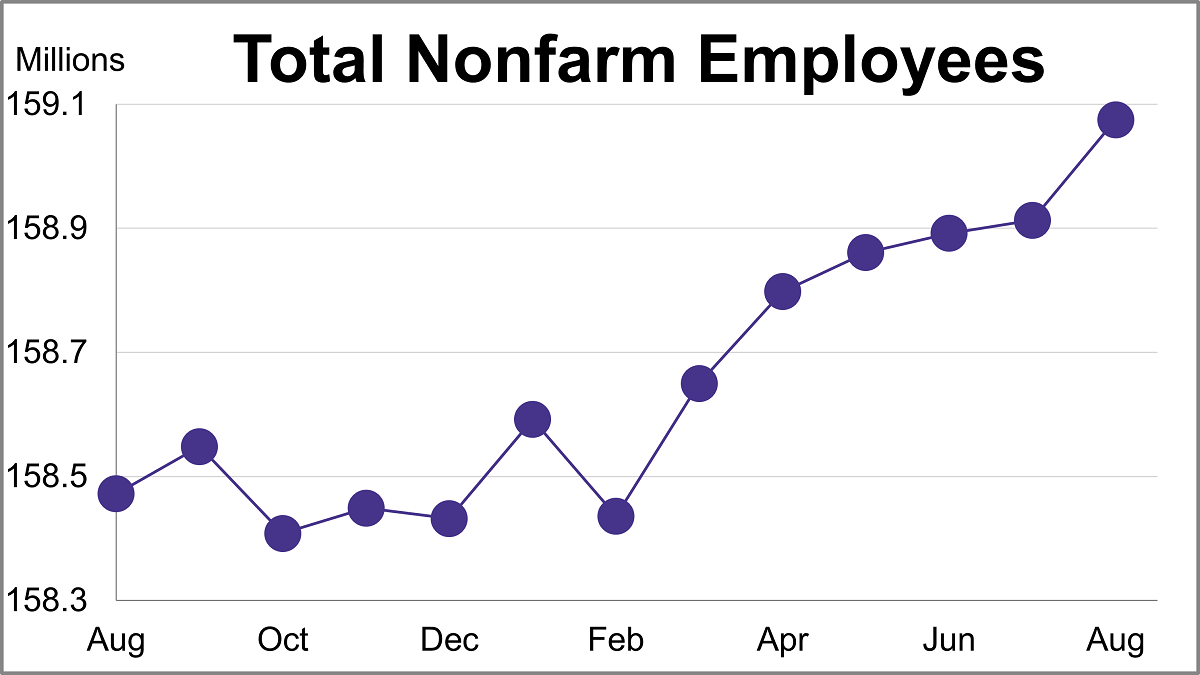
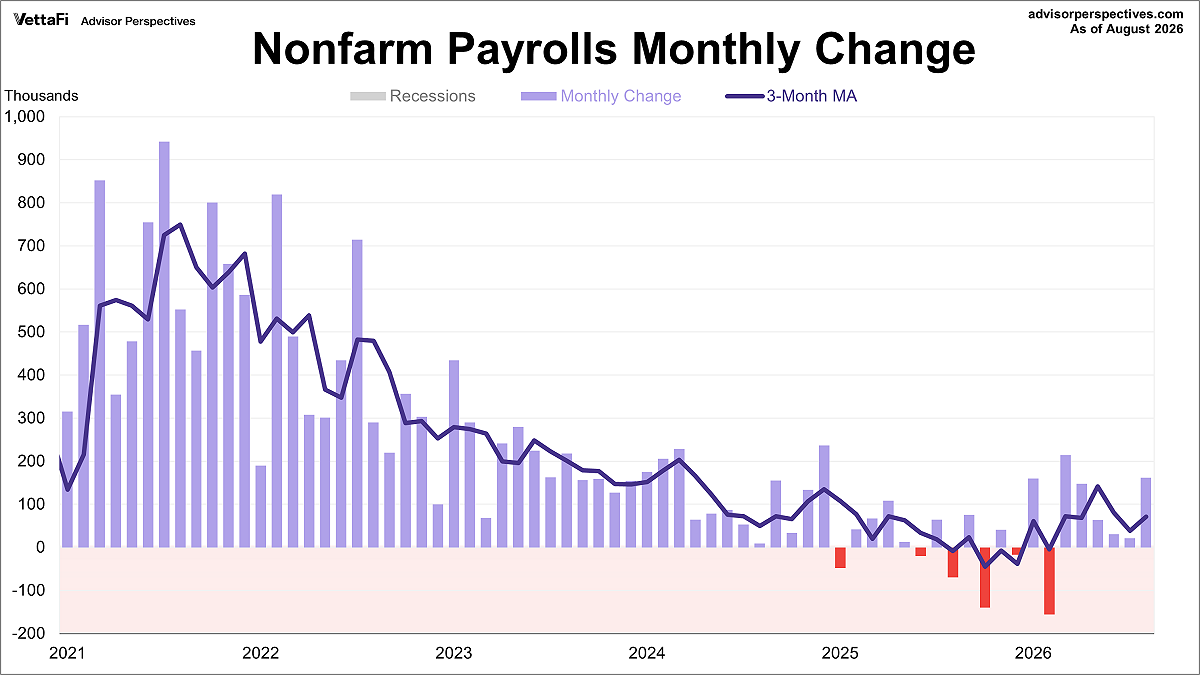
There is a general belief that there are four big indicators that the NBER Business Cycle Dating Committee weighs heavily in their cycle identification process. This commentary focuses on one of these indicators: nonfarm employment. In August, total nonfarm payrolls increased by 162,000 while the unemployment rate remained unchanged at 4.1%
The latest employment report showed that 162,000 jobs were added in August, compared to July's 21,000 gain. This figure was significantly higher than the projected addition of 55,000 jobs. Meanwhile, the unemployment rate was unchanged at 4.1%.
Valid until the market close on September 31, 2026
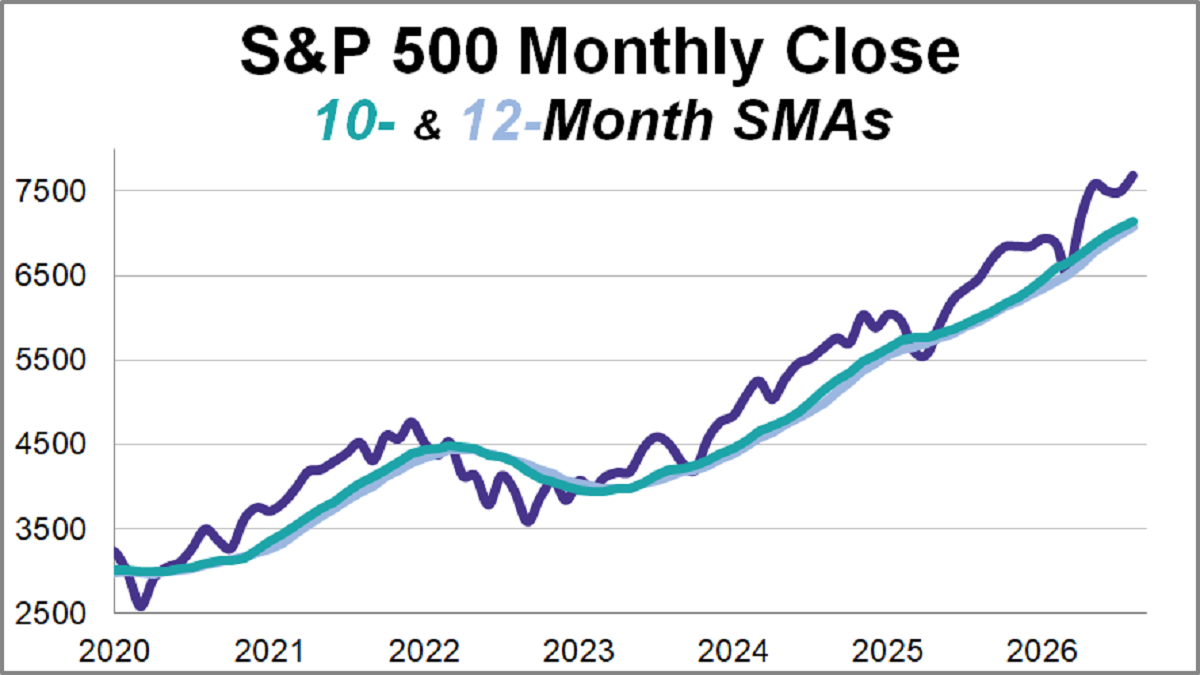
This article provides an update on the monthly moving averages we track for the S&P 500 and the Ivy Portfolio after the close of the last business day of the month.
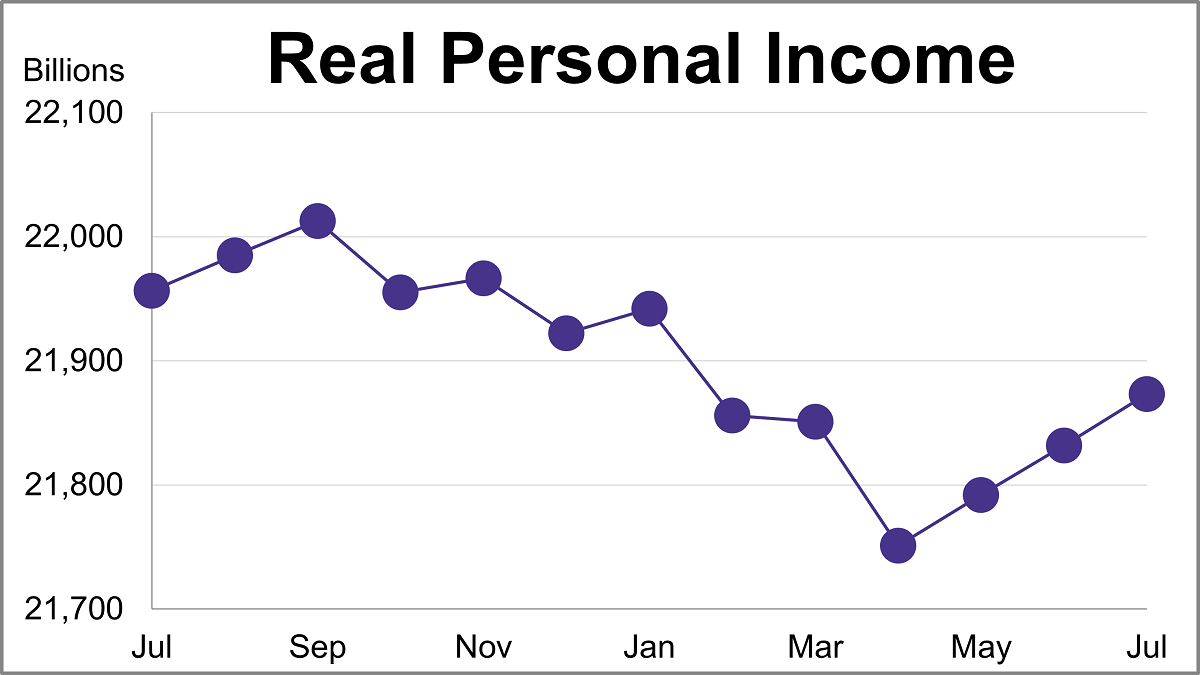
Personal income (excluding transfer receipts) was up 0.35% in July and was up 3.31% year-over-year. However, when adjusted for inflation using the BEA's PCE Price Index, real personal income (excluding transfer receipts) was up 0.19% month-over-month and down -0.38% year-over-year.
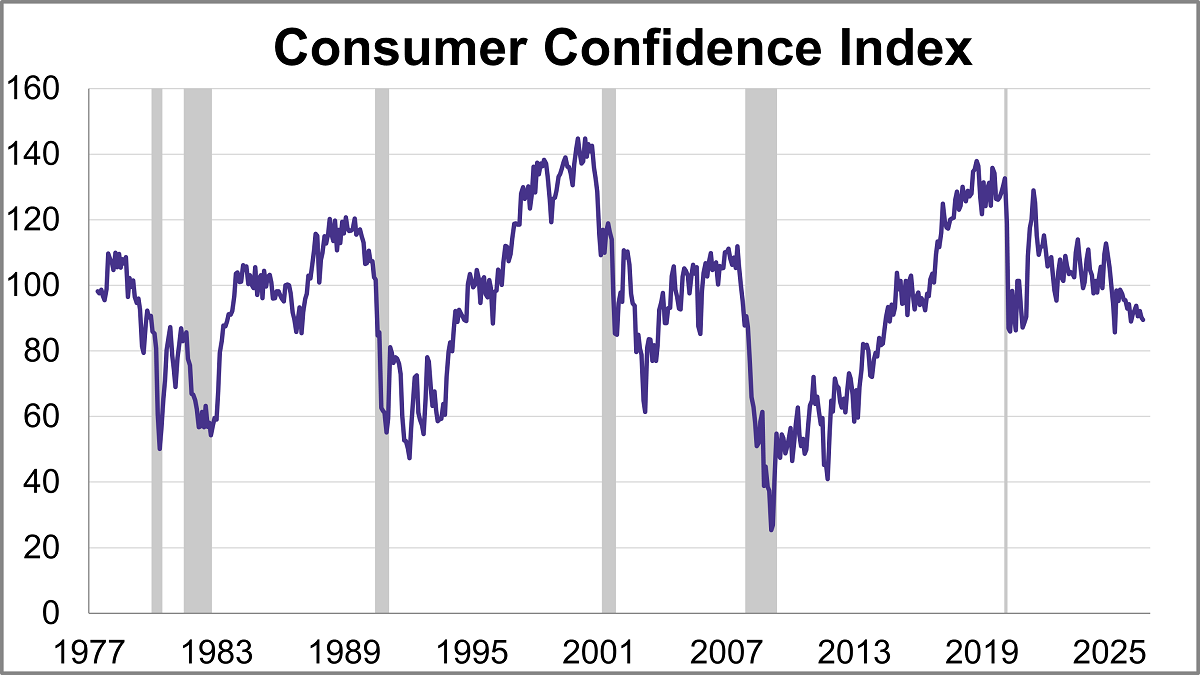
The Conference Board's Consumer Confidence Index® unexpectedly inched lower in August, falling 0.8 points to 89.4. The index was below the forecast of 90.3.
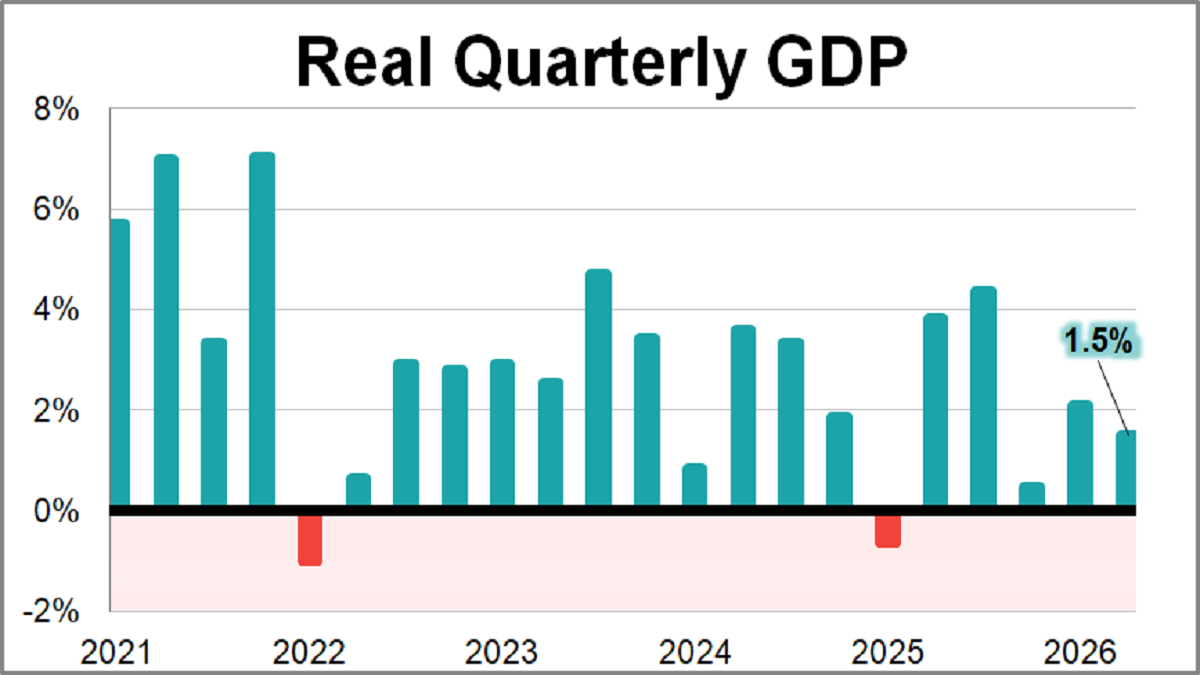
U.S. economic growth rebounded at the beginning of 2026, according to the BEA’s latest estimate. Real GDP rose at a 1.5% annual rate in Q2, falling below the 2.1% forecast, but marking an acceleration from the 0.5% final estimate seen in Q4 of last year.
Official recession calls are the responsibility of the NBER Business Cycle Dating Committee, which is understandably vague about the specific indicators on which they base their decisions. There is, however, a general belief that there are four big indicators that the committee weighs heavily in their cycle identification process.
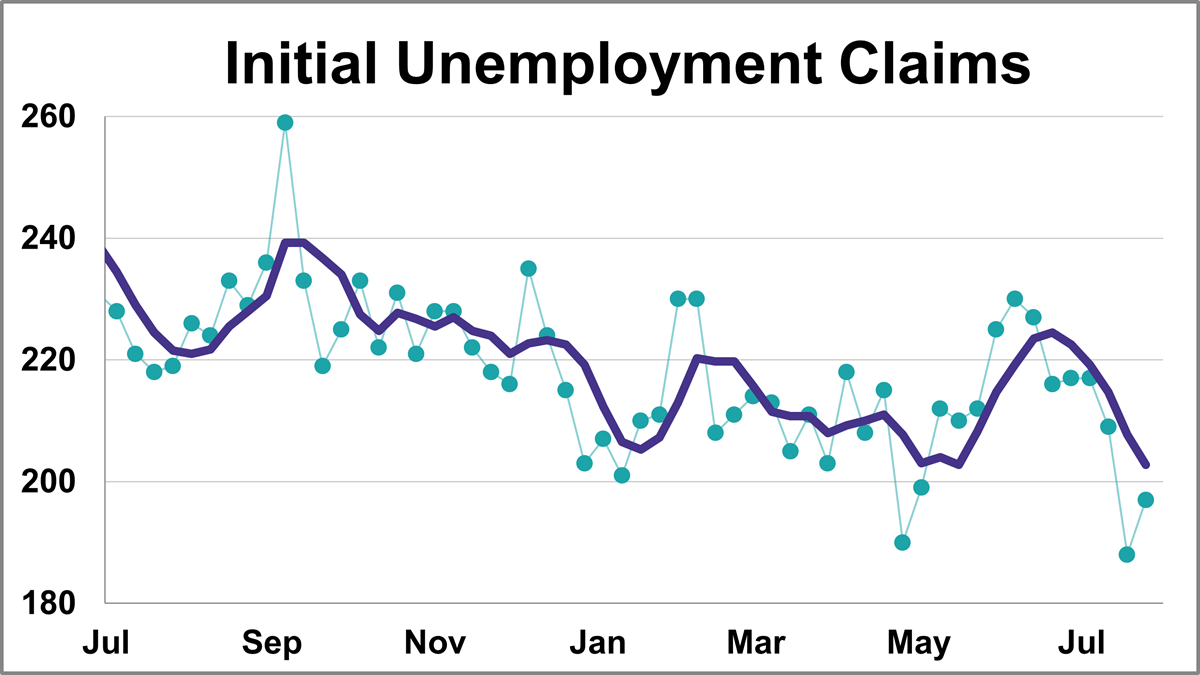
In the week ending July 25th, initial jobless claims were at a seasonally adjusted level of 197,000. This represents an increase of 9,000 from the previous week's figure and was lower than the forecast of 201,000.
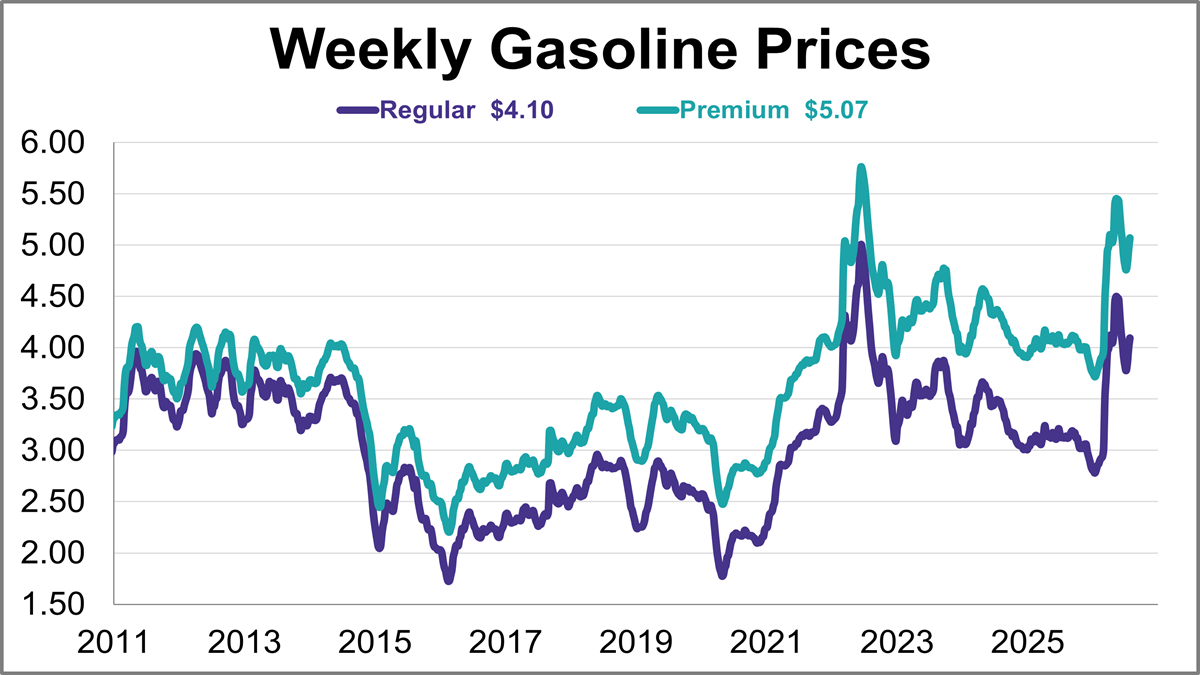
Gasoline prices jumped for a third straight week, reaching their highest level in almost two months.
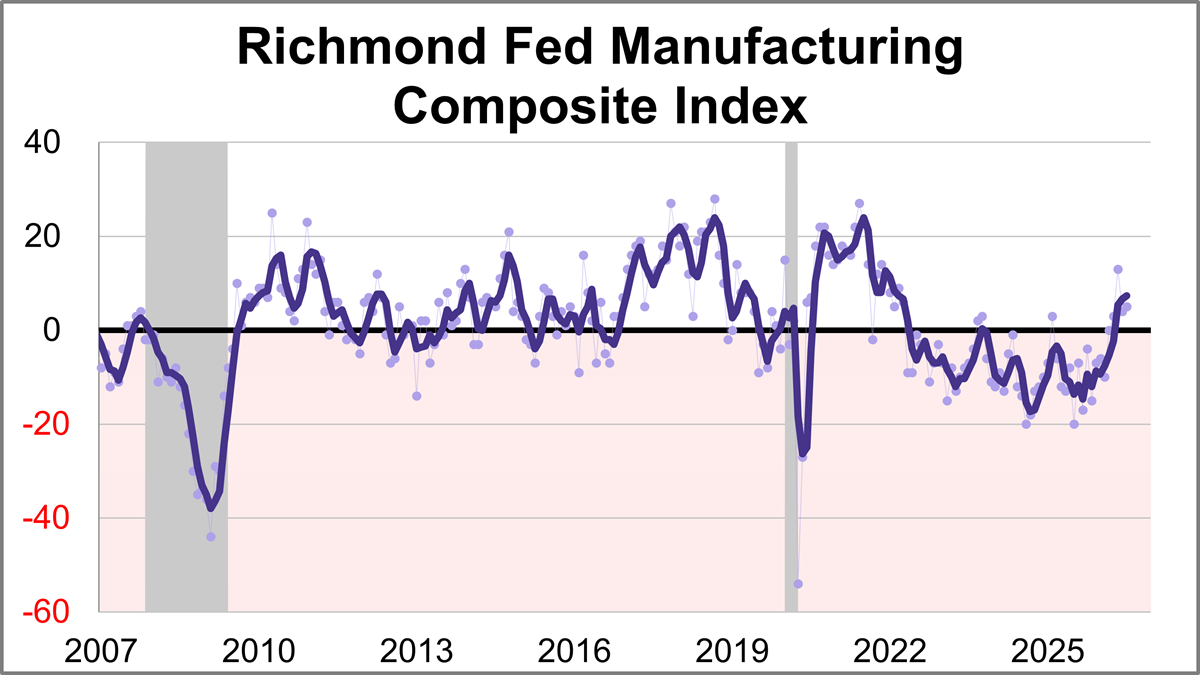
Fifth district manufacturing activity was mostly flat in July, according to the most recent survey from the Federal Reserve Bank of Richmond. The composite manufacturing index inched up one point to 5, marking the fourth consecutive positive reading.
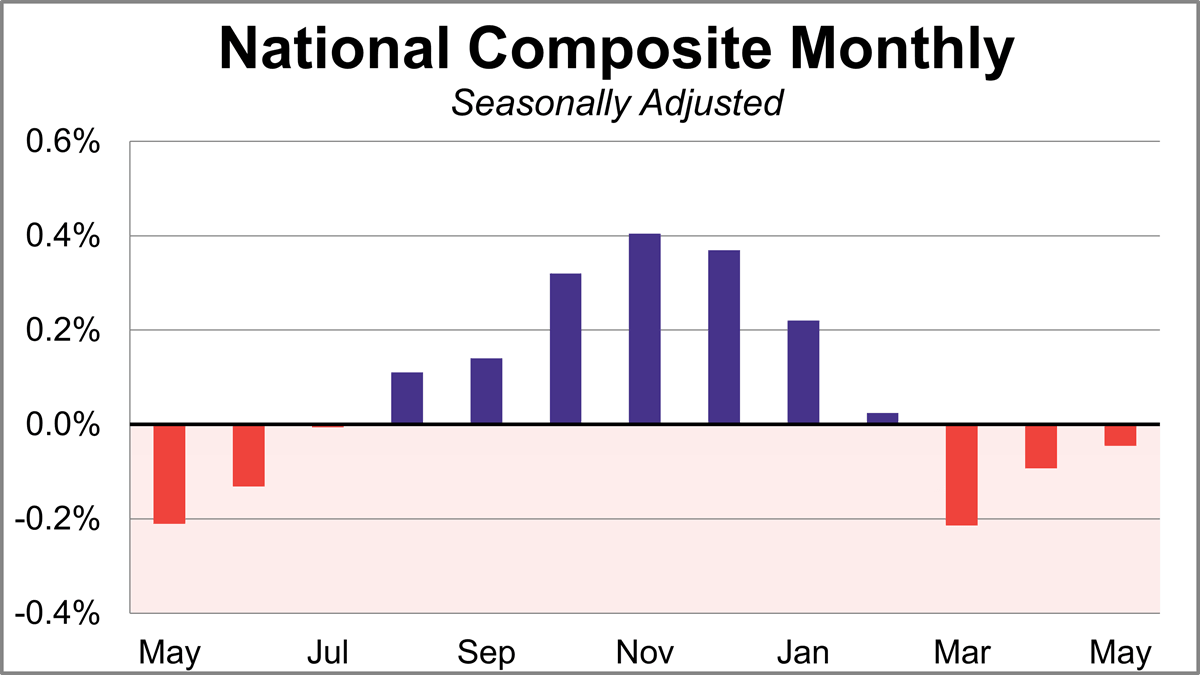
Home prices fell for a third straight month in May according to the S&P Cotality Case-Shiller index, as the housing slowdown continues. On a seasonally adjusted basis, the national index was essentially flat month-over-month and was up 1.1% year-over-year.
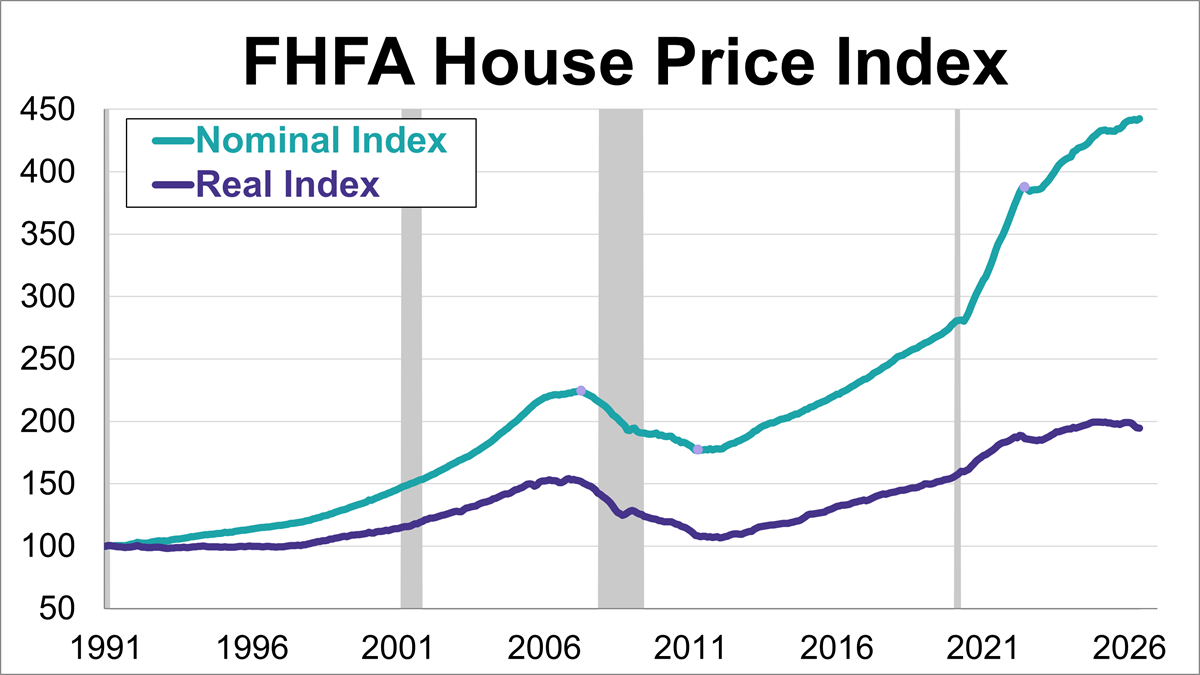
The Federal Housing Finance Agency (FHFA) House Price Index (HPI) rose more than expected in May, reaching a new record high.
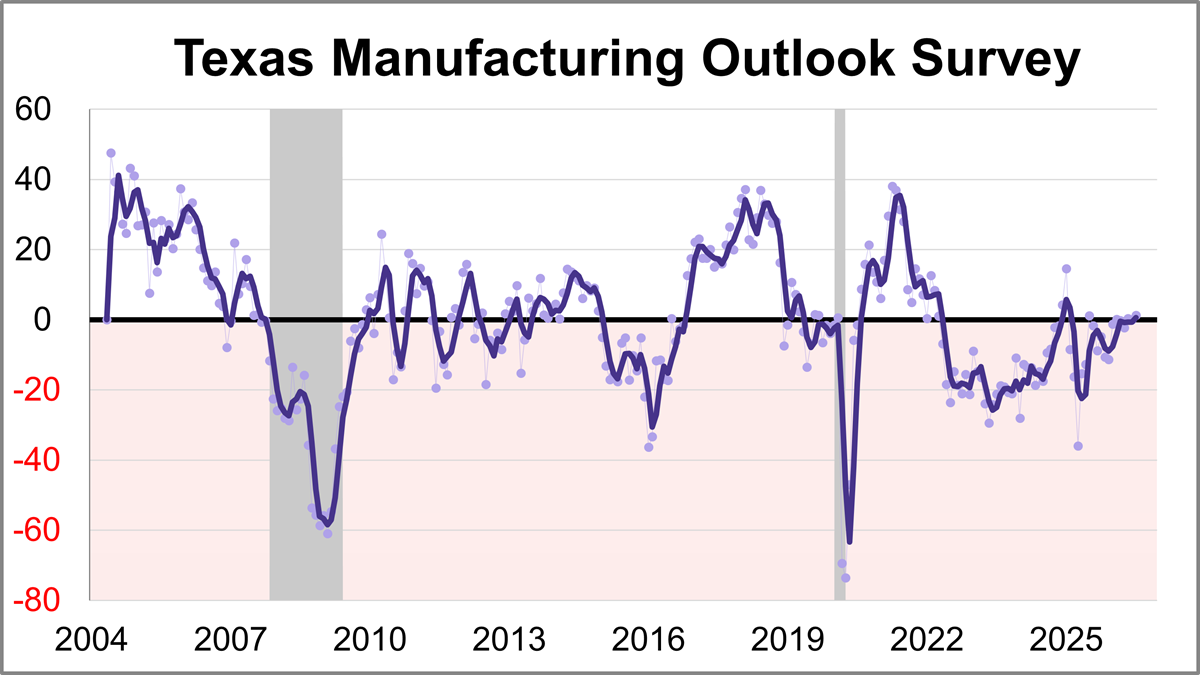
The Dallas Fed released its Texas Manufacturing Outlook Survey (TMOS) for July. The general business activity index rose 1.3 points to 1.3, indicating accelerated growth of manufacturing activity and improved business conditions perceptions.
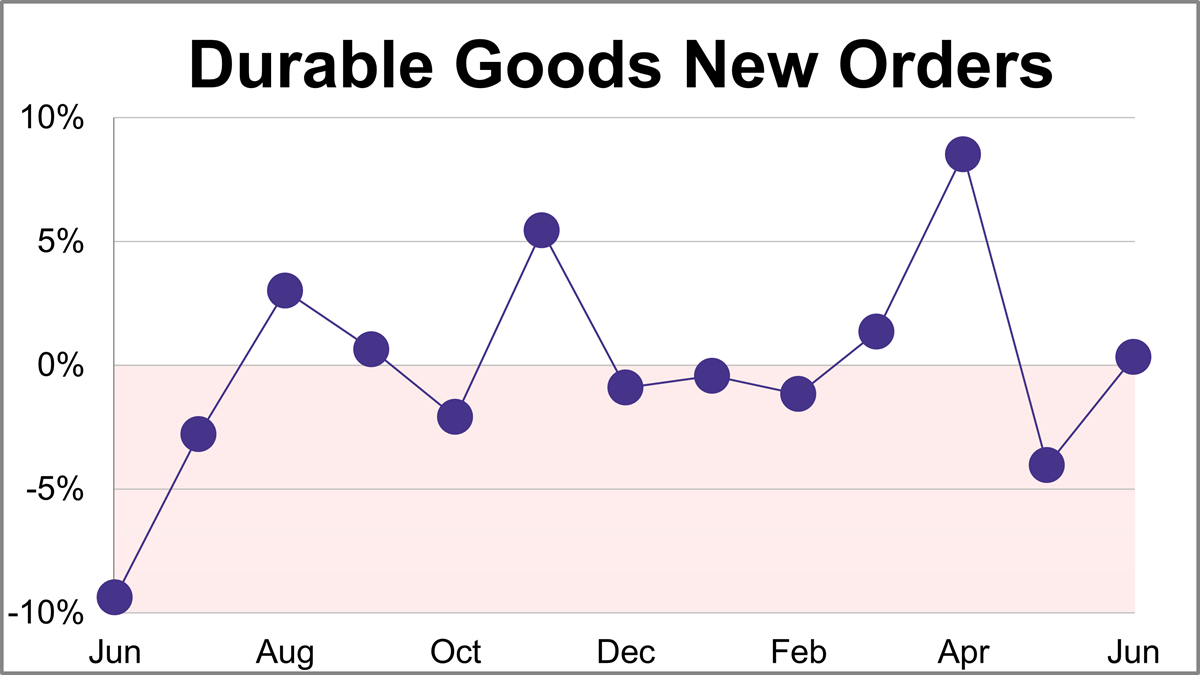
New orders for manufactured durable goods rose 0.3% in June to $334.77B, less than the projected 1.6% monthly growth.
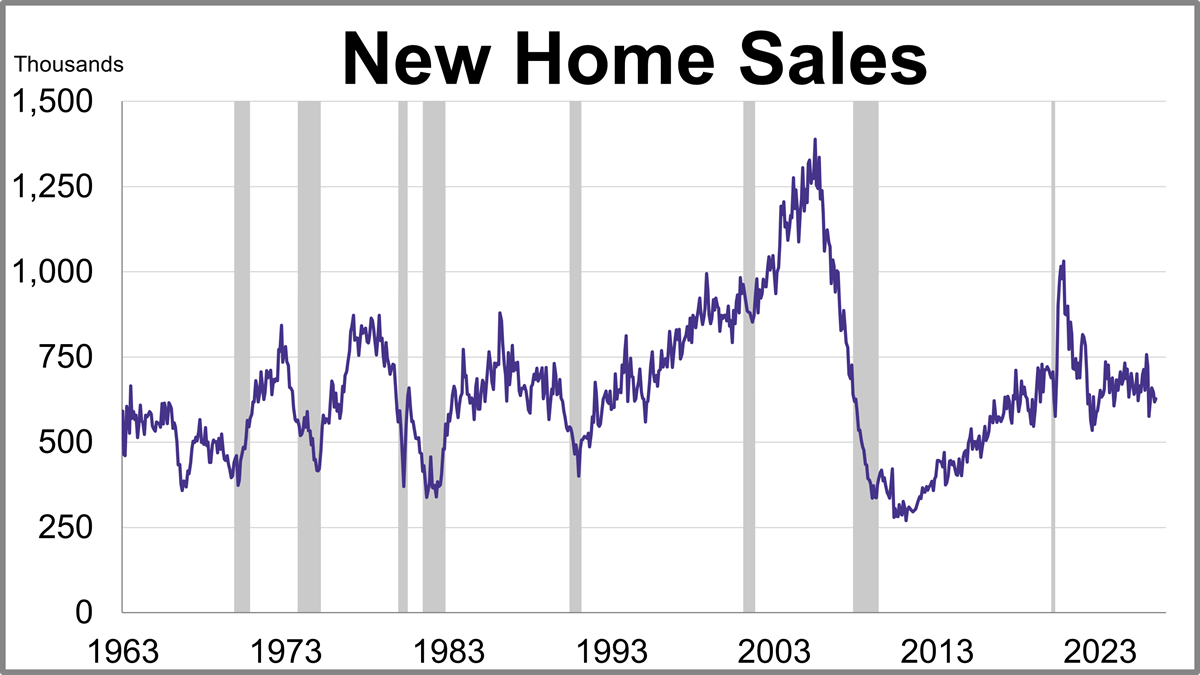
New home sales unexpectedly rose in June while the median price fell to its lowest level in almost a year.
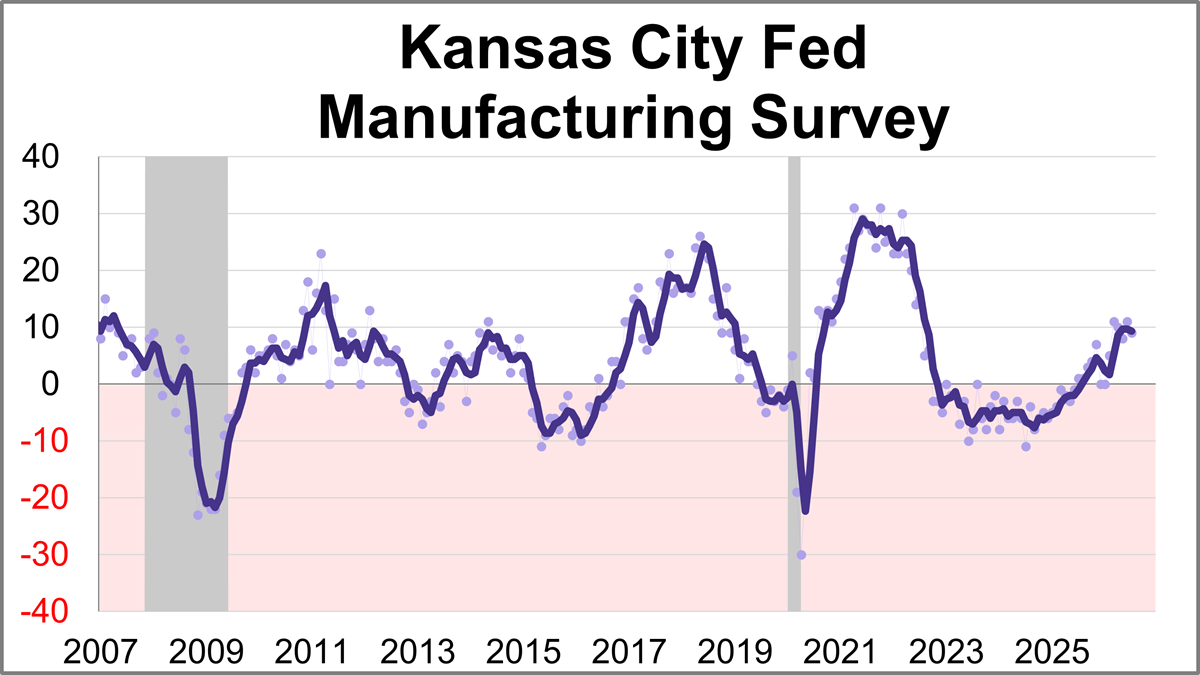
The Kansas City Fed Manufacturing Survey revealed regional activity remained steady in June. The composite index came in at 9 this month, down slightly from 11 in June but still indicating continued expansion.
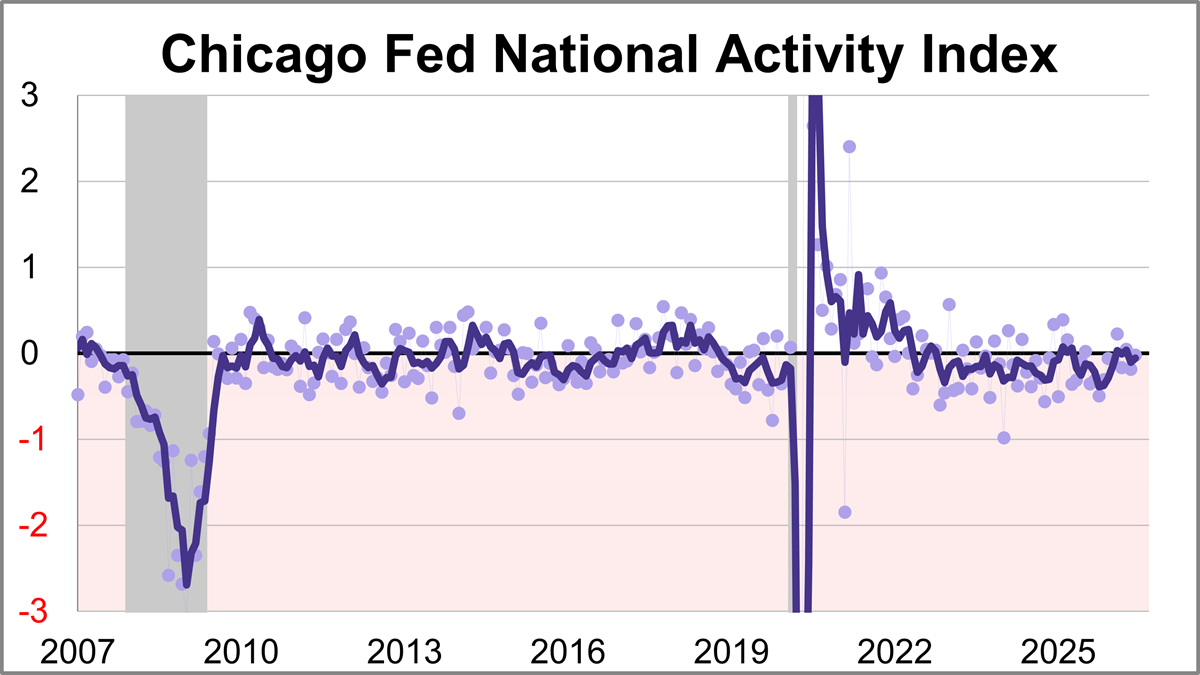
The Chicago Fed National Activity Index (CFNAI) rose to -0.02 in June from -0.19 in May. One of the four broad categories of indicators used to construct the index decreased from May, and two categories made negative contributions.
A handful of key economic data points dropped last week, painting a picture of an economy that is successfully downshifting from its recent inflation peaks even as consumers keep their footing.
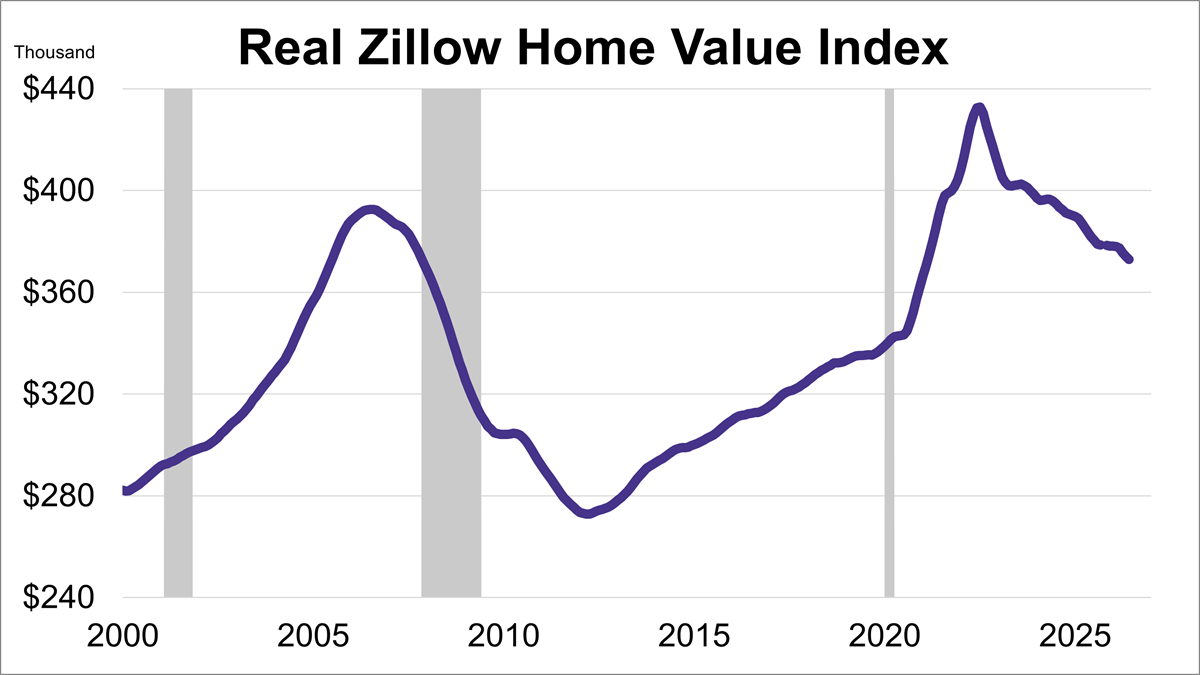
Home values fell for a second straight month in June, according to the Zillow Home Value Index. Additionally, after adjusting for inflation, real home values dropped even more sharply, hitting their lowest level in over five years.
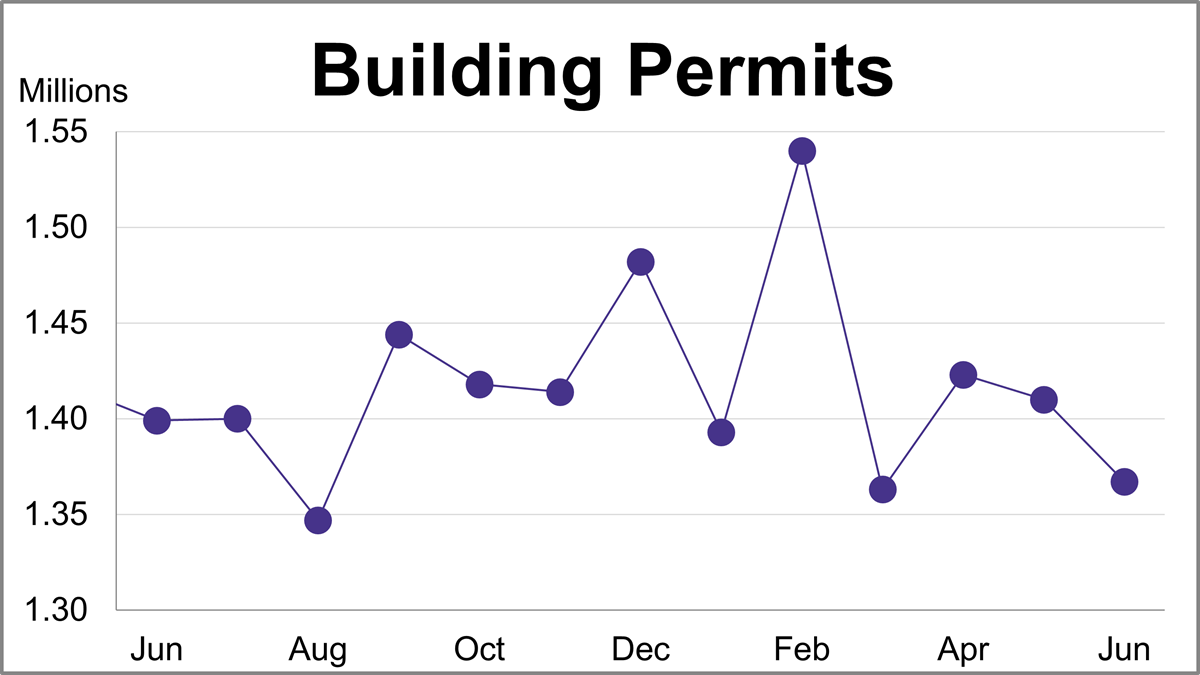
Building permits fell 3.0% in June to a seasonally adjusted annual rate of 1.367 million. The latest reading missed the forecast of 1.400 million.
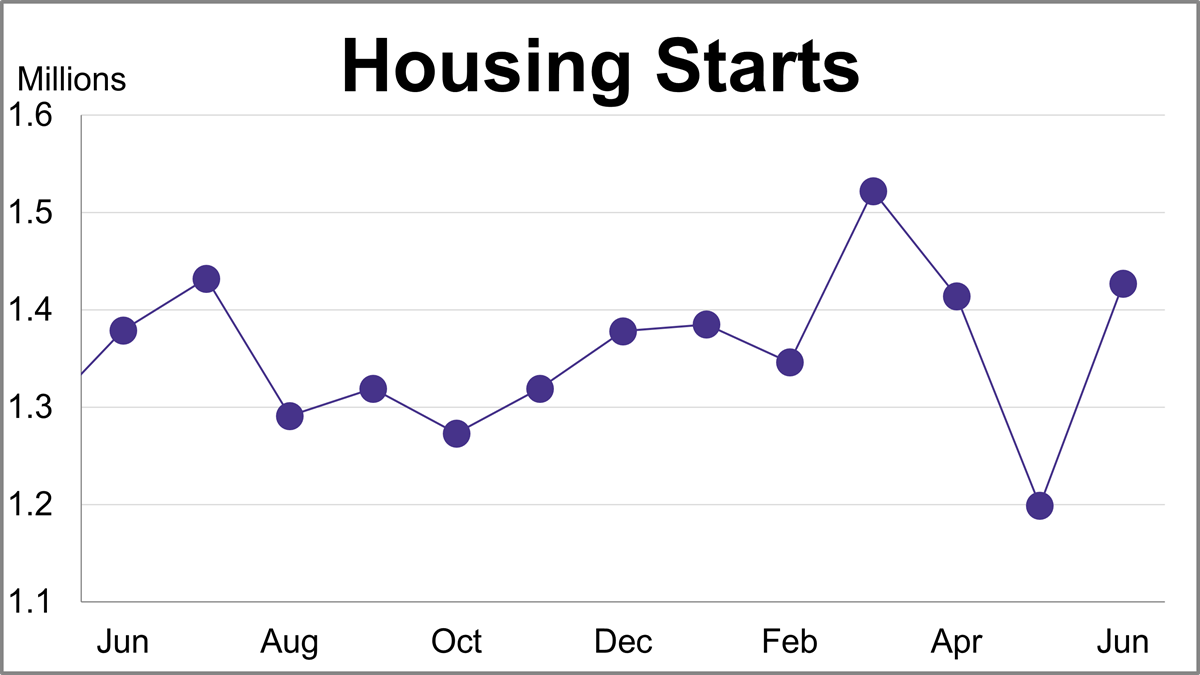
Housing starts jumped 19.0% in June to a seasonally adjusted annual rate of 1.427 million, beating forecasts driven by a massive surge in multi-family units.
Discover the top 10 most-read charts from the first half of 2026, covering historic market valuations, record margin debt, recession indicators, and global index performance.
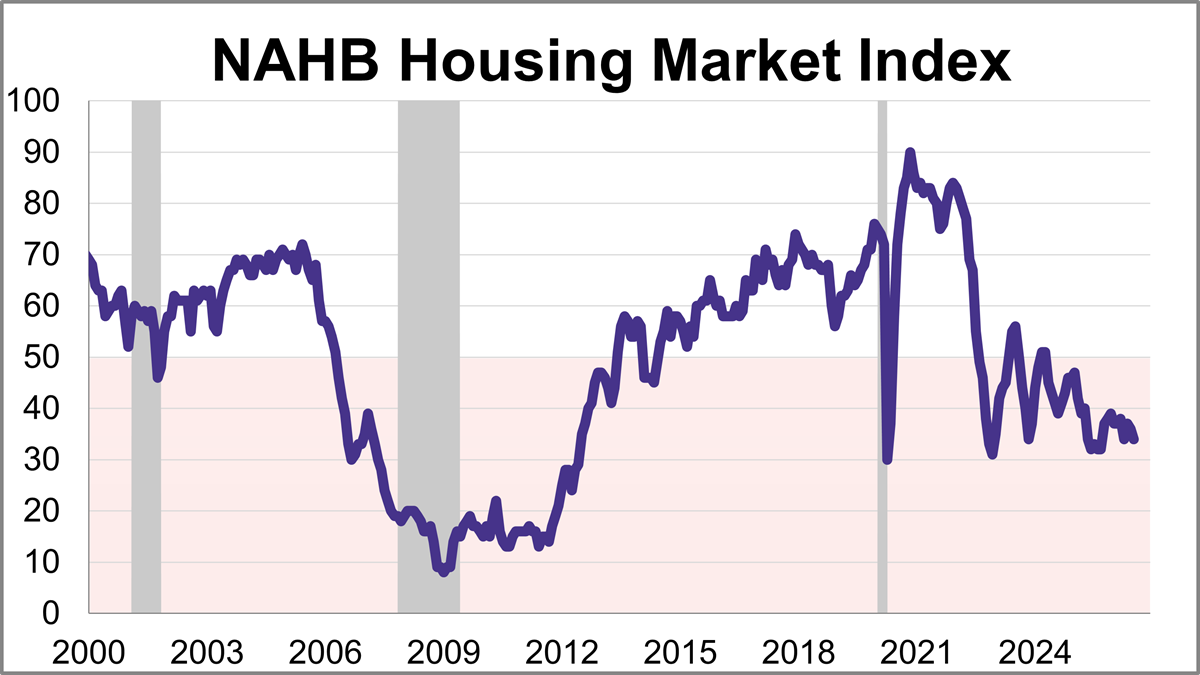
Builder confidence edged lower in July as ongoing affordability challenges continue to affect the housing market. The National Association of Home Builders (NAHB) Housing Market Index (HMI) fell 2 points from June to 34 this month, marking the 27th consecutive negative reading.
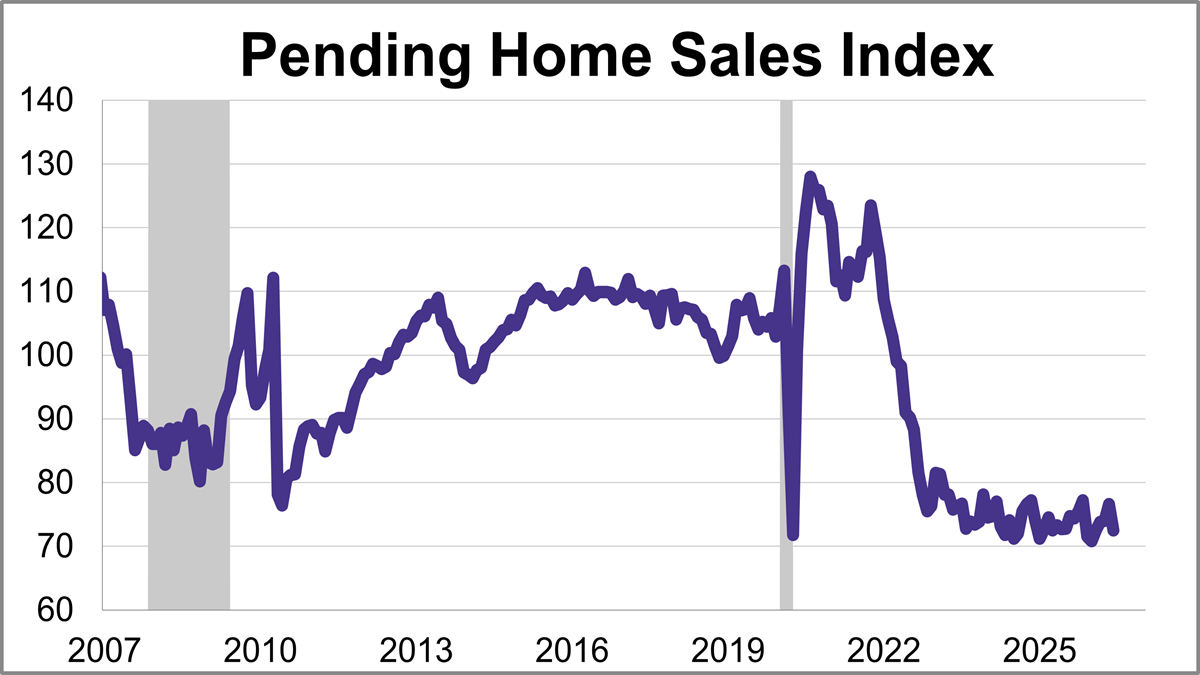
The National Association of Realtors® (NAR) pending home sales index sank 5.4% in June to 72.5, the lowest level since January.
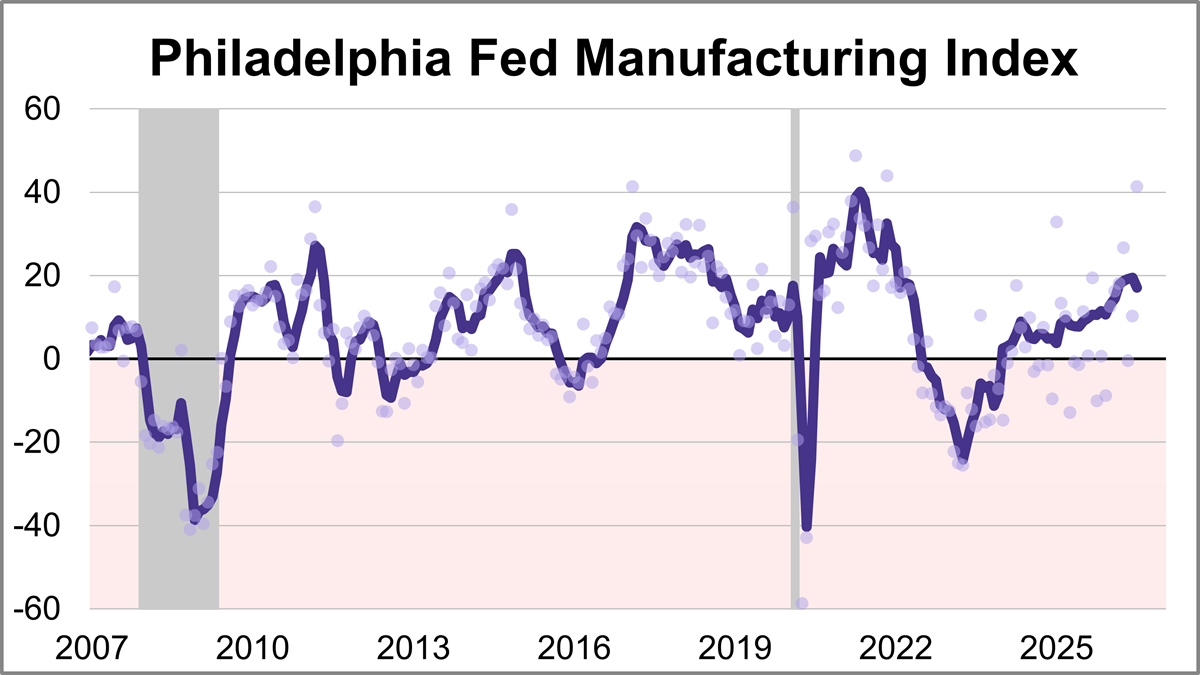
The Philadelphia Fed manufacturing index showed activity expanded significantly in July, with the index jumping 31.1 points to 41.4. This marks the highest level for the index since November 2021 and was more than triple the forecast of 12.7.
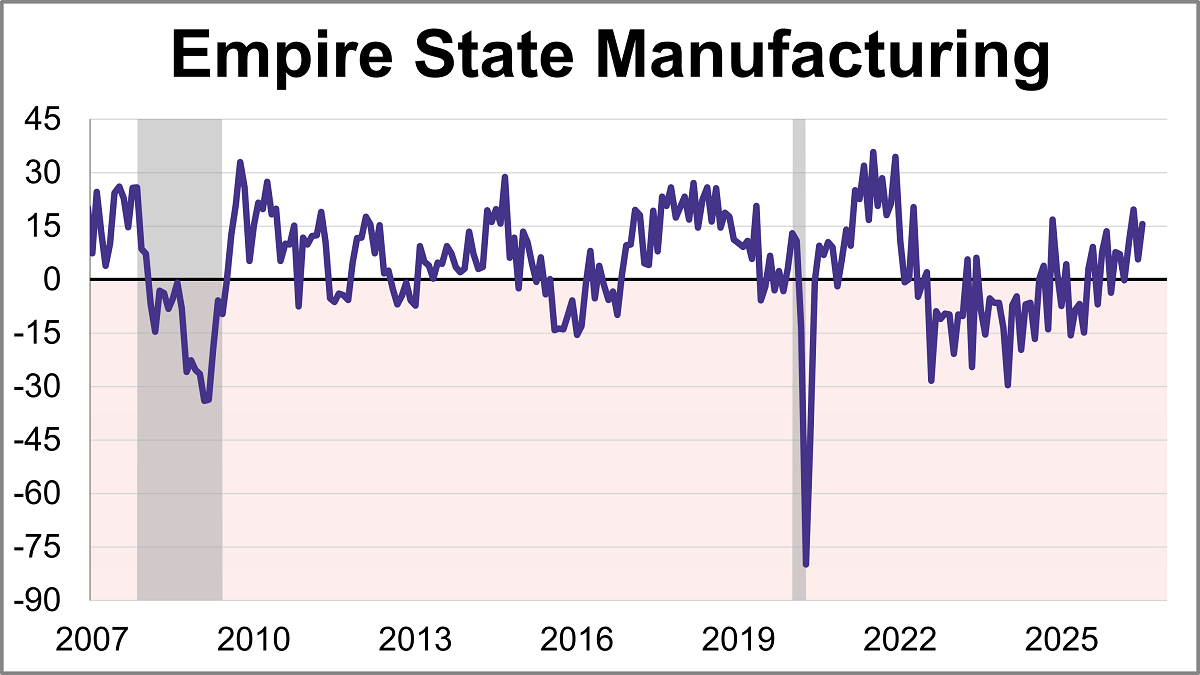
Manufacturing activity grew significantly in New York State, according to the Empire State Manufacturing July survey. The diffusion index for General Business Conditions remained in positive territory for a fourth straight month, jumping 9.9 points to 15.6 and coming in above the 9.3 forecast.
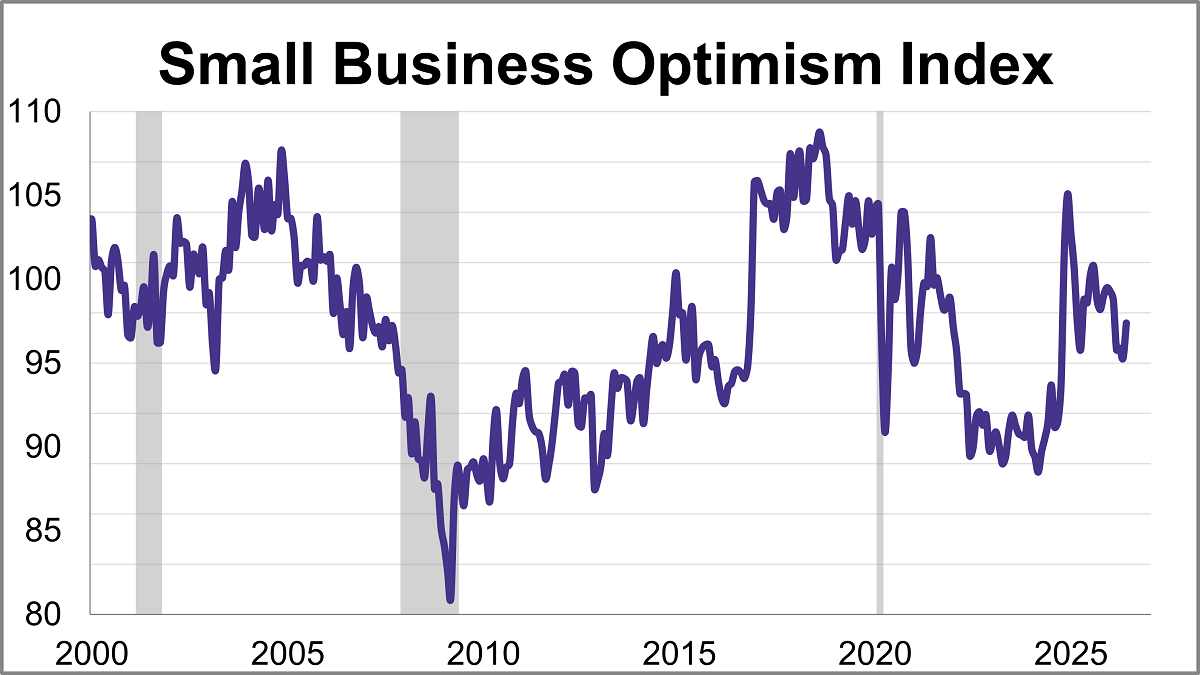
The NFIB Small Business Optimism Index rose 2.1 points to 97.4, reaching its highest level since February. However, the index remains below its historical average for a fourth straight month.
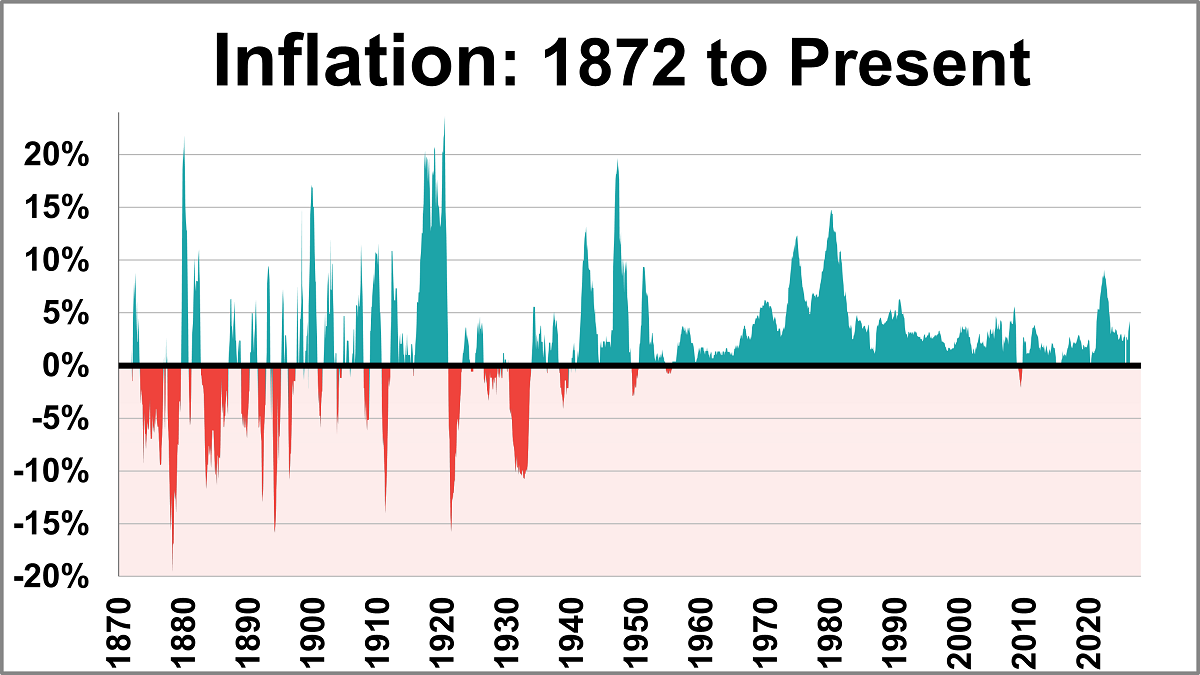
The June release of the Consumer Price Index for Urban Consumers (CPI-U) places the year-over-year inflation rate at 3.53%. This pushes inflation back below the post-WWII average of 3.72% for the first time since March. Meanwhile, this marks the fourth consecutive month that the current rate is above the 10-year moving average, which currently sits at 3.29%.
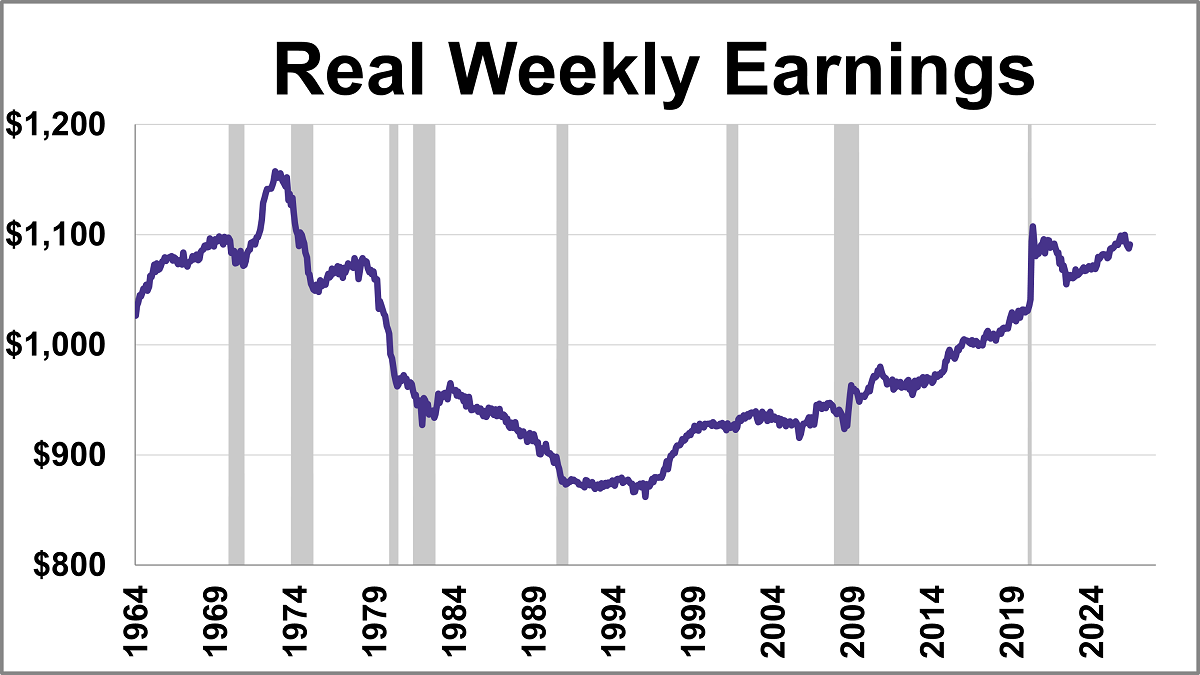
This series has been updated to include the June release of the consumer price index as the deflator and the monthly employment update. The latest hypothetical real (inflation-adjusted) annual earnings are at $54,560, down 5.7% from over 50 years ago.
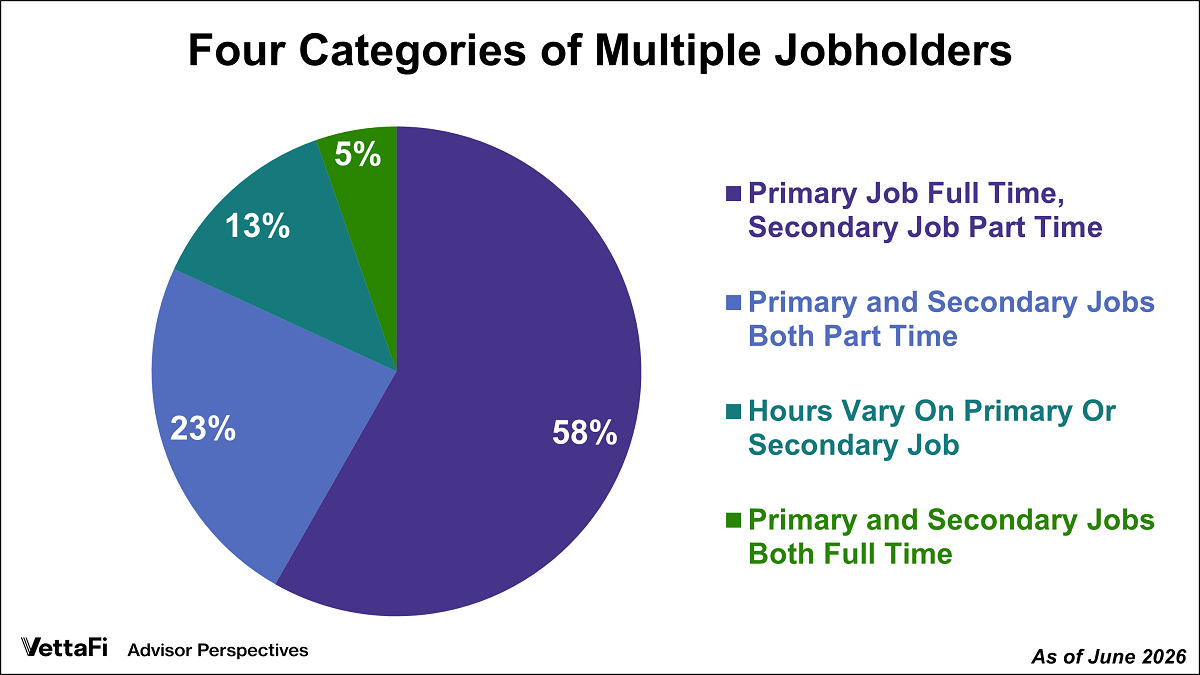
Multiple jobholders accounted for 5.2% of civilian employment in June.
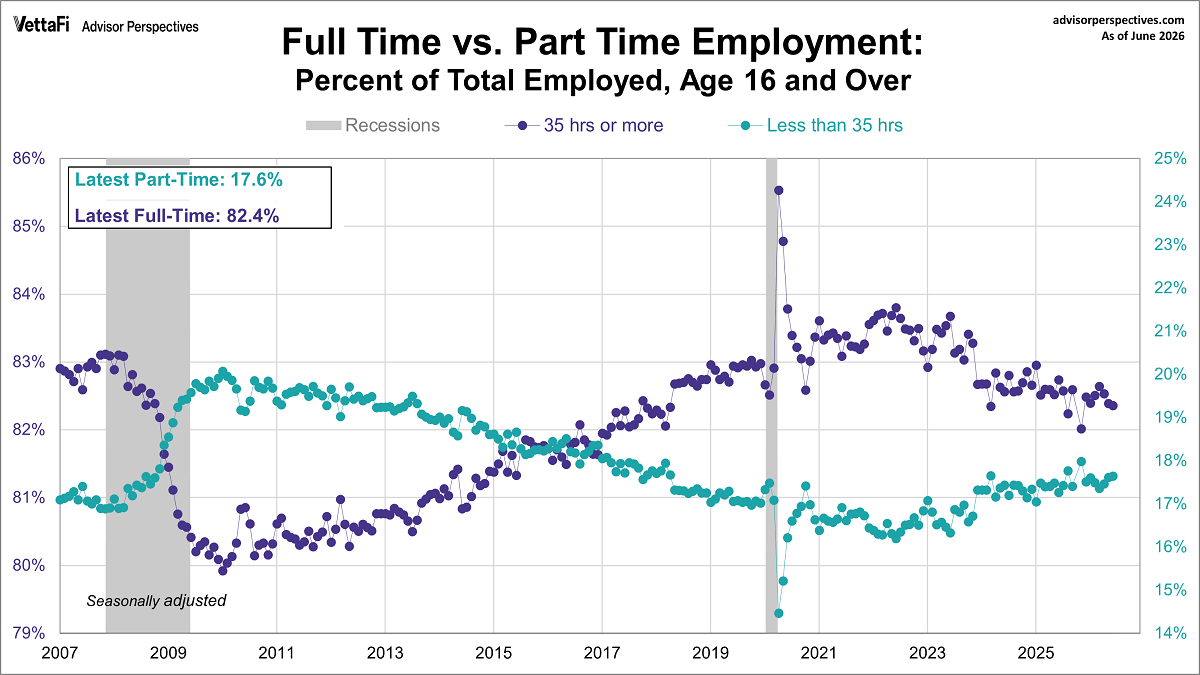
June's employment report showed that 17.6% of total employed workers were part time and 82.4% of total employed workers were full-time.
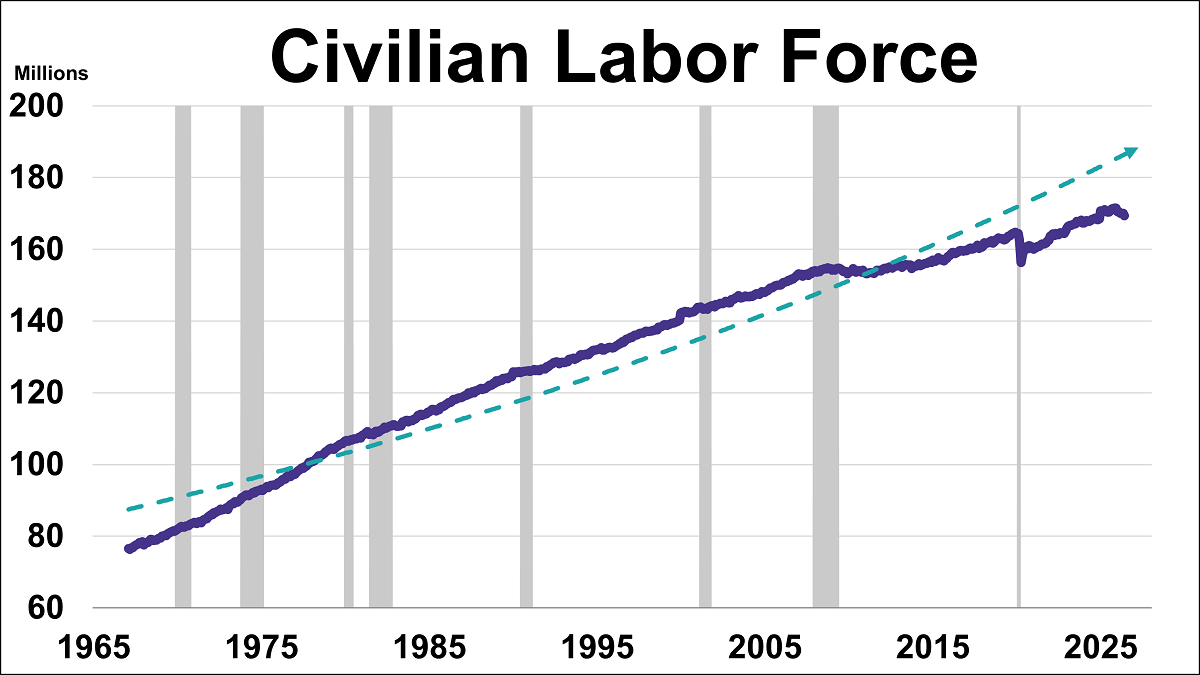
What does the ratio of unemployment claims to the civilian labor force tell us about where we are in the business cycle and recession risk?
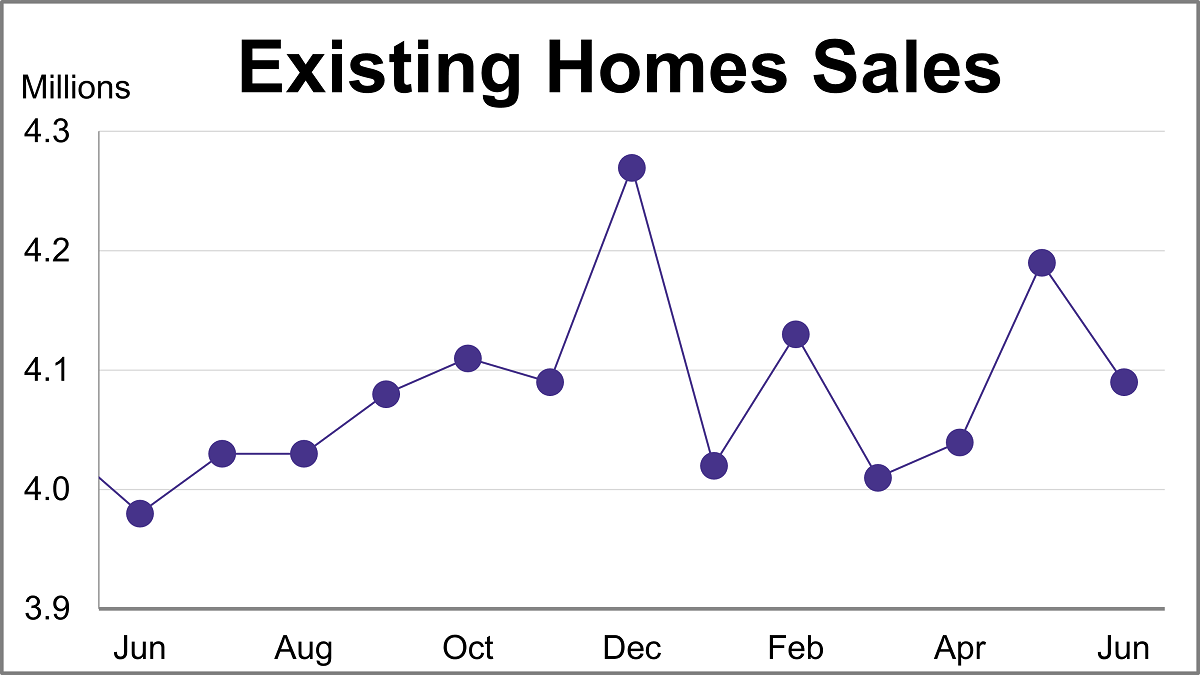
Existing home sales unexpectedly fell 2.4% in June as the median home price surged to a record high of $440,600.
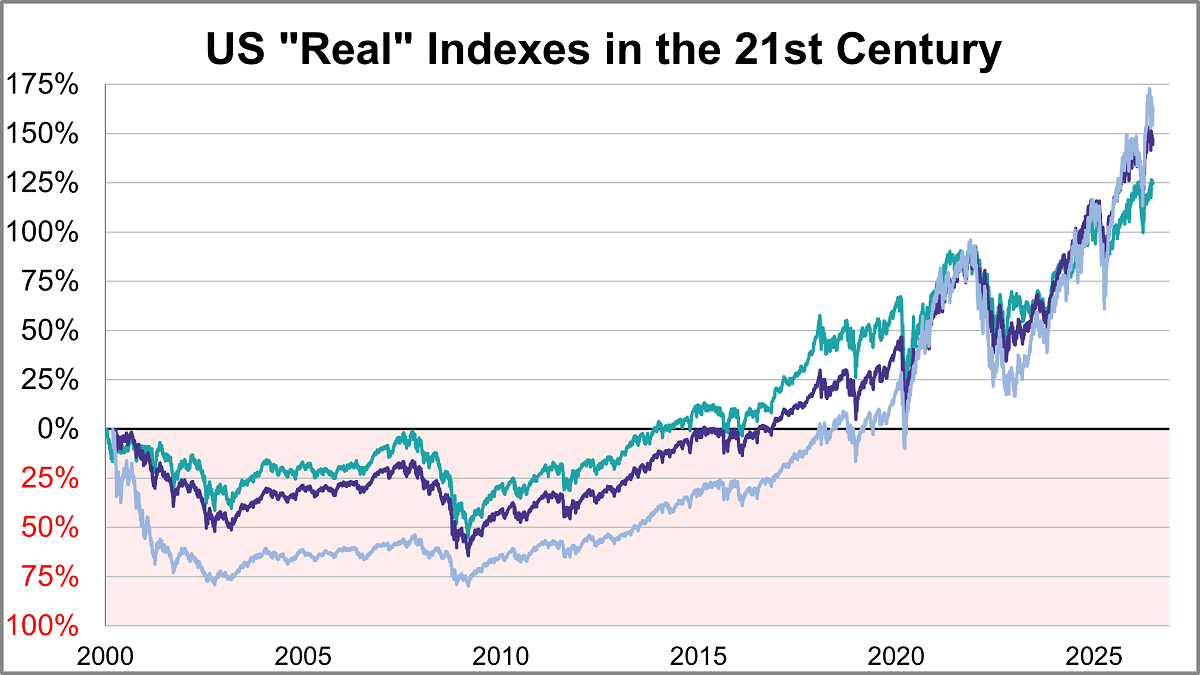
Here is a look at real (inflation-adjusted) charts of the S&P 500, Dow 30, and Nasdaq composite since their 2000 highs. We've updated this through the June 2026 close.
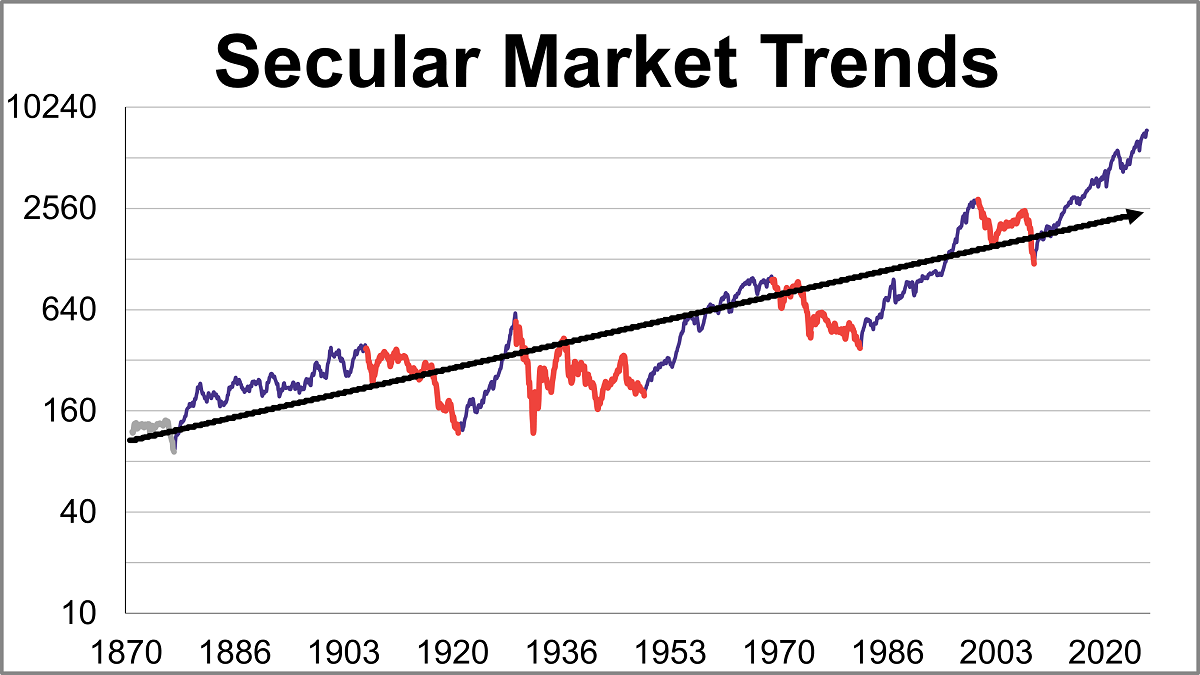
The S&P 500 real monthly averages of daily closes reached a its all-time high in May 2026. Let's examine the past to broaden our understanding of the range of historical bull and bear market trends in market performance.
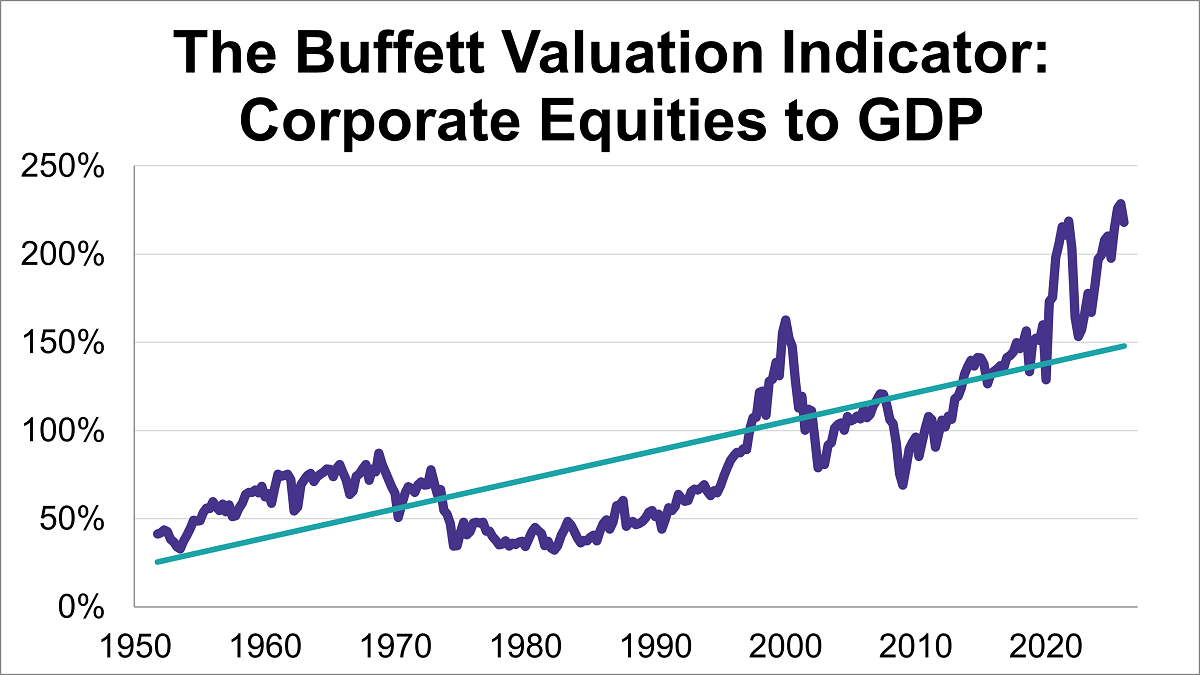
Following the Q1 GDP third estimate, the 'Buffett Indicator'—the ratio of corporate equities to GDP—now stands at 218.1%. This marks the fourth-highest reading in history.
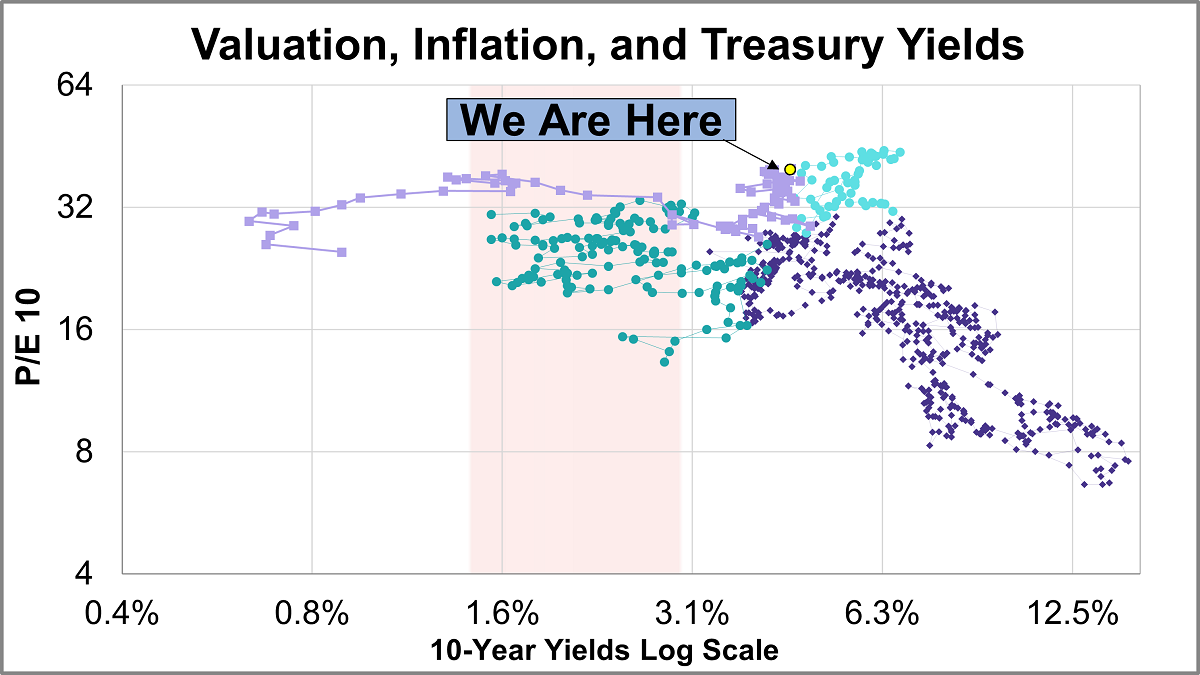
Our monthly market valuation updates have long had the same conclusion: US stock indexes are significantly overvalued, which suggests cautious expectations for investment returns. This analysis focuses on the P/E10 ratio, key indicator of market valuation, and its correlation with inflation and the 10-year Treasury yield.
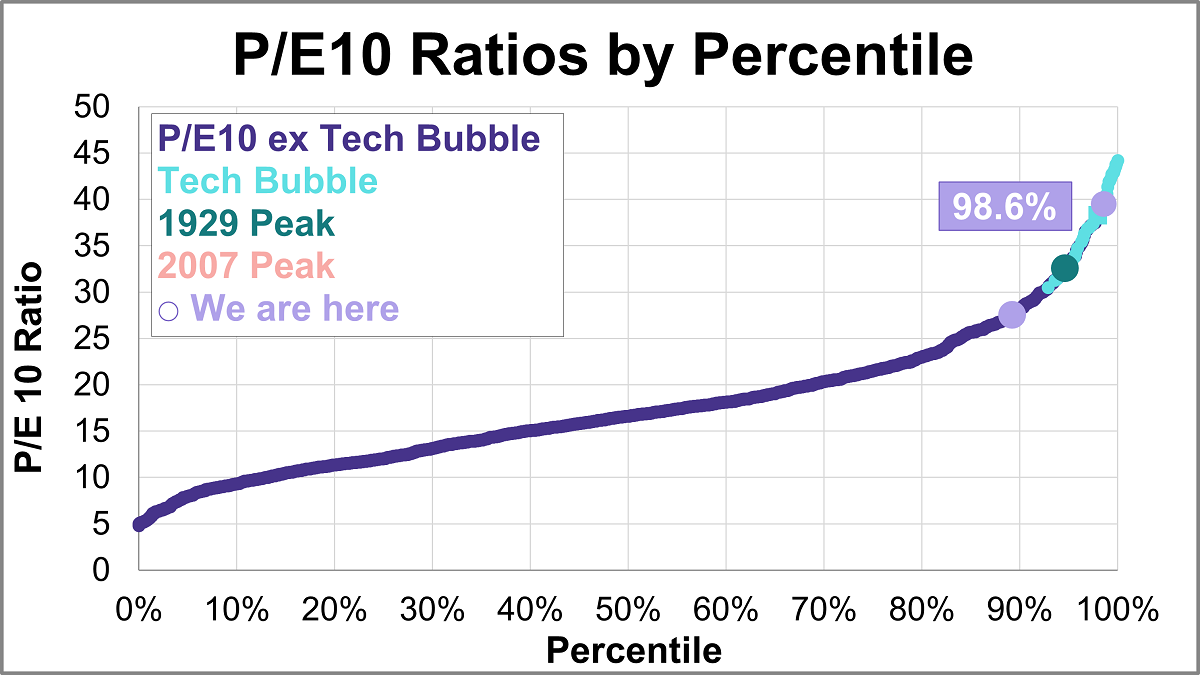
Here is the latest update of a popular market valuation method, Price-to-Earnings (P/E) ratio, using the most recent Standard & Poor's "as reported" earnings and earnings estimates, and the index monthly average of daily closes for the past month. The latest trailing twelve months (TTM) P/E ratio is 25.3 and the latest P/E10 ratio is 39.5.
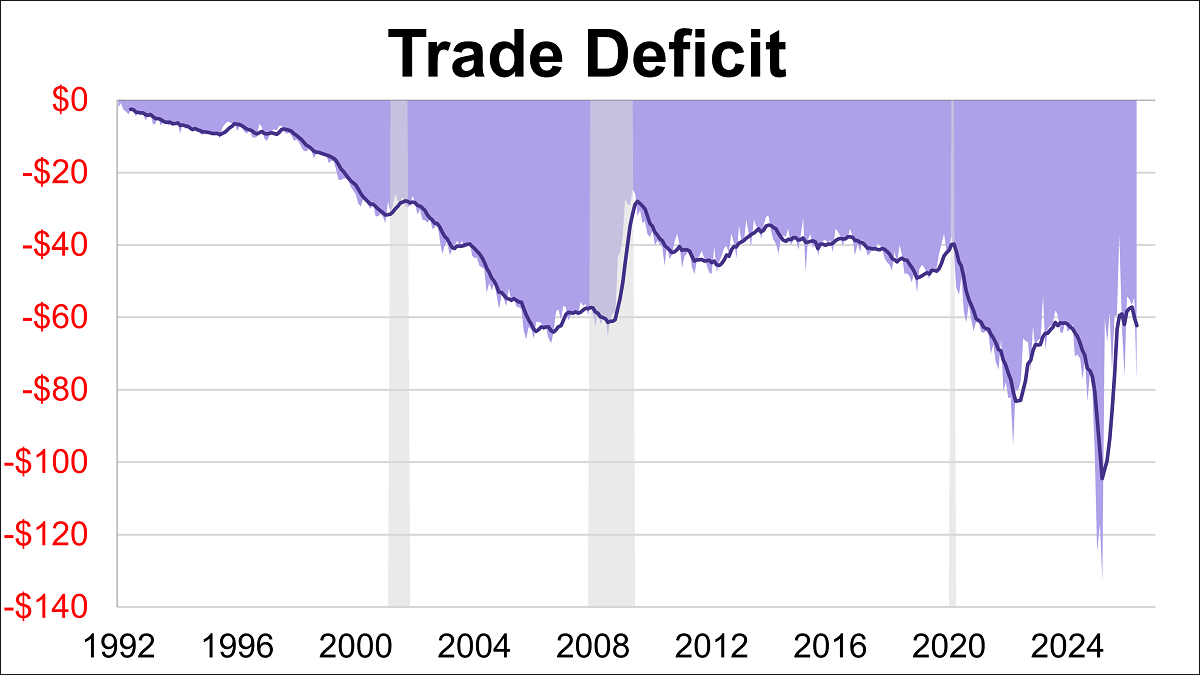
The U.S. trade deficit expanded over 40% in May to $77.59B, its widest gap since March 2025. The latest reading missed the forecast of -$78.30B.
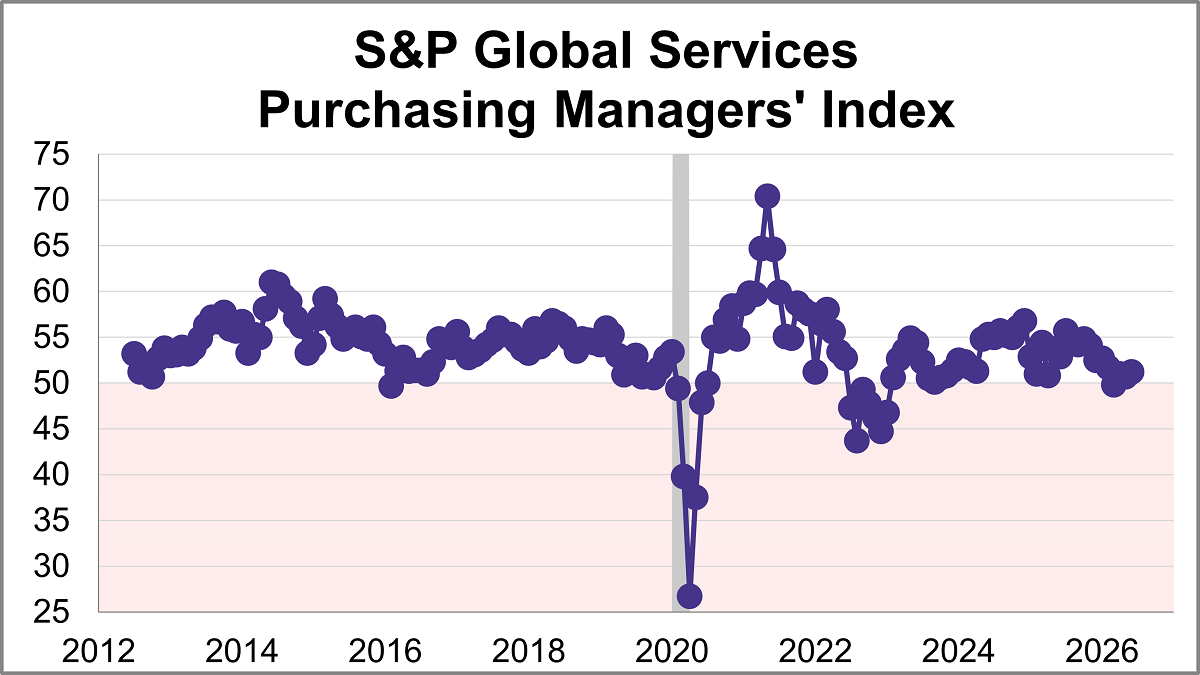
The June U.S. Services Purchasing Managers' Index (PMI) from S&P Global rose 0.5 points to 51.2, indicating a modest rise in service sector activity. The latest reading was just below the forecast of 51.3 and marked the strongest expansion in four months.