Discover Aberdeen’s closed-end funds (CEFs) for high yields, illiquid assets, long-term investments, and resilient income for 2026.
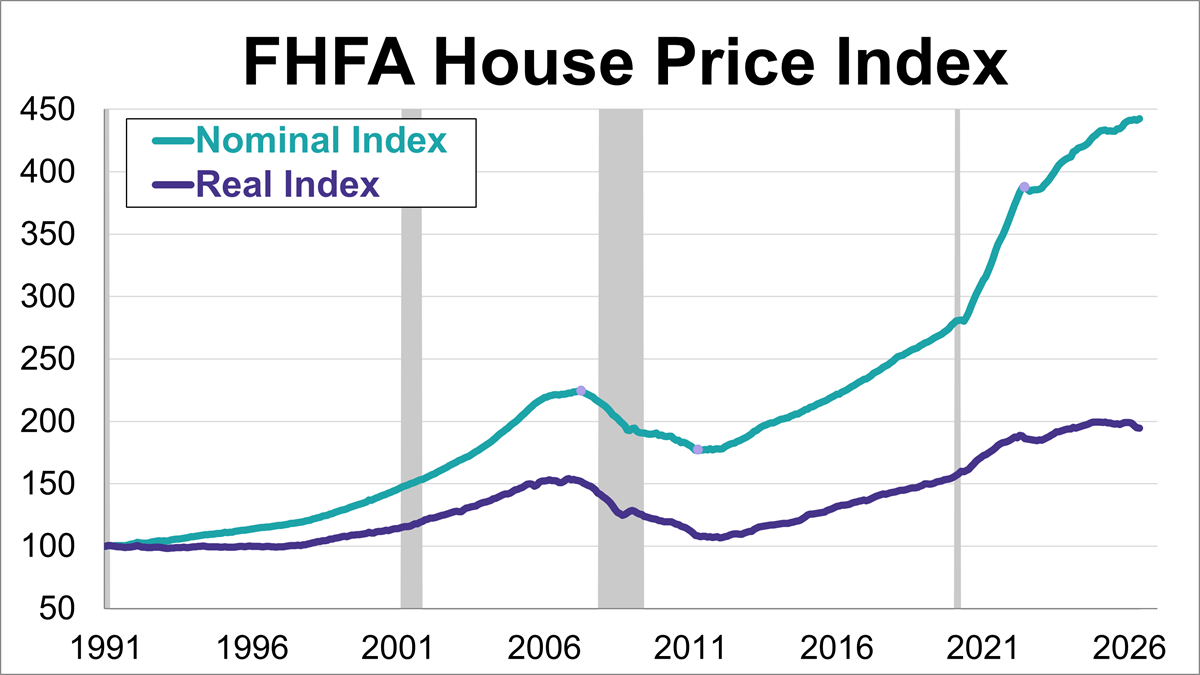
The Federal Housing Finance Agency (FHFA) House Price Index (HPI) rose more than expected in May, reaching a new record high.
As advisors face outflows to client income and one-time distributions, organic growth via client pickups can prove a useful asset, according to a recent report.
A wave of new active ETFs is reshaping the fund landscape, and advisors now need extra care when screening funds for their models.
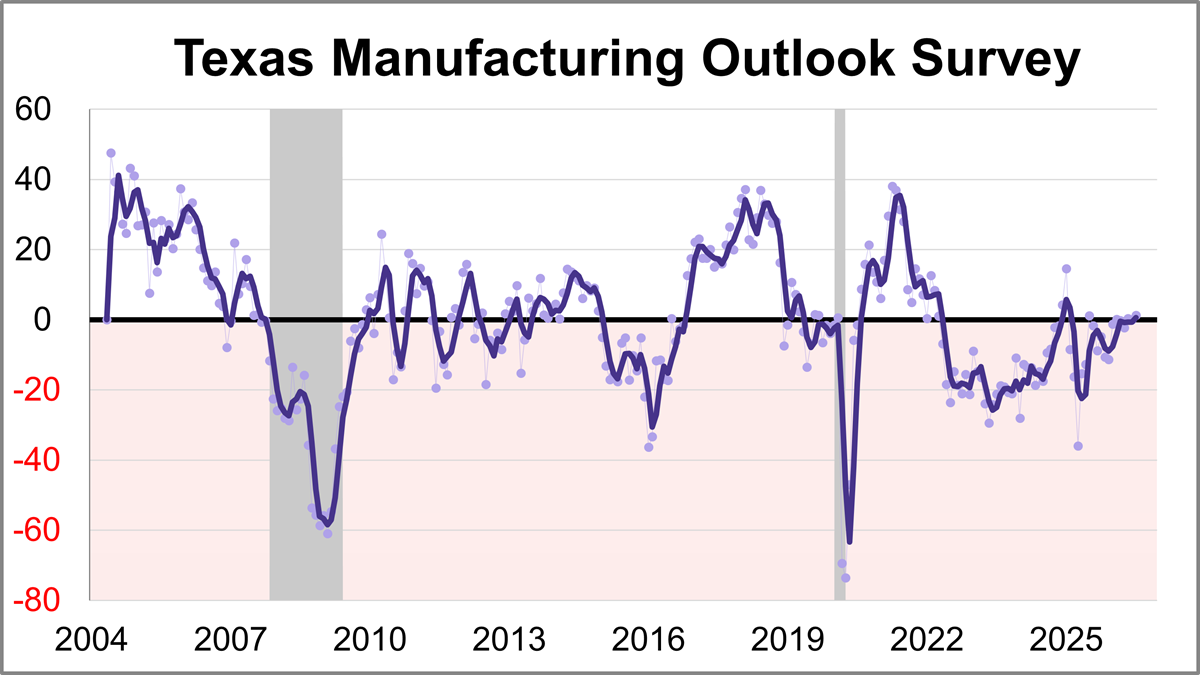
The Dallas Fed released its Texas Manufacturing Outlook Survey (TMOS) for July. The general business activity index rose 1.3 points to 1.3, indicating accelerated growth of manufacturing activity and improved business conditions perceptions.
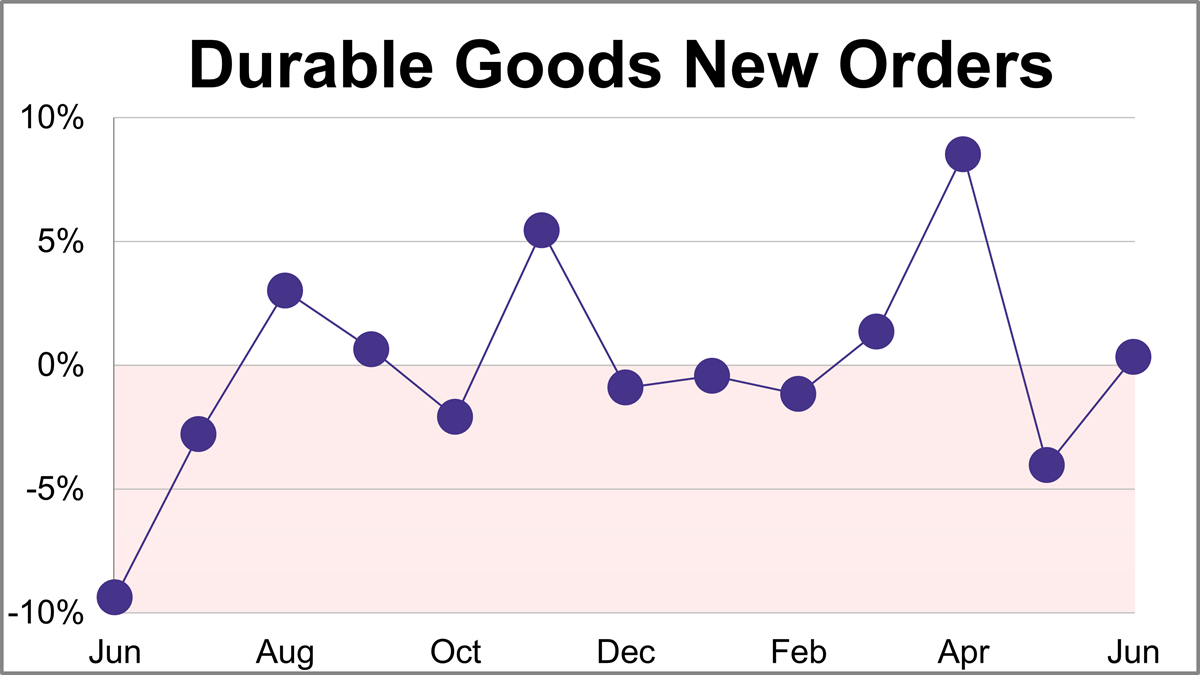
New orders for manufactured durable goods rose 0.3% in June to $334.77B, less than the projected 1.6% monthly growth.
Research Affiliates and PIMCO leadership analyze key 2026 midyear market shifts, warning of elevated U.S. and AI equity valuations.
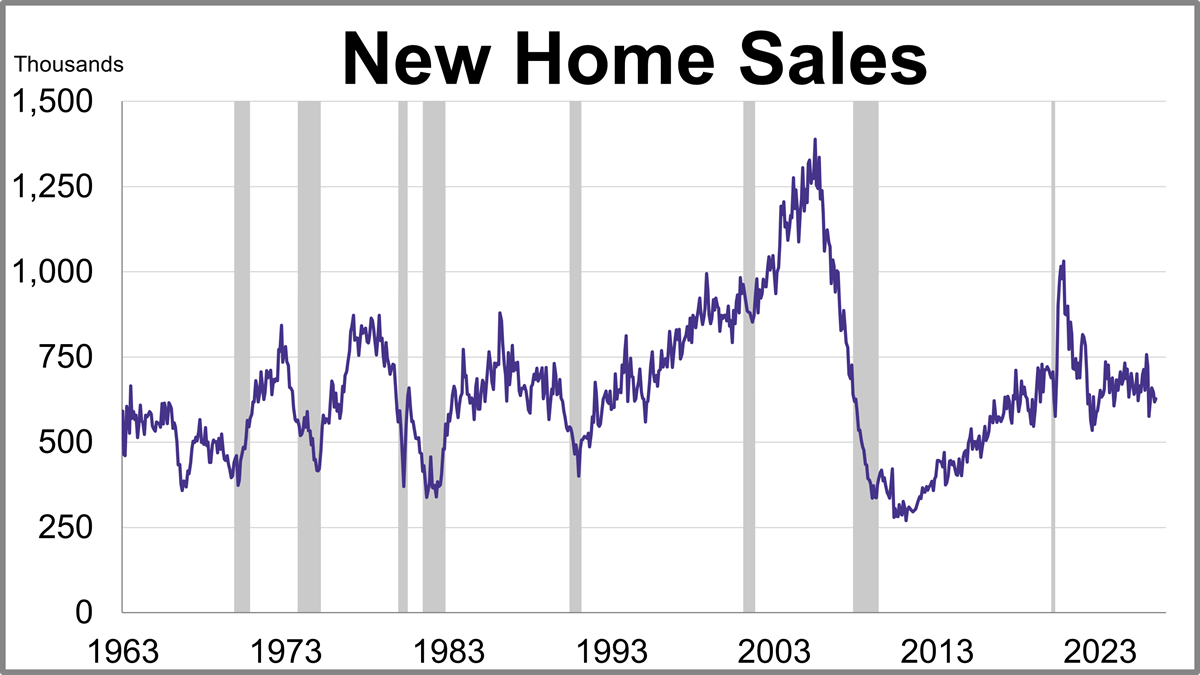
New home sales unexpectedly rose in June while the median price fell to its lowest level in almost a year.
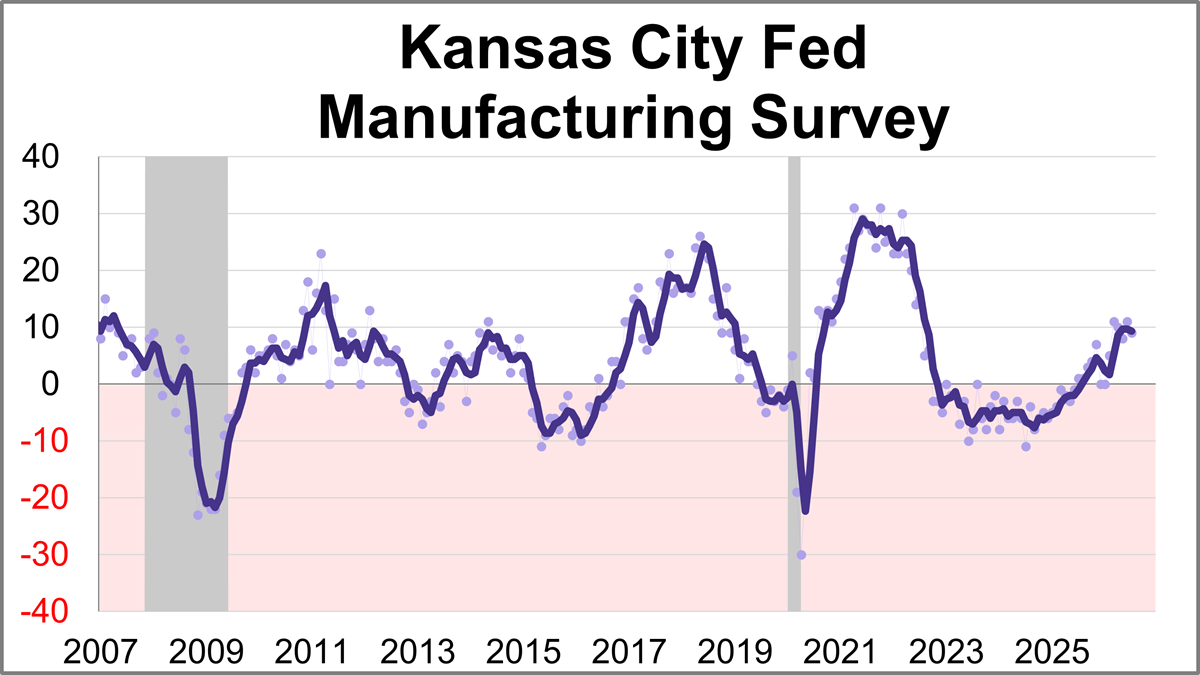
The Kansas City Fed Manufacturing Survey revealed regional activity remained steady in June. The composite index came in at 9 this month, down slightly from 11 in June but still indicating continued expansion.
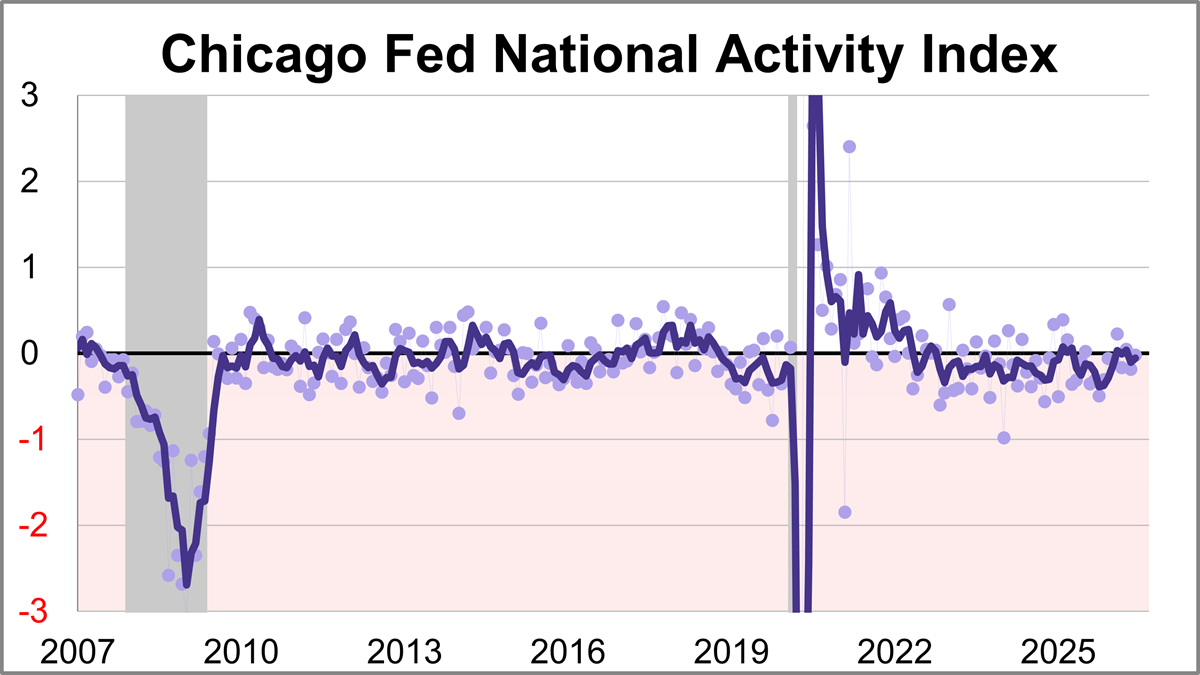
The Chicago Fed National Activity Index (CFNAI) rose to -0.02 in June from -0.19 in May. One of the four broad categories of indicators used to construct the index decreased from May, and two categories made negative contributions.
A Roland Berger study finds family offices moving capital into infrastructure and private equity while retreating from riskier bets abroad.
A handful of key economic data points dropped last week, painting a picture of an economy that is successfully downshifting from its recent inflation peaks even as consumers keep their footing.
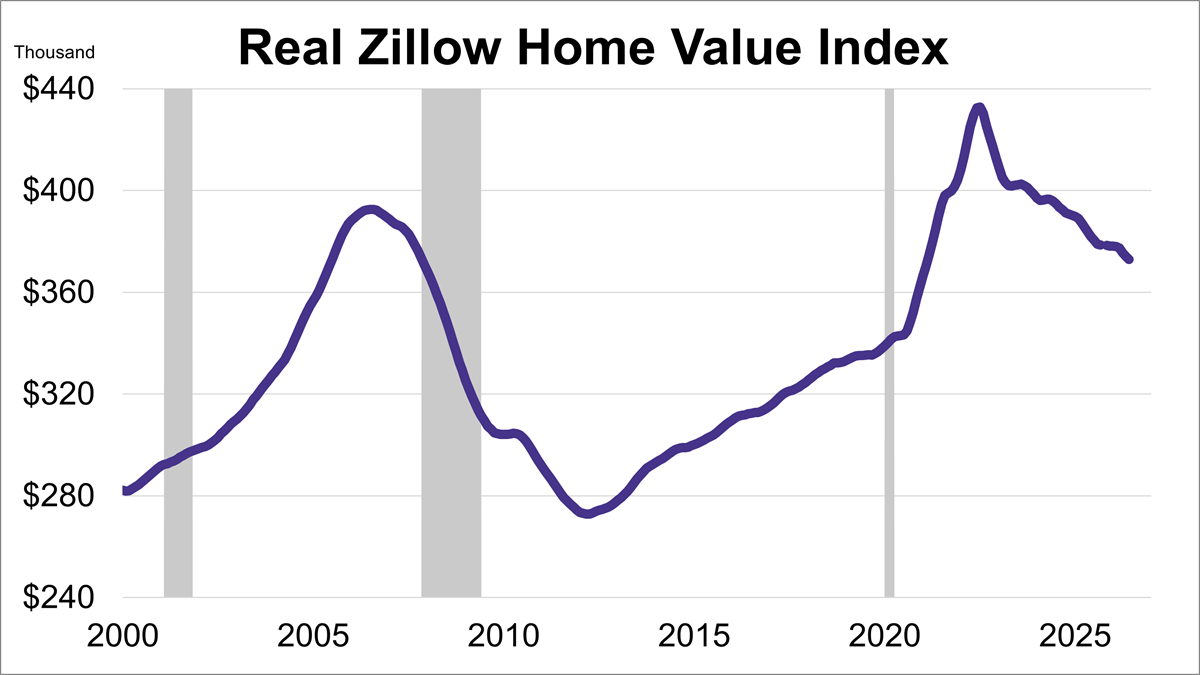
Home values fell for a second straight month in June, according to the Zillow Home Value Index. Additionally, after adjusting for inflation, real home values dropped even more sharply, hitting their lowest level in over five years.
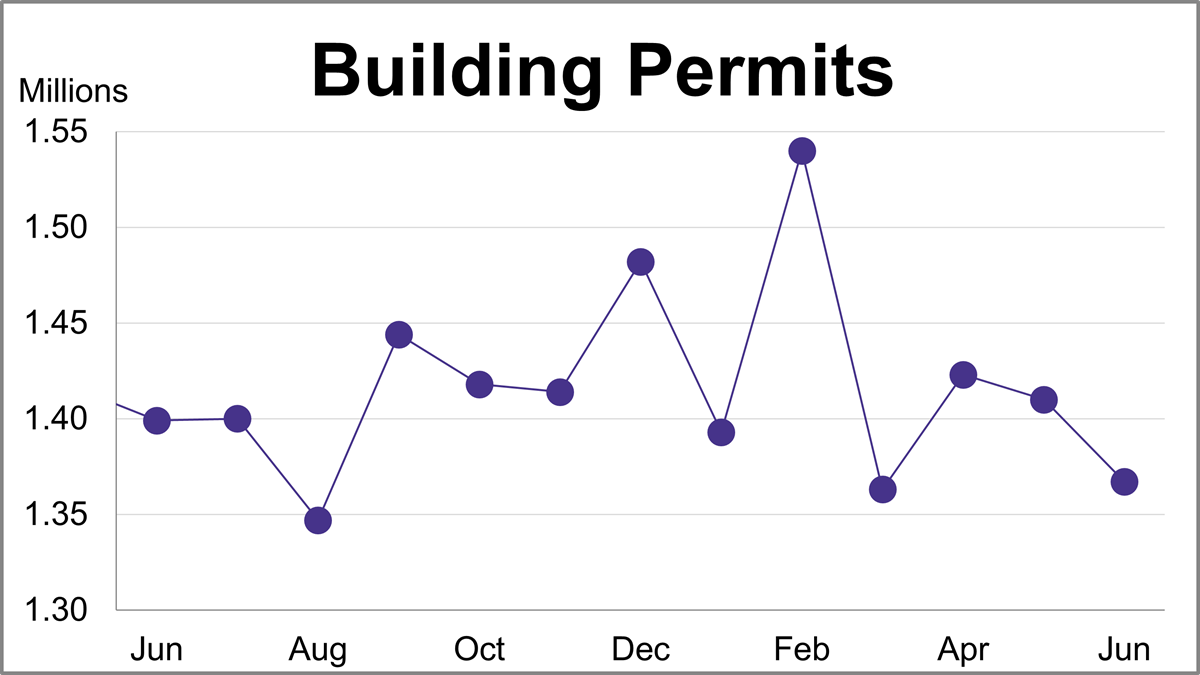
Building permits fell 3.0% in June to a seasonally adjusted annual rate of 1.367 million. The latest reading missed the forecast of 1.400 million.
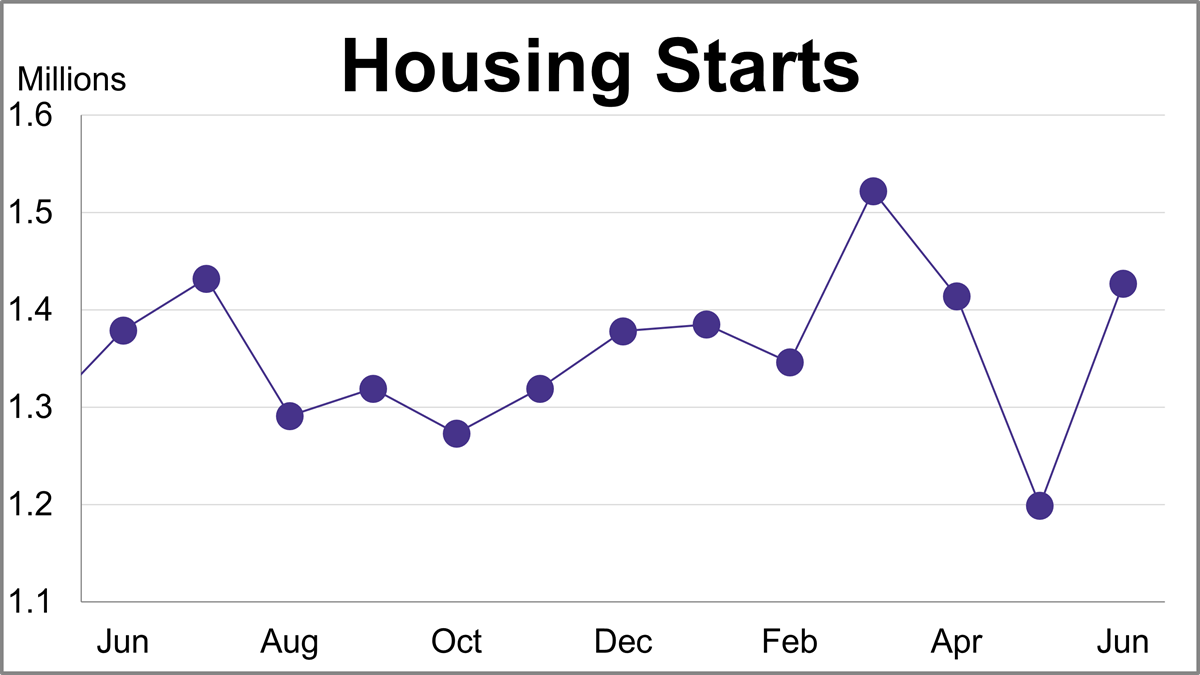
Housing starts jumped 19.0% in June to a seasonally adjusted annual rate of 1.427 million, beating forecasts driven by a massive surge in multi-family units.
Discover the top 10 most-read charts from the first half of 2026, covering historic market valuations, record margin debt, recession indicators, and global index performance.
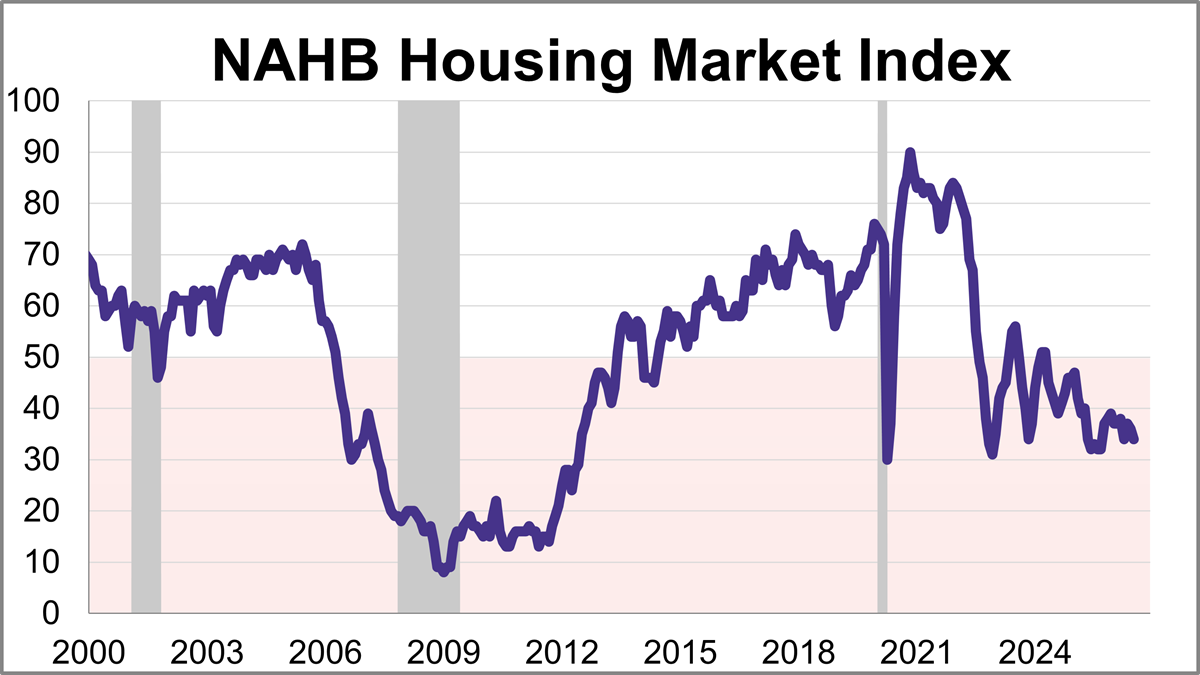
Builder confidence edged lower in July as ongoing affordability challenges continue to affect the housing market. The National Association of Home Builders (NAHB) Housing Market Index (HMI) fell 2 points from June to 34 this month, marking the 27th consecutive negative reading.
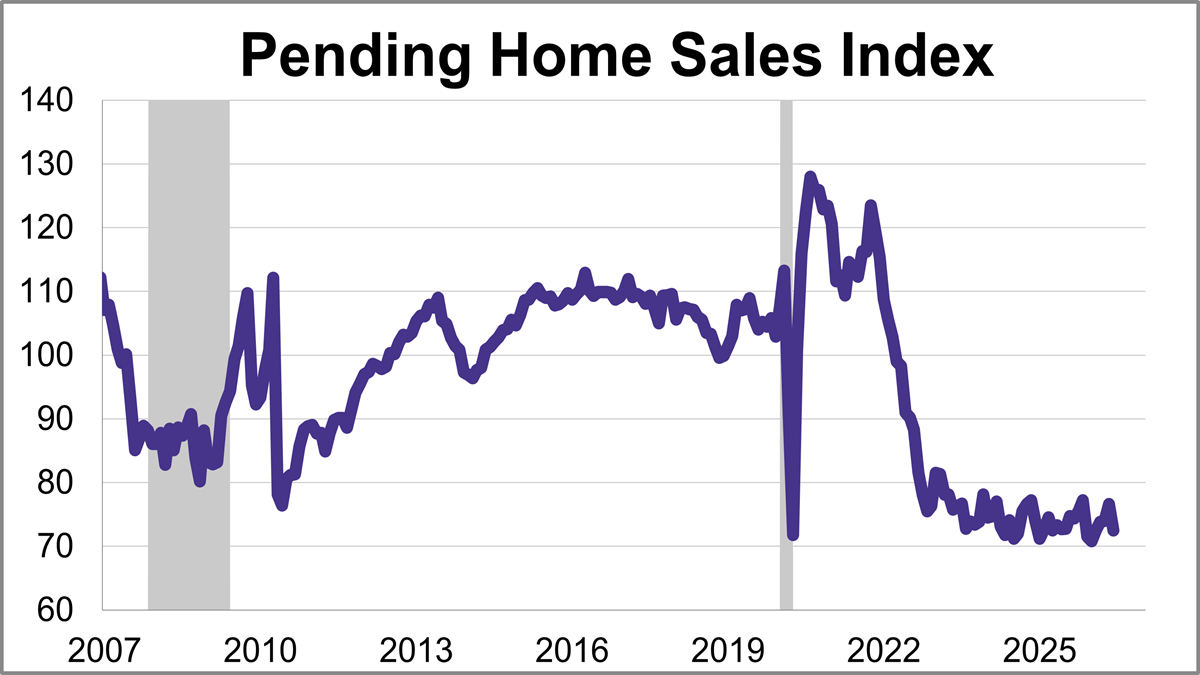
The National Association of Realtors® (NAR) pending home sales index sank 5.4% in June to 72.5, the lowest level since January.
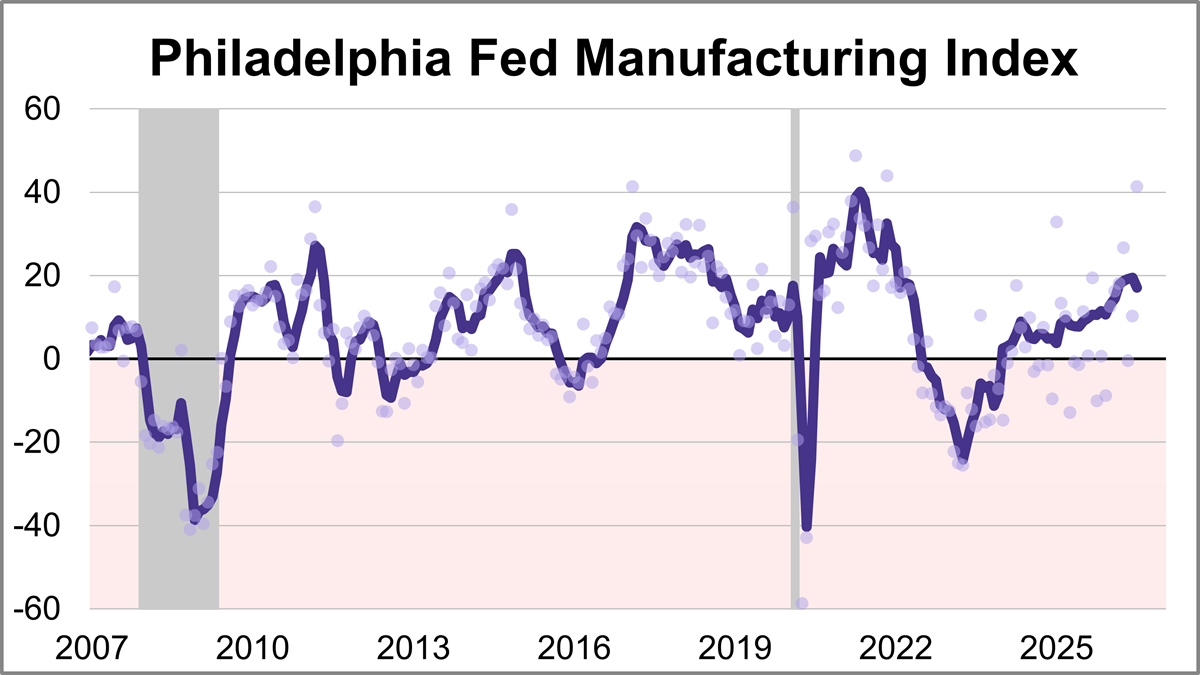
The Philadelphia Fed manufacturing index showed activity expanded significantly in July, with the index jumping 31.1 points to 41.4. This marks the highest level for the index since November 2021 and was more than triple the forecast of 12.7.
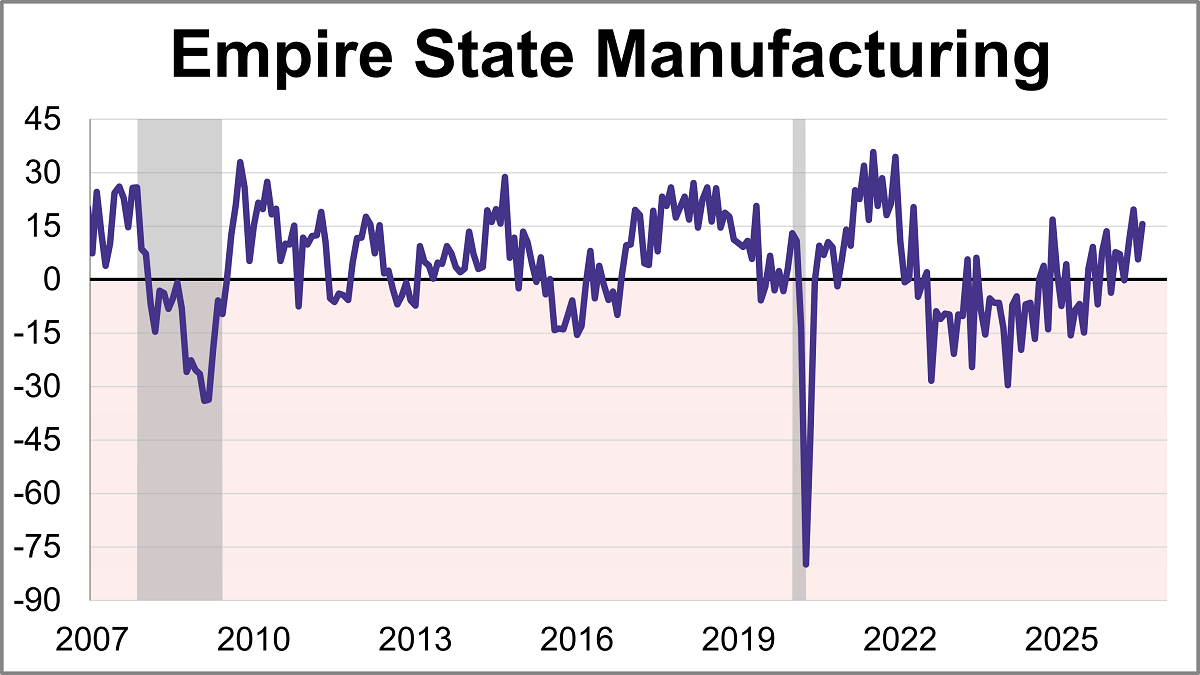
Manufacturing activity grew significantly in New York State, according to the Empire State Manufacturing July survey. The diffusion index for General Business Conditions remained in positive territory for a fourth straight month, jumping 9.9 points to 15.6 and coming in above the 9.3 forecast.
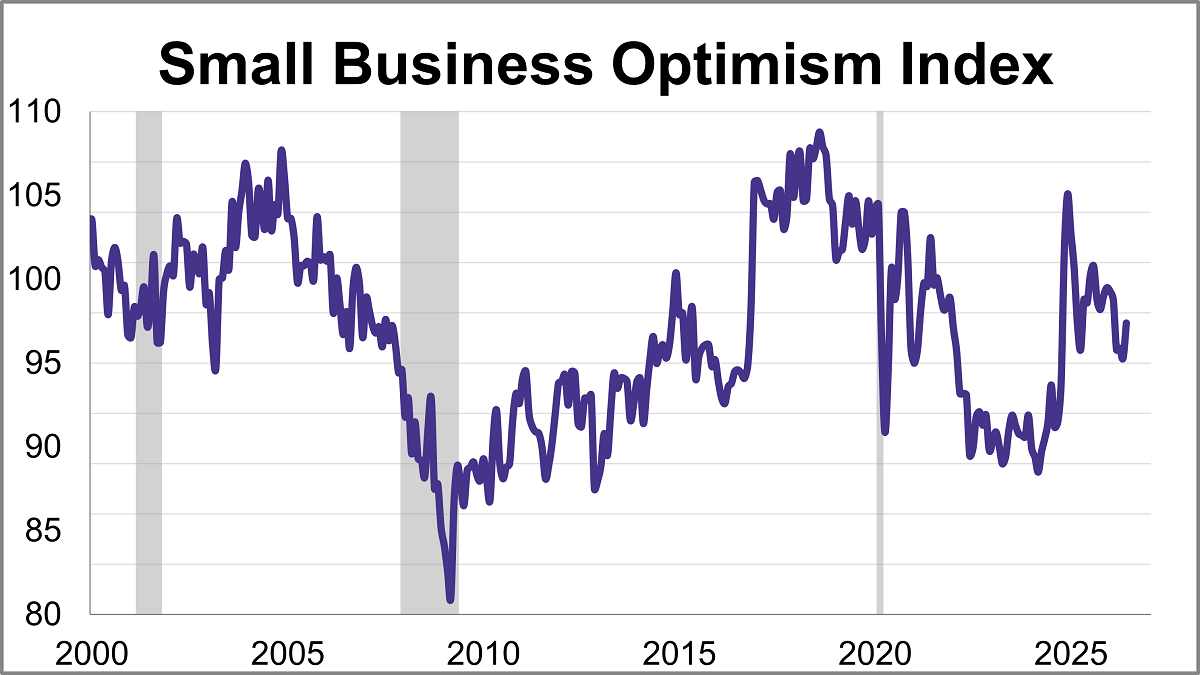
The NFIB Small Business Optimism Index rose 2.1 points to 97.4, reaching its highest level since February. However, the index remains below its historical average for a fourth straight month.
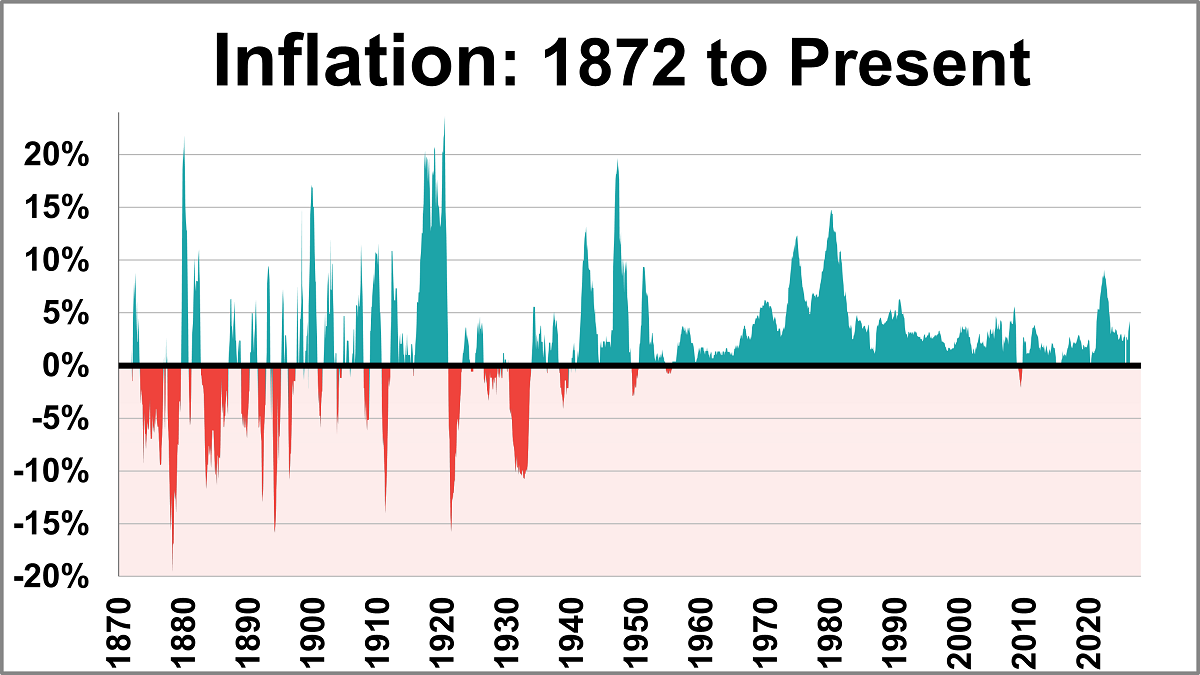
The June release of the Consumer Price Index for Urban Consumers (CPI-U) places the year-over-year inflation rate at 3.53%. This pushes inflation back below the post-WWII average of 3.72% for the first time since March. Meanwhile, this marks the fourth consecutive month that the current rate is above the 10-year moving average, which currently sits at 3.29%.
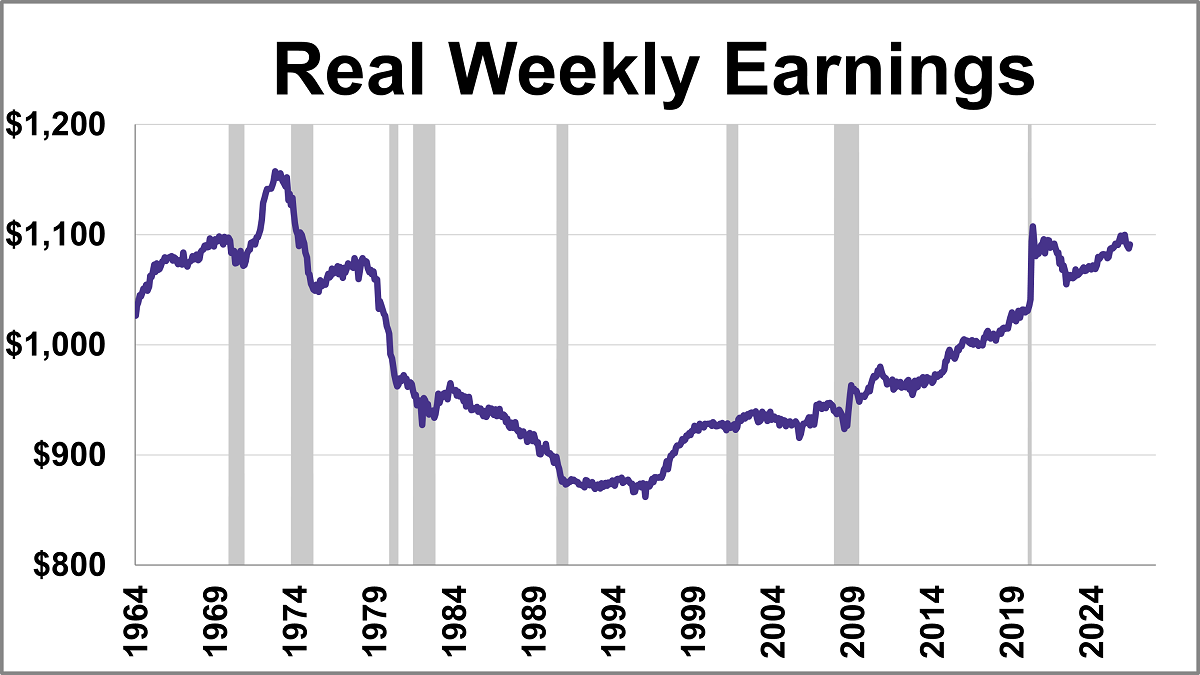
This series has been updated to include the June release of the consumer price index as the deflator and the monthly employment update. The latest hypothetical real (inflation-adjusted) annual earnings are at $54,560, down 5.7% from over 50 years ago.
Unpack the latest ICI flow data as long-term mutual funds bleed billions directly into low-cost, model-ready ETFs.
The articles that dominated the views in June were very much focused on the realities of investing, addressing everything from how inflation can affect your returns to incorporating AI into retirement evaluations.
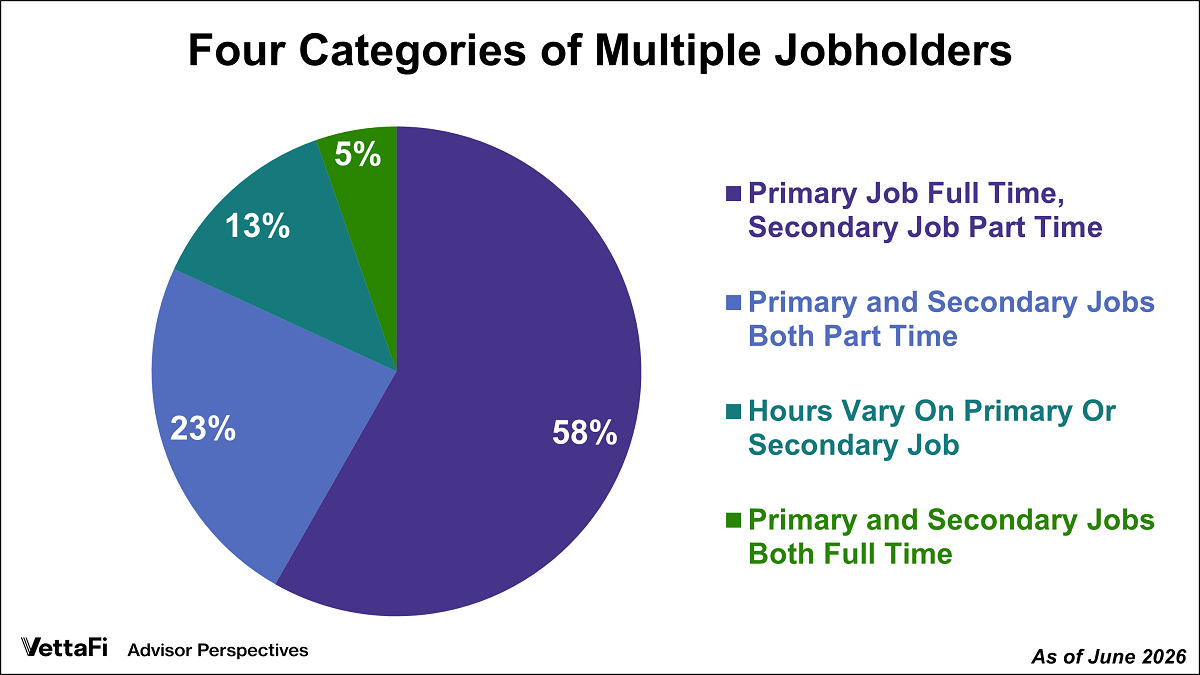
Multiple jobholders accounted for 5.2% of civilian employment in June.
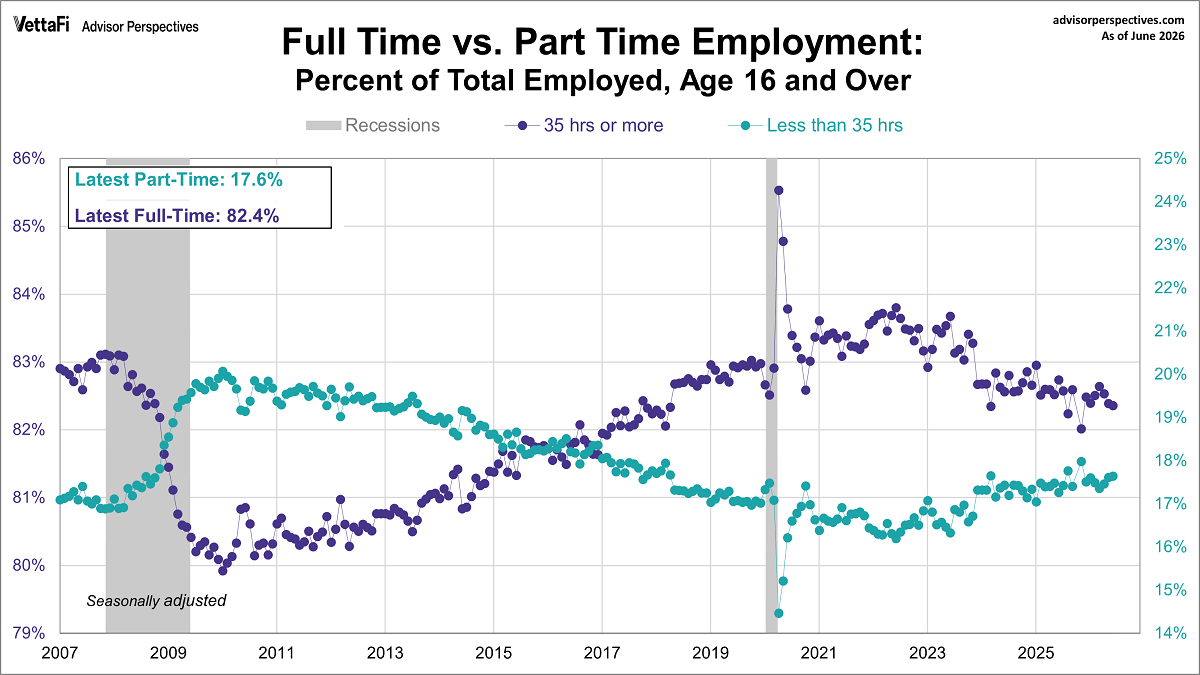
June's employment report showed that 17.6% of total employed workers were part time and 82.4% of total employed workers were full-time.
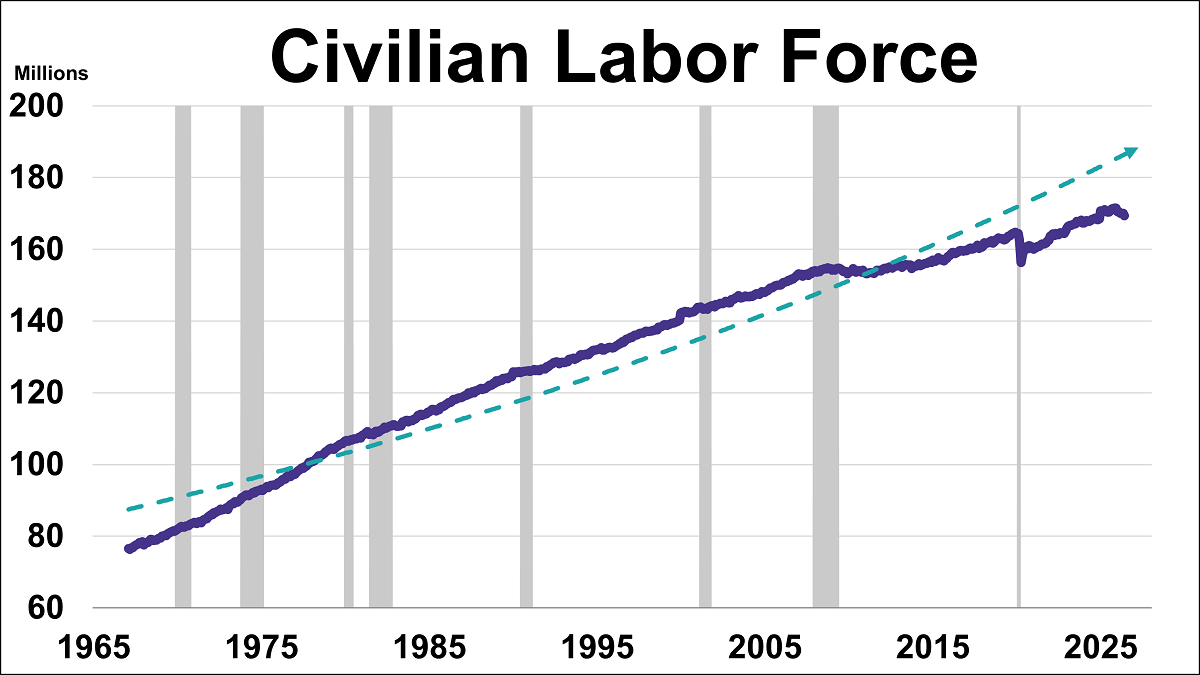
What does the ratio of unemployment claims to the civilian labor force tell us about where we are in the business cycle and recession risk?
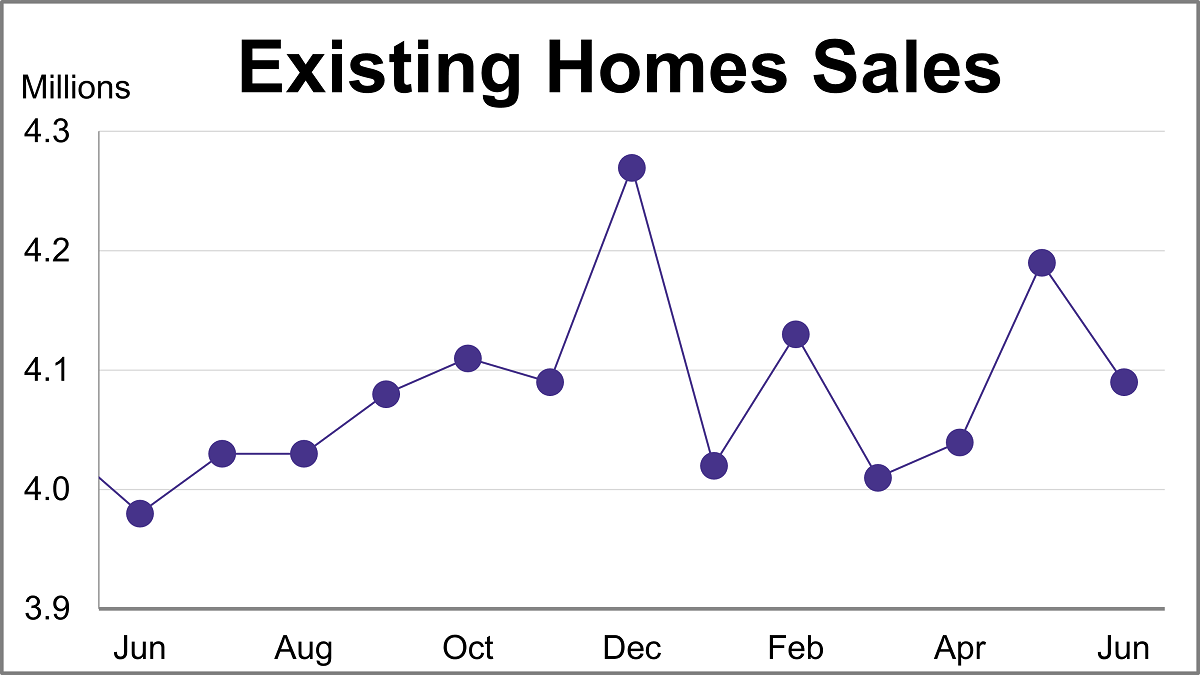
Existing home sales unexpectedly fell 2.4% in June as the median home price surged to a record high of $440,600.
Model portfolios are seeing billions in inflows, and part of that success may be from how these strategies implement ETFs and private assets.
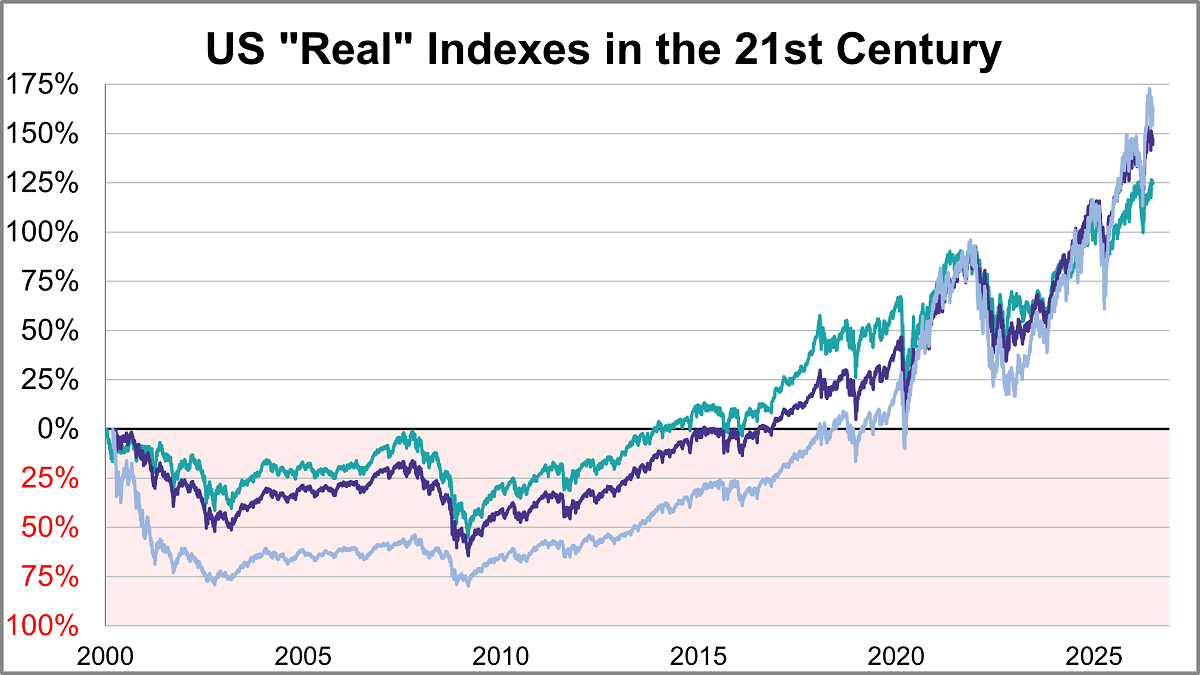
Here is a look at real (inflation-adjusted) charts of the S&P 500, Dow 30, and Nasdaq composite since their 2000 highs. We've updated this through the June 2026 close.
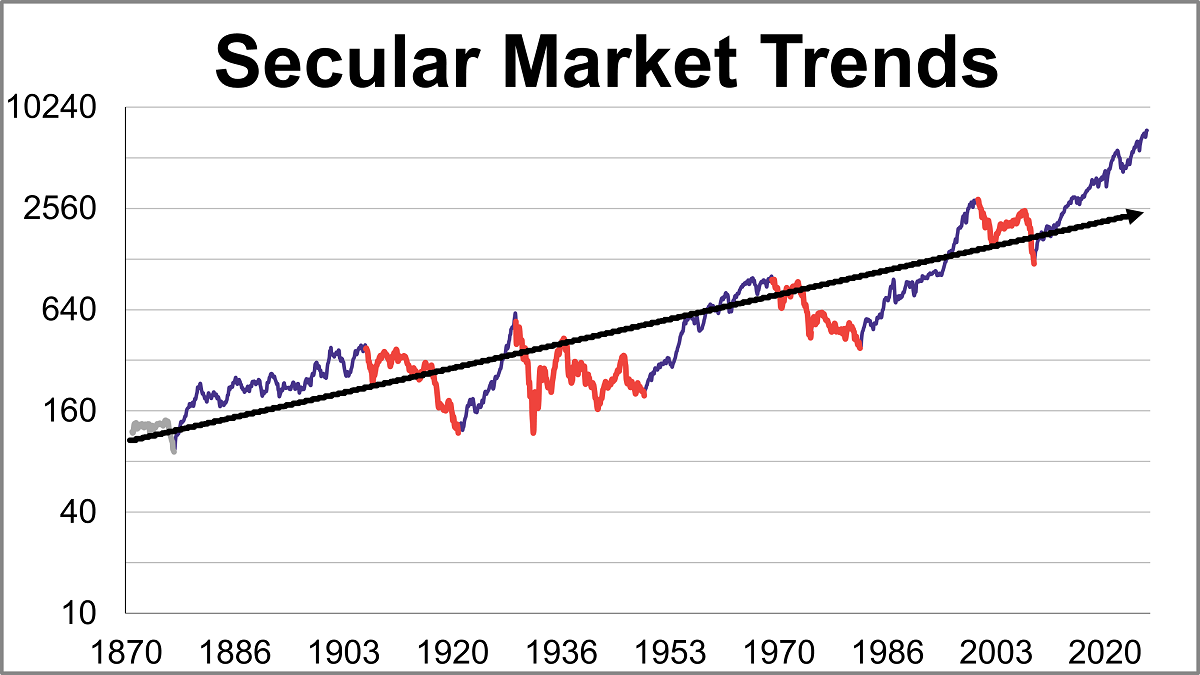
The S&P 500 real monthly averages of daily closes reached a its all-time high in May 2026. Let's examine the past to broaden our understanding of the range of historical bull and bear market trends in market performance.
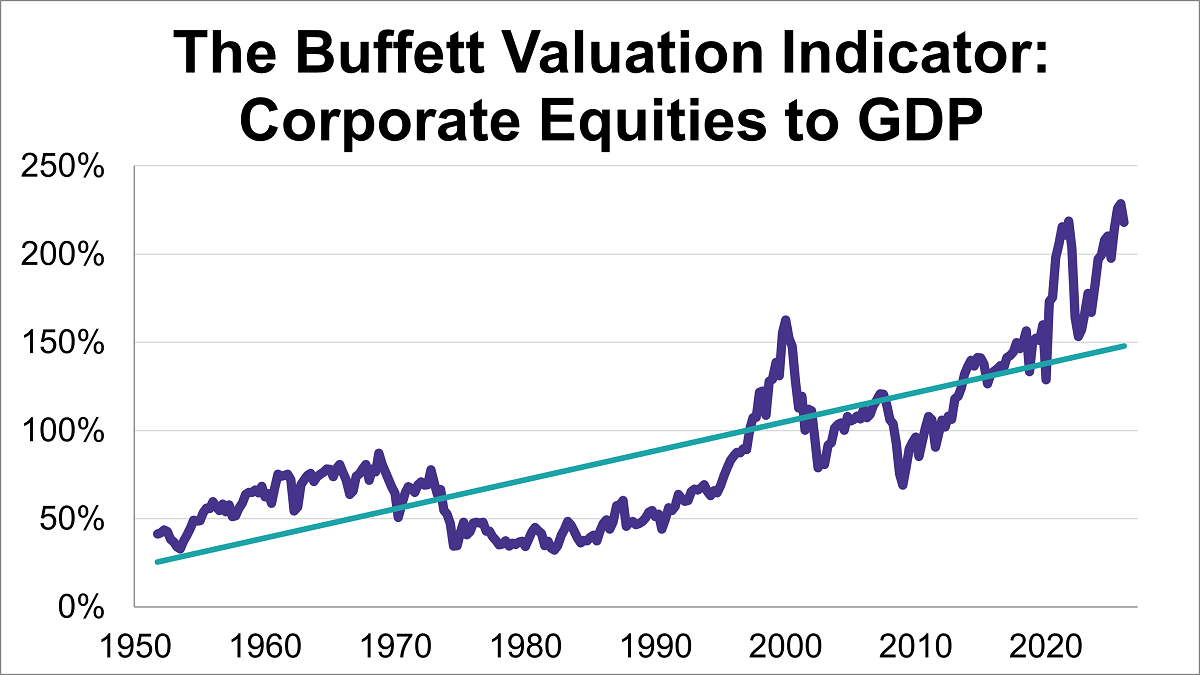
Following the Q1 GDP third estimate, the 'Buffett Indicator'—the ratio of corporate equities to GDP—now stands at 218.1%. This marks the fourth-highest reading in history.
AI represents a huge shift for financial advisors, who are always learning and adapting to a shifting investing landscape.
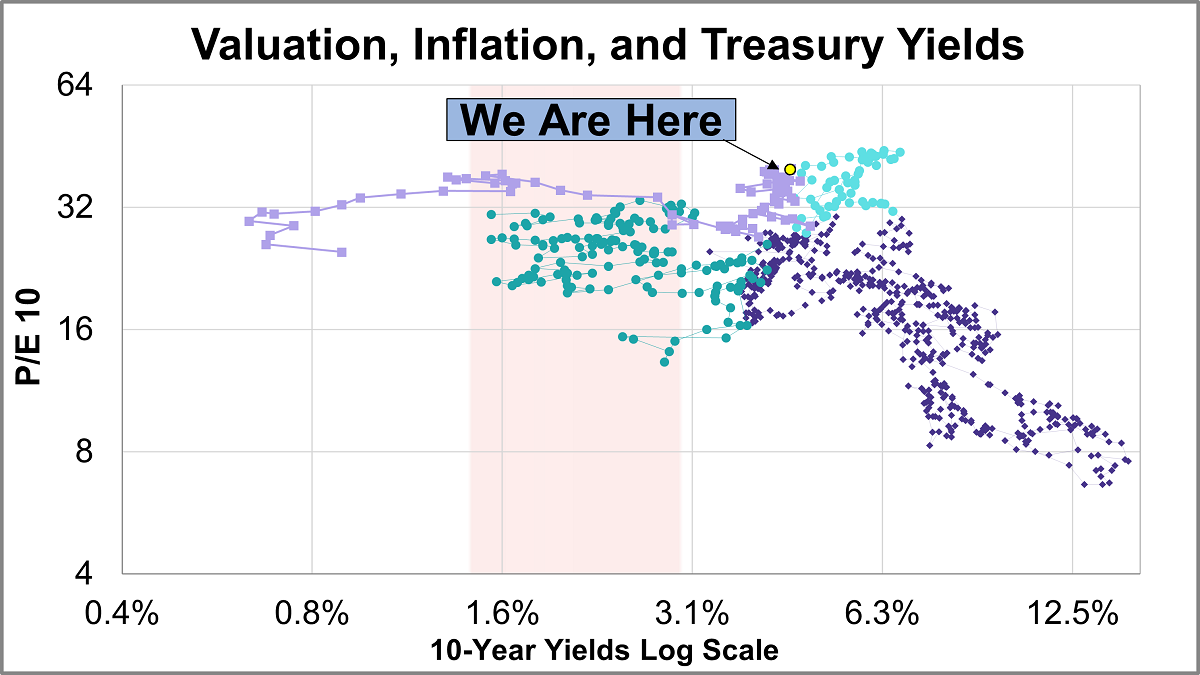
Our monthly market valuation updates have long had the same conclusion: US stock indexes are significantly overvalued, which suggests cautious expectations for investment returns. This analysis focuses on the P/E10 ratio, key indicator of market valuation, and its correlation with inflation and the 10-year Treasury yield.
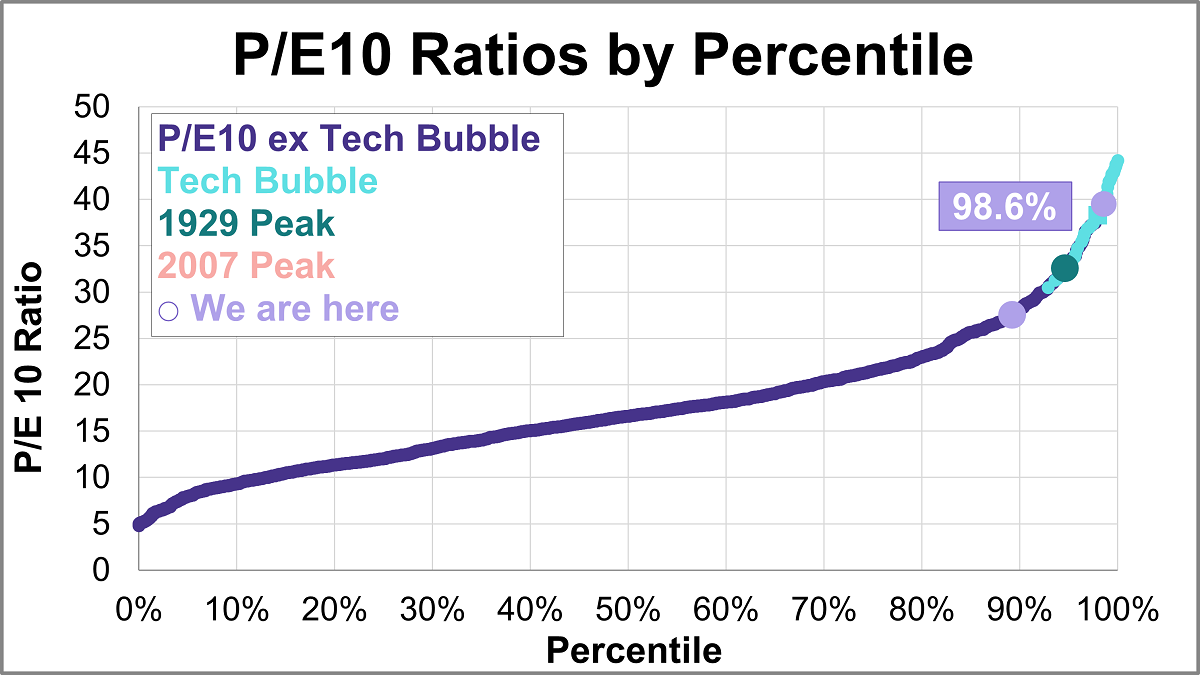
Here is the latest update of a popular market valuation method, Price-to-Earnings (P/E) ratio, using the most recent Standard & Poor's "as reported" earnings and earnings estimates, and the index monthly average of daily closes for the past month. The latest trailing twelve months (TTM) P/E ratio is 25.3 and the latest P/E10 ratio is 39.5.
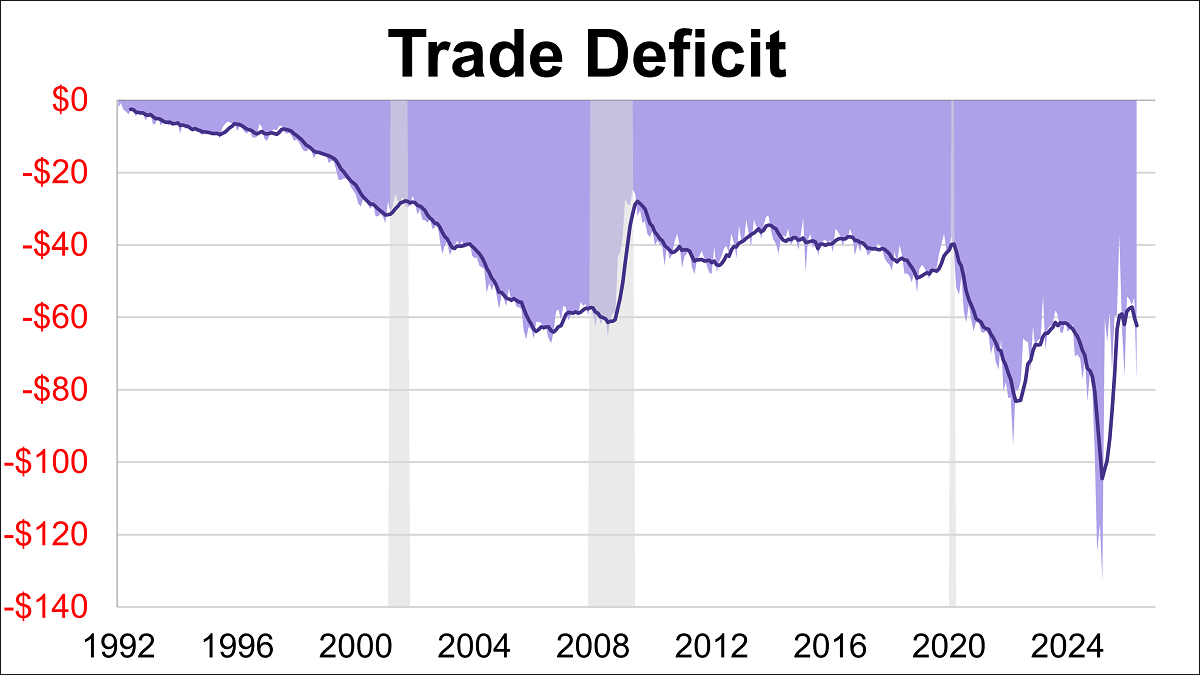
The U.S. trade deficit expanded over 40% in May to $77.59B, its widest gap since March 2025. The latest reading missed the forecast of -$78.30B.
The U.S. Treasury launched the Trump Accounts for childhood wealth building. Discover the five low-cost index ETFs anchoring the program.
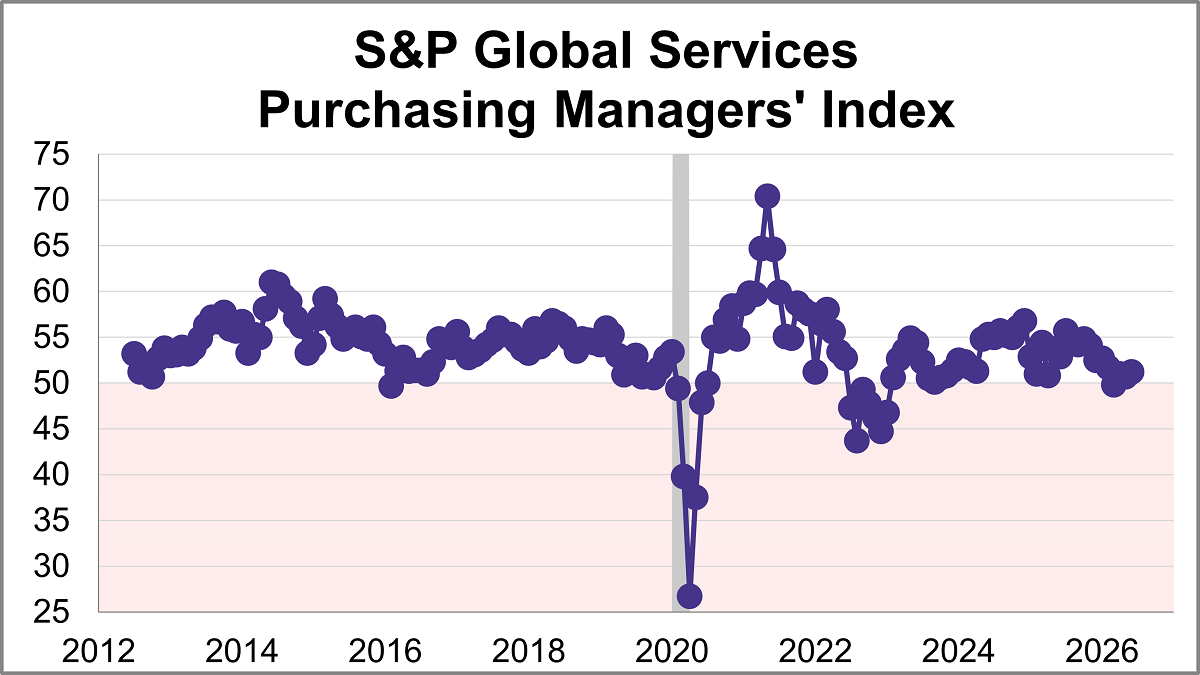
The June U.S. Services Purchasing Managers' Index (PMI) from S&P Global rose 0.5 points to 51.2, indicating a modest rise in service sector activity. The latest reading was just below the forecast of 51.3 and marked the strongest expansion in four months.
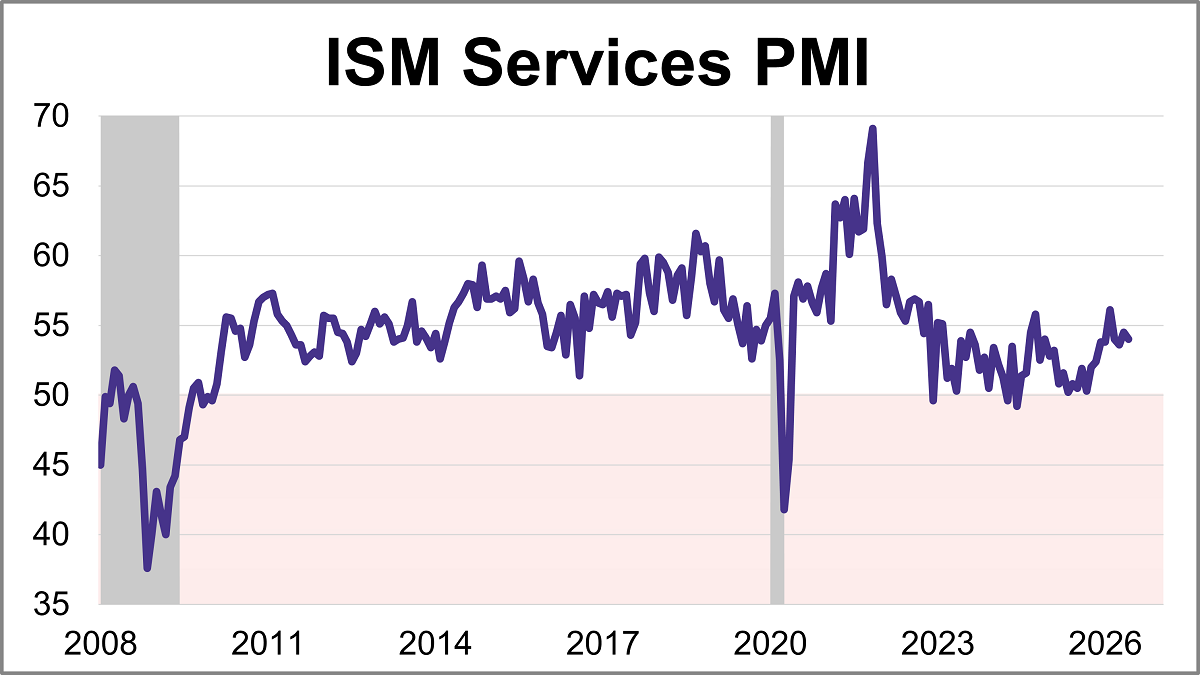
The Institute for Supply Management (ISM) released its June Services Purchasing Managers' Index (PMI), with the headline composite index at 54.0. This was slightly lower than the forecast of 54.2 but keeps the index in expansion territory for a 24th consecutive month.
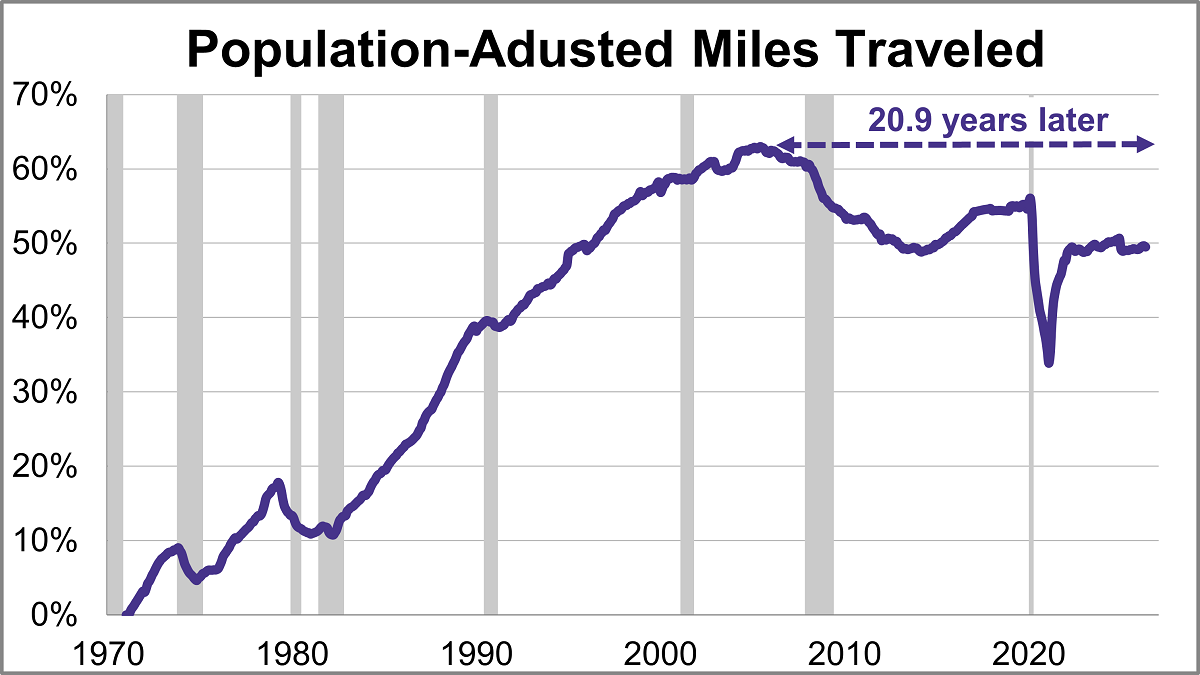
Travel on all roads and streets decreased in May. The 12-month moving average was down 0.06% month-over-month but was up 0.93% year-over-year. However, if we factor in population growth, the 12-month MA of the civilian population-adjusted data (age 16-and-over) was down 0.10% month-over-month and up 0.32% year-over-year.
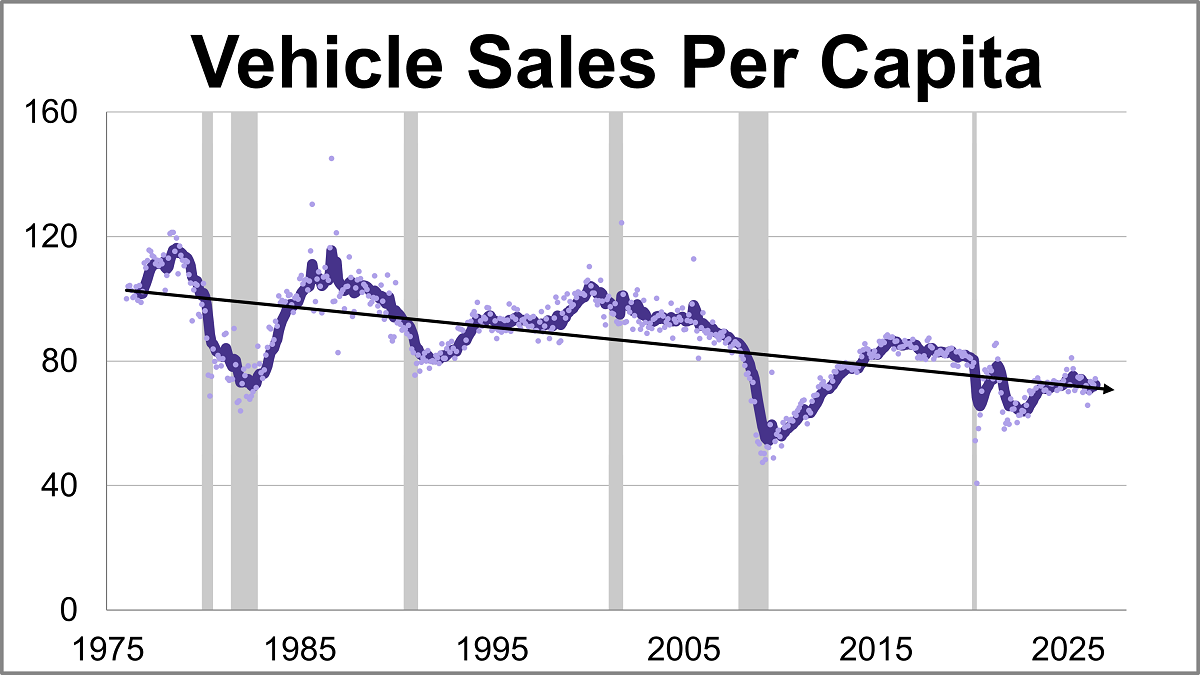
Vehicle sales rose to their highest level in nine months in June, coming in at a seasonally adjusted annual rate of 16.523 million units. This represents a 2.8% increase from the previous month and a 4.4% rise from one year ago.
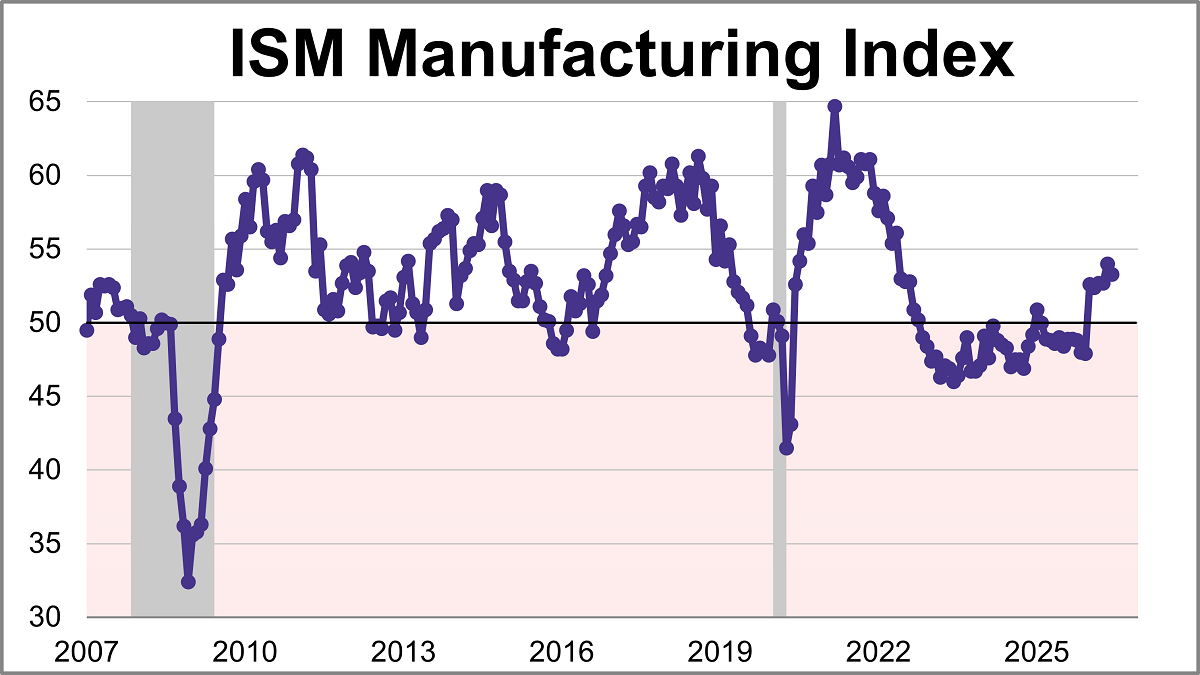
The Institute for Supply Management (ISM) manufacturing purchasing managers index (PMI) came in at 53.3 in June, down from 54.0 in May, marking slightly slower growth. The latest reading was just below the 53.8 forecast and is the index's sixth straight month in expansion territory.
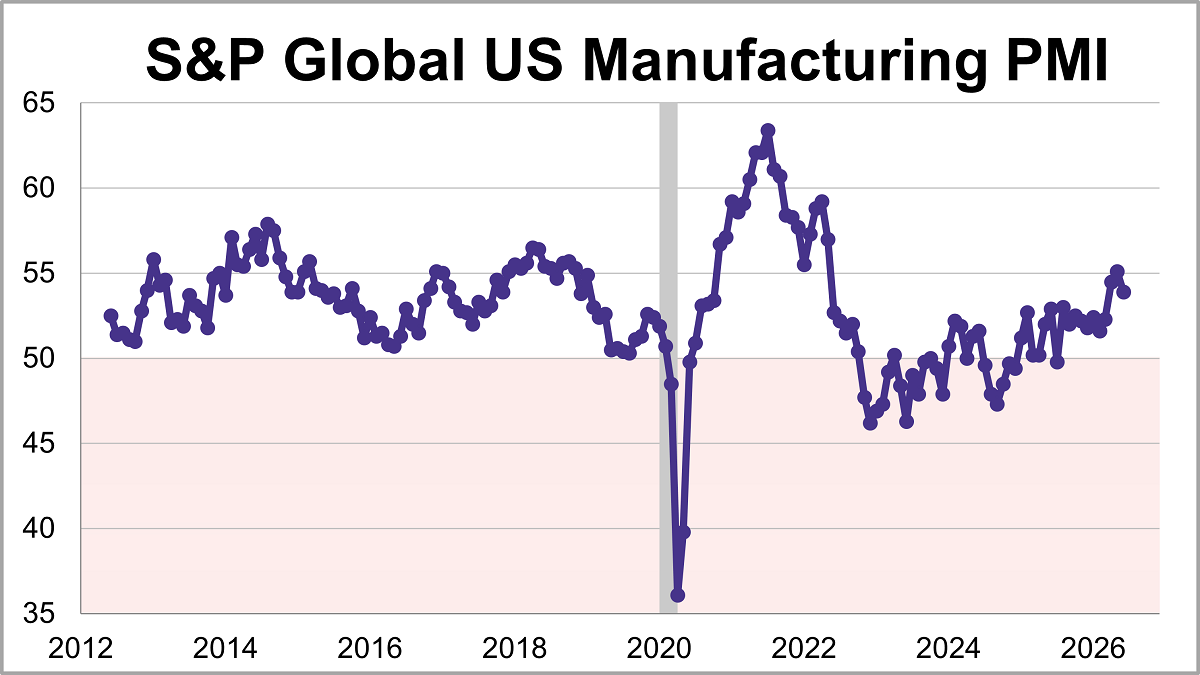
U.S. manufacturing expanded for an eleventh straight month in June but the growth eased to its lowest level in three months. The S&P Global PMI fell 1.2 points to 53.9 last month, falling short of the 55.7 forecast.
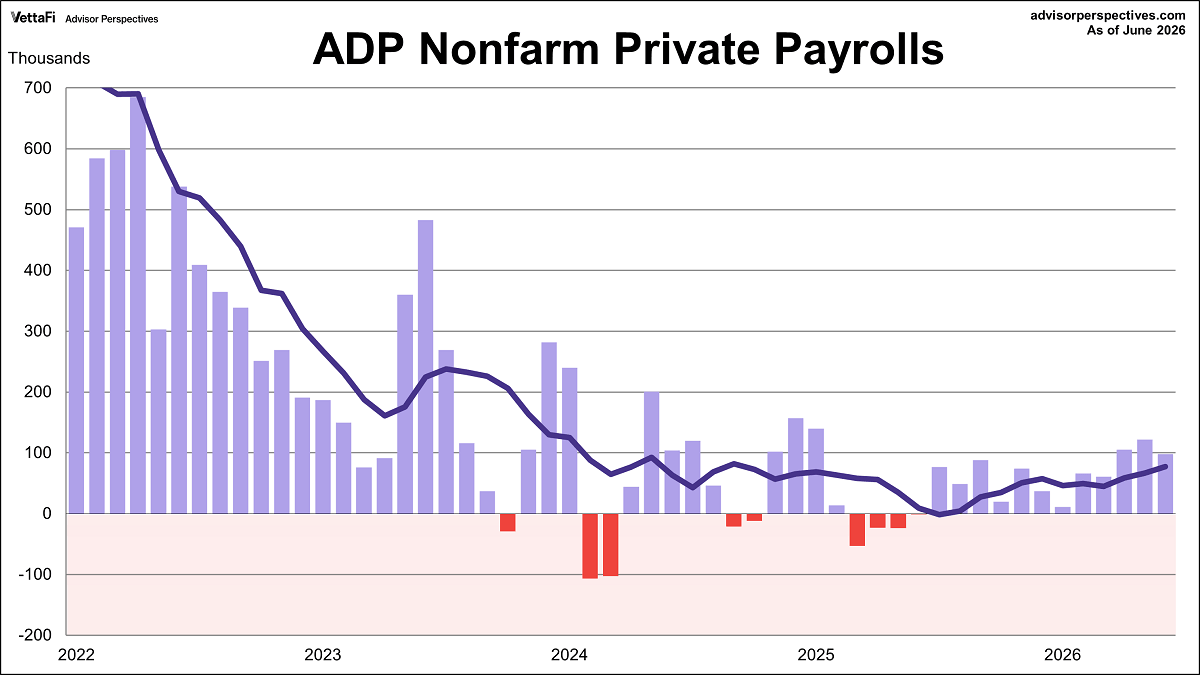
The ADP employment report revealed that 98,000 nonfarm private jobs were added in June, the twelfth straight month of growth. However, the latest figure was below the projected 118,000 addition.
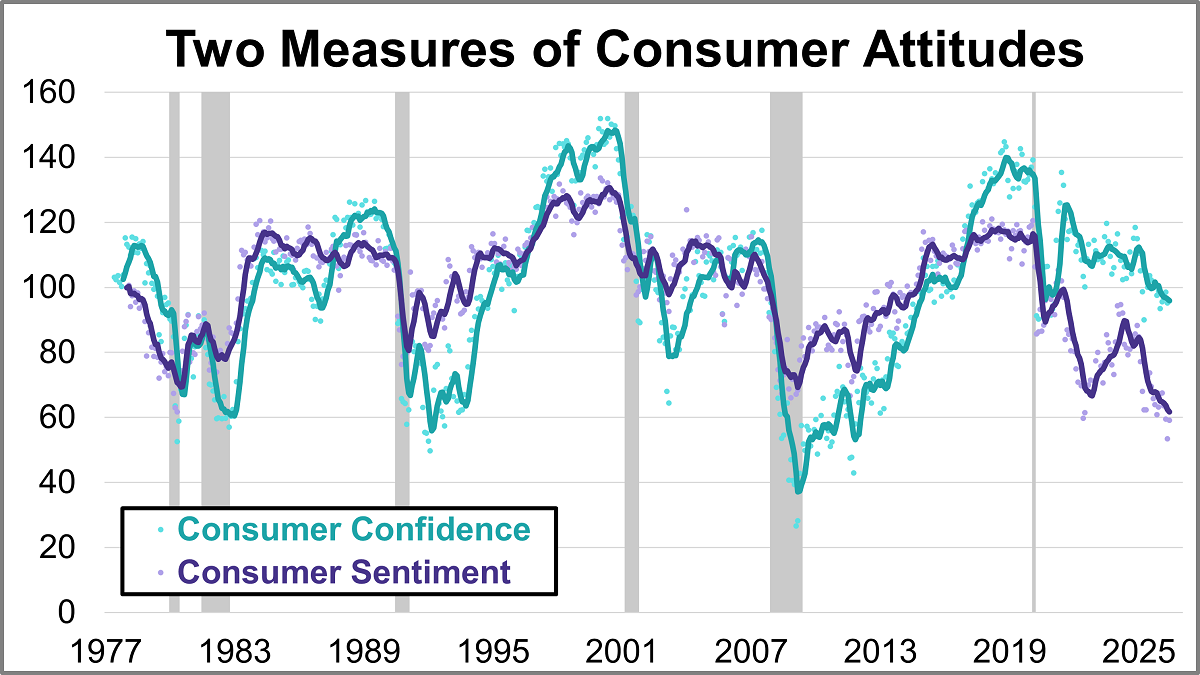
What are consumers thinking about the economy? Their collective mood offers crucial clues for businesses, investors, and policymakers alike. In June, the two leading benchmarks, the University of Michigan’s Consumer Sentiment Index (MCSI) and the Conference Board’s Consumer Confidence Index (CCI), offered similar views with both showing slight improvement despite ongoing inflation concerns.
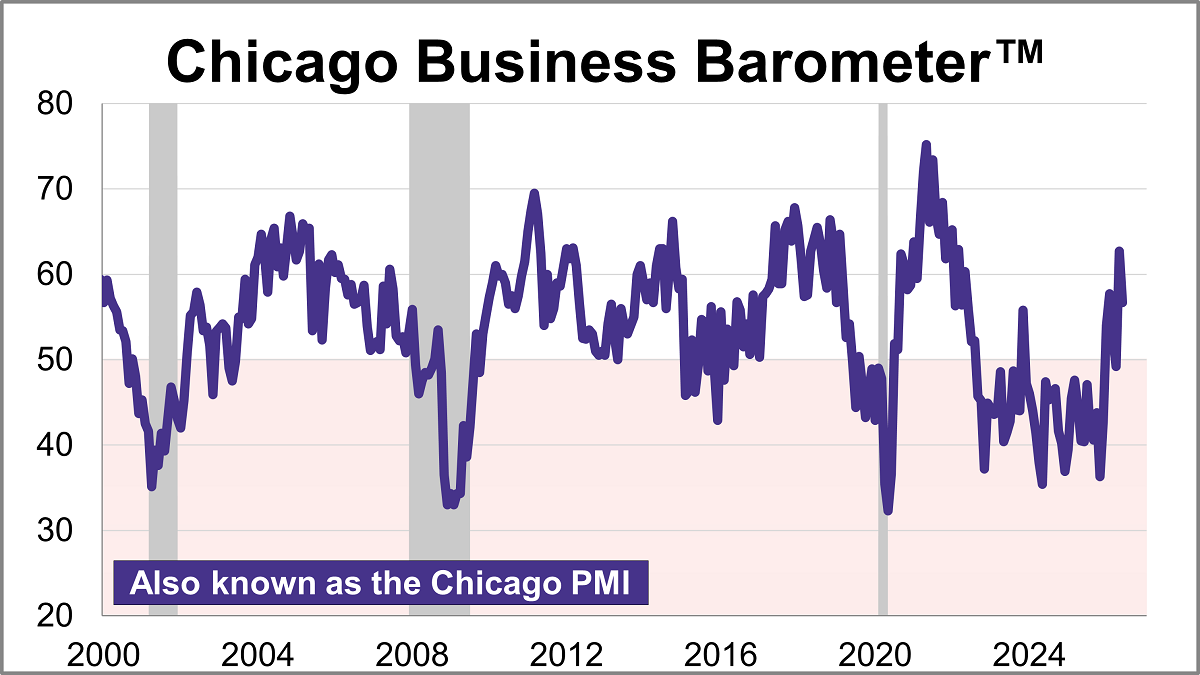
The Chicago Purchasing Managers’ Index cooled 6.0 points in June to 56.7, signaling an expansion in regional business activity for a second straight month. The latest reading was higher than the projected 55.7.
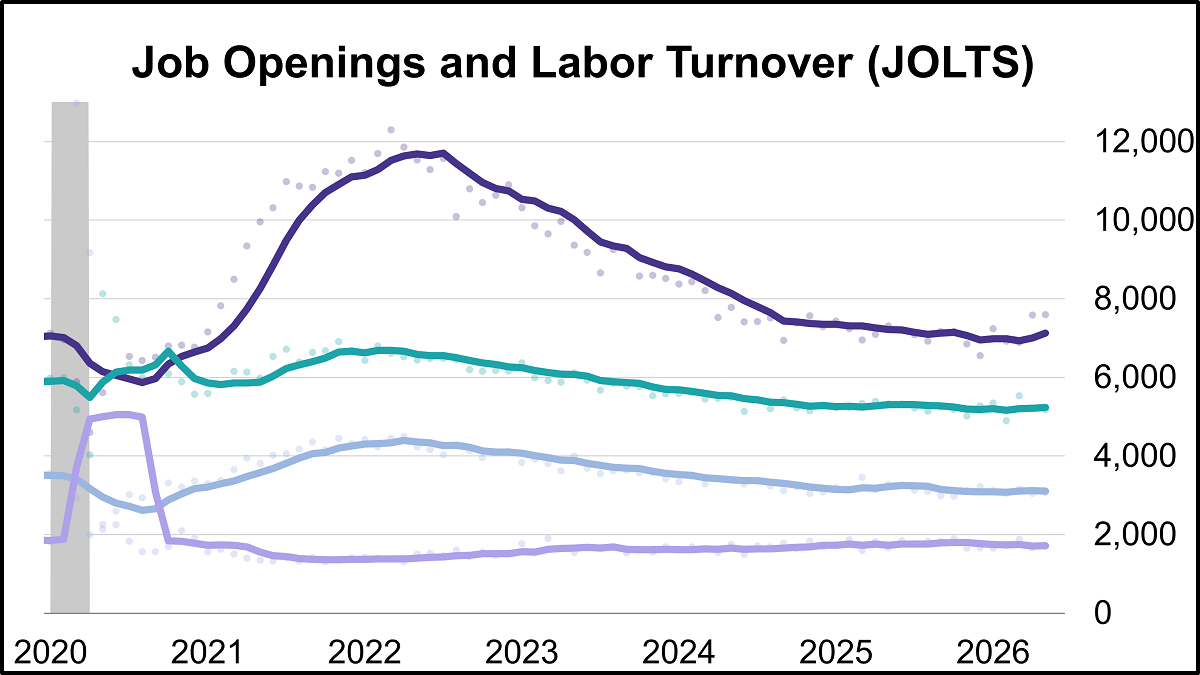
Job openings reached their highest level in two years in May, hitting 7.594 million vacancies according to the latest Job Openings and Labor Turnover Survey (JOLTS). The latest reading was higher than the projected 7.280 million openings.
The top 10 active ETFs YTD by fund flows show some intriguing trends and successful names that may pique the interest.