Manufacturing activity grew significantly in New York State, according to the Empire State Manufacturing July survey. The diffusion index for General Business Conditions remained in positive territory for a fourth straight month, jumping 9.9 points to 15.6 and coming in above the 9.3 forecast.
ACTIVITY STRENGTHENS
Manufacturing activity grew significantly in New York State in July. The general business conditions index came in at 15.6, up ten points from June. The new orders index climbed nineteen points to 22.2, and the shipments index rose sixteen points to 24.4–a four-year high–pointing to marked increases in orders and shipments. Unfilled orders and inventories rose slightly. The delivery times index edged up to 13.0, suggesting that delivery times continued to lengthen. The supply availability index remained negative at -10.0, pointing to worsening supply availability.
EMPLOYMENT EXPANDS FURTHER
The index for number of employees rose two points to 11.4, its highest reading since December 2022, and the average workweek index came in at 2.8, suggesting an increase in both employment and hours worked for a sixth consecutive month. The pace of price increases remained elevated, but the prices paid index declined nine points to 52.3, and the prices received index dipped four points to 27.6, suggesting that the pace of price increases slowed slightly after particularly sharp increases in May and June.
Background on the Empire State Manufacturing Survey
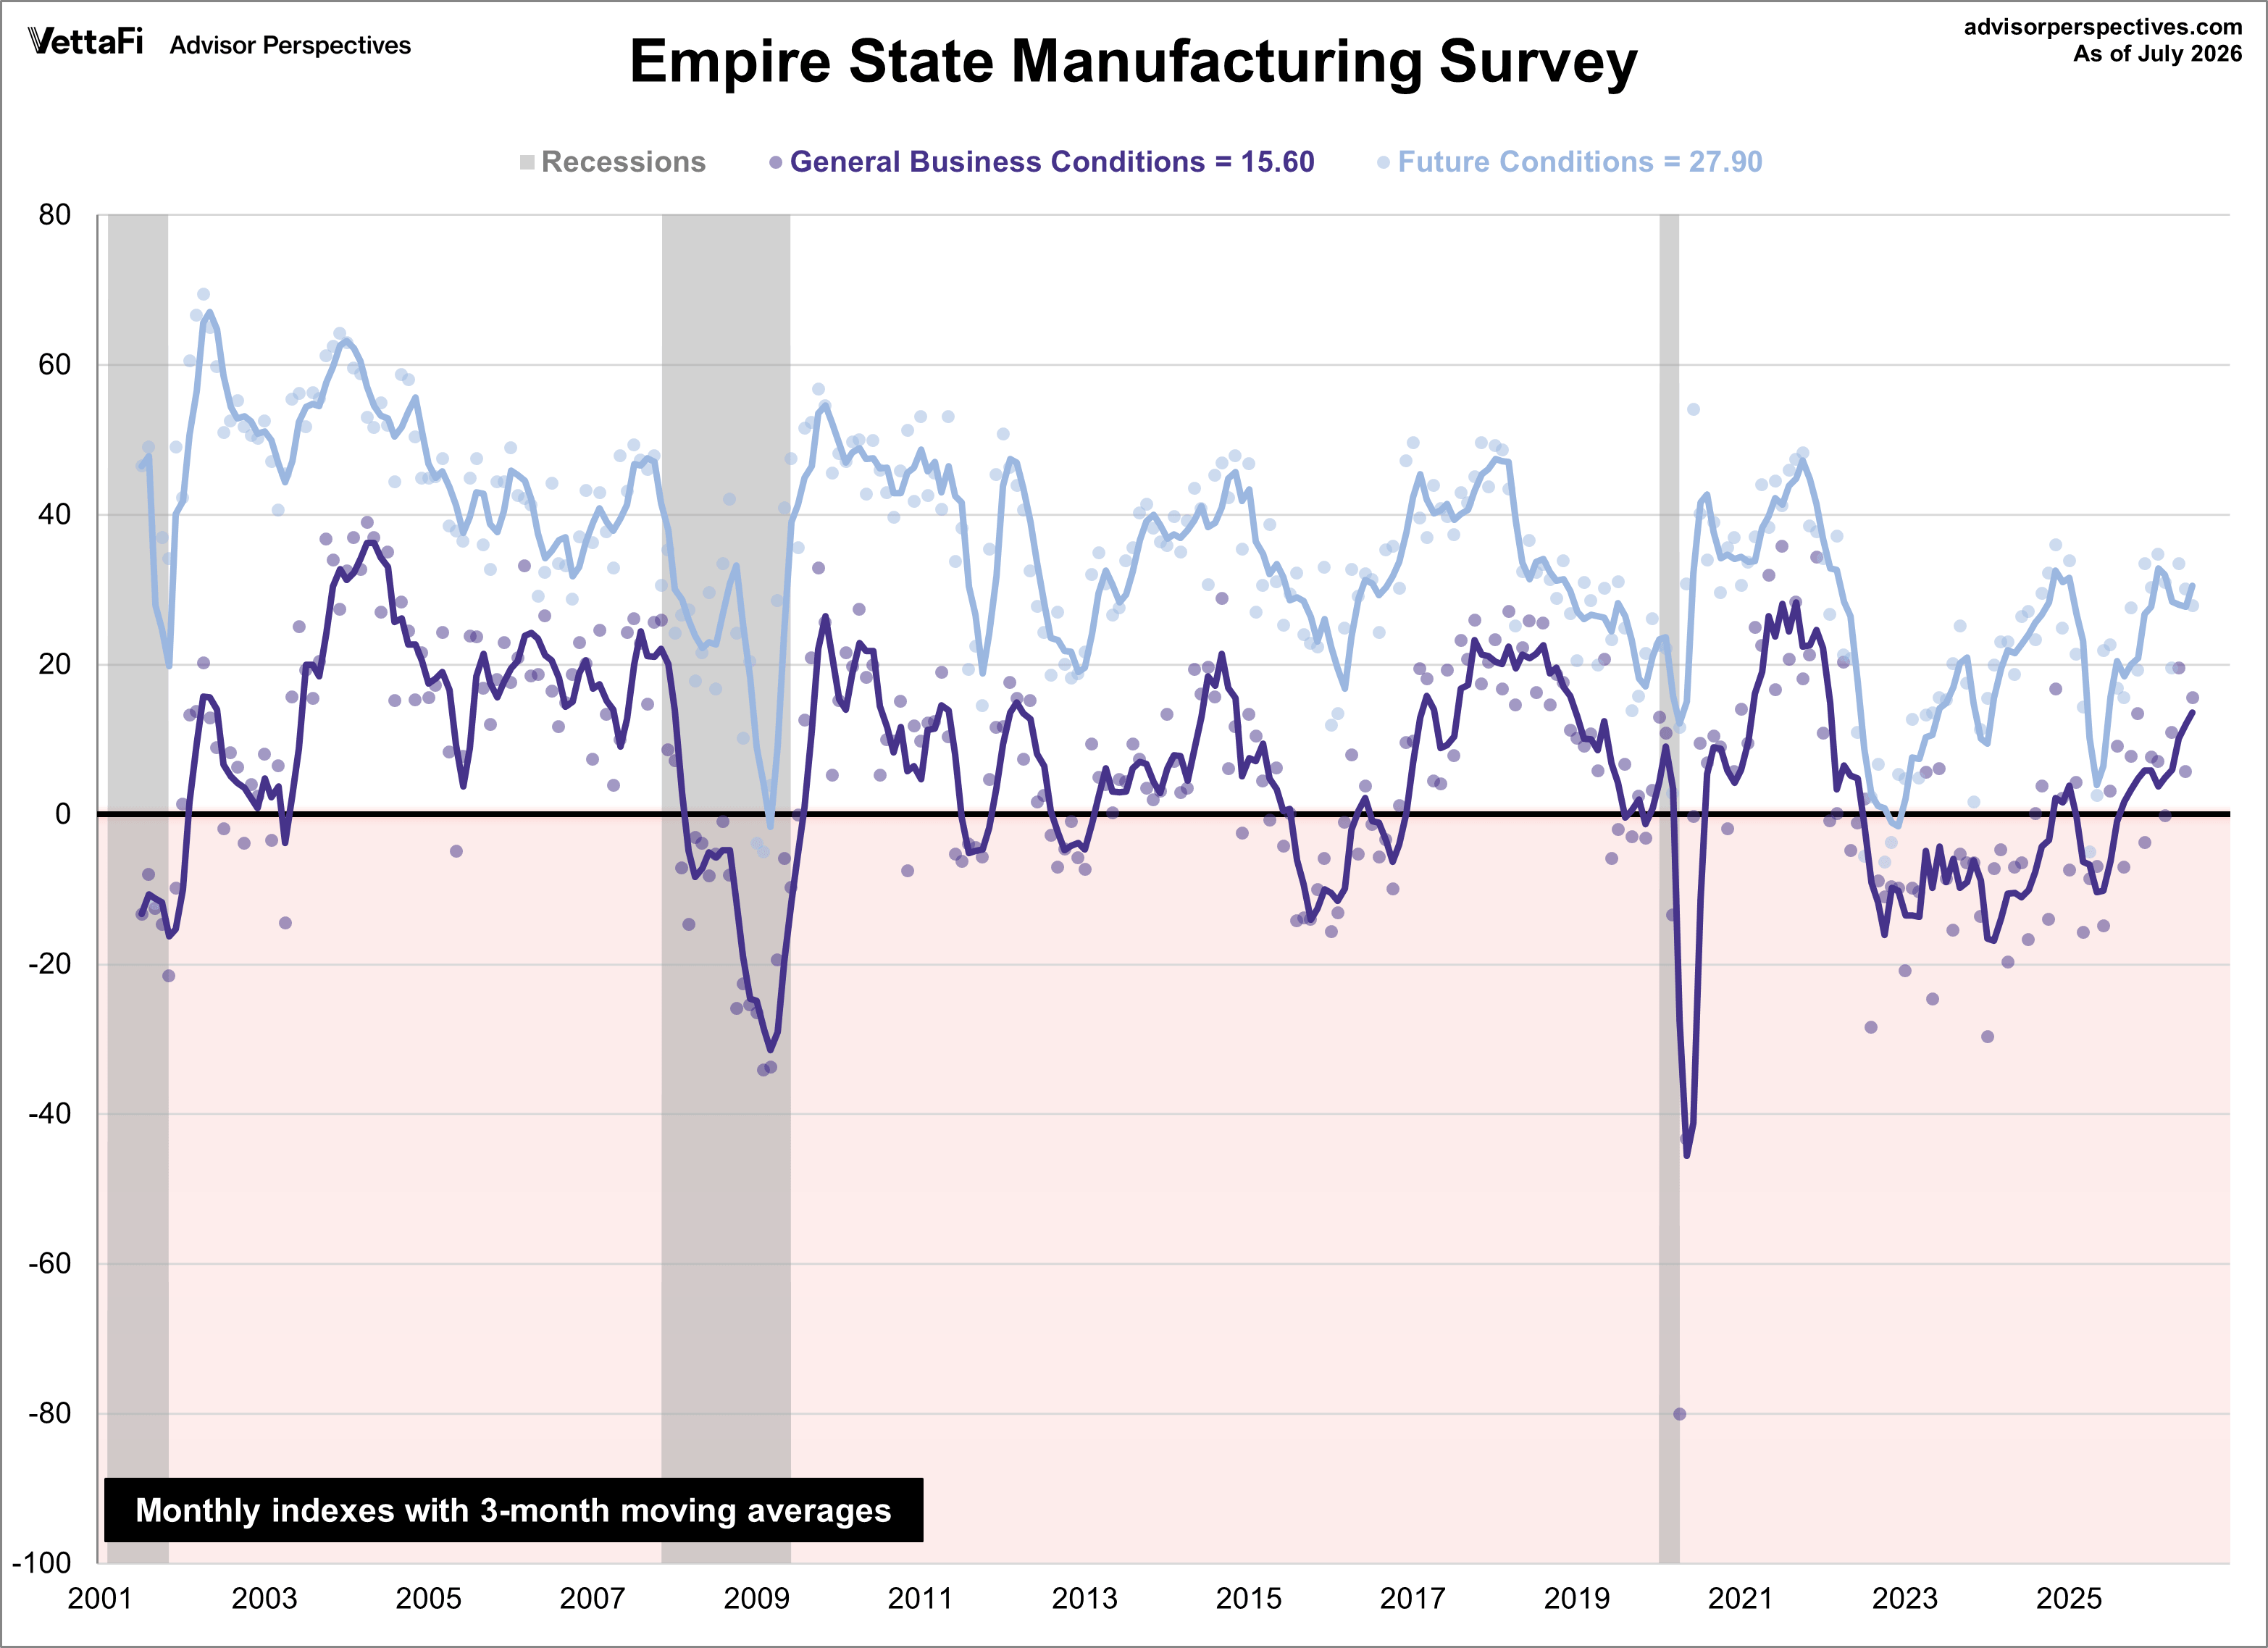
The Empire State Manufacturing Index rates the relative level of general business conditions in New York state. A level above 0.0 indicates improving conditions, and below indicates worsening conditions. The reading is compiled from a survey of about 200 manufacturers in New York state.
Below is a chart of the current conditions and its 3-month moving average, which helps clarify the trend for this extremely volatile indicator. The current 3-month moving average stands at 13.6, the eleventh consecutive positive reading and highest level since February 2022.
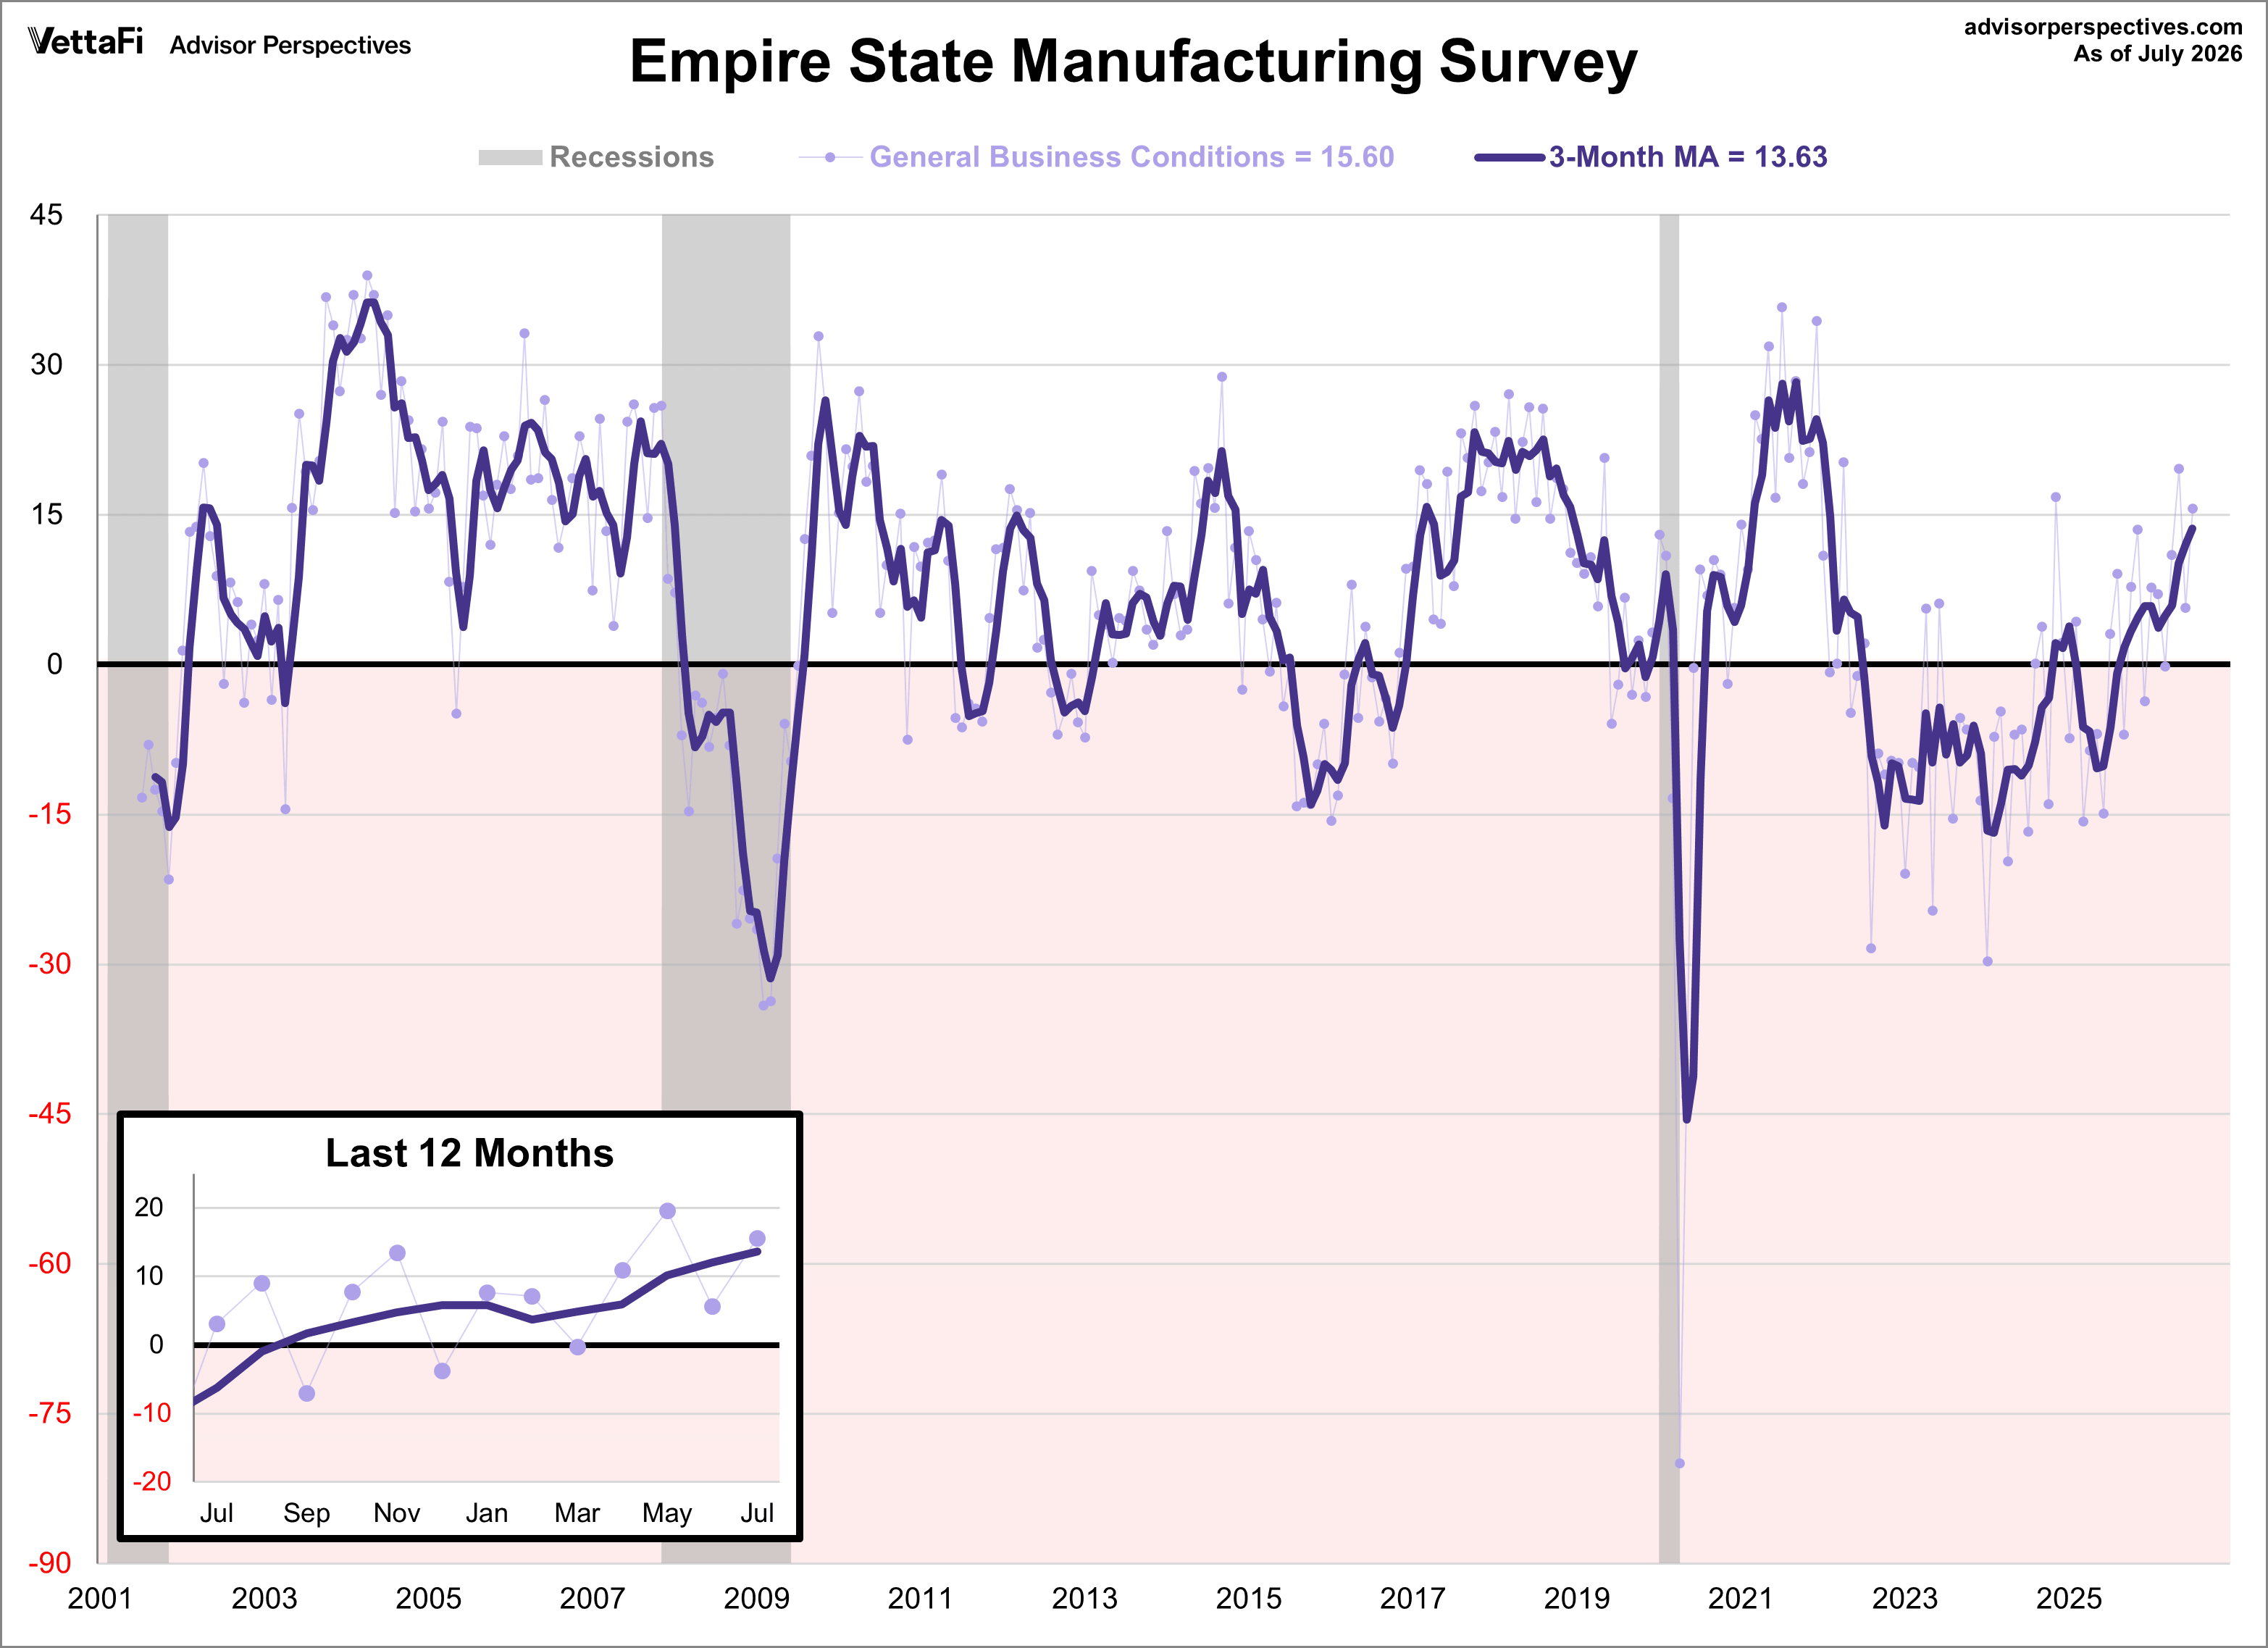
Since this survey only goes back to July of 2001, we only have two complete business cycles with which to evaluate its usefulness as an indicator for the broader economy. Following the Great Recession, the index has slipped into contraction multiple times, as the general trend slowed. We saw a gradual decline in 2015 that rose back up in 2016, with a giant dip in 2020 due to COVID-19. The index quickly picked up again in 2021, declined for 2022, and gradually rose in 2023. The index kicked off 2024 with a sharp decline but rose during the back half of the year, reaching positive territory for the first time in over 2.5 years. Similarly, the index dropped into negative territory at the start of 2025 but crawled its way into positive territory starting in August.