Understanding why investor optimism wins over a full market cycle is one of the most underrated edges an investor can own, and it has almost nothing to do with waving pom-poms.
A number has been making the rounds all year, and it’s misleading. The claim: roughly 13% of credit card balances are 90 days or more past due, the worst since 2008. Here’s the twist. That number is real, and it comes straight from the New York Fed.
This has been an incredible year in that Wall Street has spent all of it raising its earnings estimates, and the second-quarter season only accelerated the trend. Analysts began the year expecting S&P 500 earnings to grow about 15%.
The K-shaped economy is real, and it is old. What changed isn’t the shape of the economy; it’s just that the media found a narrative that gets lots of clicks and views, and we let headlines do our thinking for us.
In our final chapter for this series, we will dig into that exact question. Unfortunately, there is good and bad news, and it can be summed up in a single sentence.
Every few months, a new essay declares that the US debt trap has finally sprung. The latest one making the rounds from The Economist is well written and genuinely unsettling. It argues that Washington has borrowed so recklessly that the Federal Reserve no longer dares to raise interest rates. Doing so, the piece warns, would detonate the whole structure and send financing costs spiraling out of control.
Chapter 3 of this series ended with a simple question. If the math so plainly says avoid big losses, respect valuations, and mind your timing, why does so much of the industry preach the opposite?
Before I discuss why I disagree with the “AI bears,” I want to state that I respect their opinions, have evaluated their concerns, and have simply derived a different set of conclusions. That is an important statement, because this particular group of “AI bears” includes some of the sharpest risk minds in the business, and they have been early to almost every warning that later mattered.
The first two articles in this series were about behavior. This one is about arithmetic. There are three numbers that decide most of your investing life. Let’s do the math Wall Street skips, one number at a time.
The appeal of democratic socialism is real because the pain it speaks to is real. I won’t pretend otherwise. But intentions are not outcomes, and history has handed us the outcomes in ink, from Caracas to the old Soviet bloc to the Nordic countries that quietly kept their capitalism. The promise is a beautiful cake. The aftertaste is shortages, capital flight, inflation, and a new elite standing where the old one used to be.
In the first part of this series, I promised that the next enemy we would face is the one you cannot fire, mute, or unfollow, because it is “You.” You can learn every valuation metric ever invented, memorize the two questions that decide everything, and still hand most of your returns back to the market for one simple reason.
The debt problem is real. It just isn’t a bomb. As we’ve written before, the debt and deficit problem isn’t what you think. It’s a tax on future growth, collected slowly, and normal interest rates are simply the price of money doing its job, not the crisis the headlines keep selling.
“Think Like An Investor” is chapter 1 of a 5-part series examining the narratives around “investing for the long run. Learning to think like an investor rather than a speculator is not a personality quirk or a matter of taste. It is the entire game, and the good news is that it is a skill you can actually build, starting today.
So let’s do the work the timeline skips, starting with separating what actually happened from what the narrative needs you to believe. Then we’ll ask the only question that pays: should any of it change how you’re positioned this morning?
Earnings drive market corrections. That’s the finding, and the next serious decline won’t arrive with a headline about capital spending or the deficit but will begin exactly where all eight of the others began, in the profit cycle, surfacing in credit spreads and revision breadth well before it reaches any earnings report you can actually read.
“Sound money,” in its purest form, is money whose supply a government cannot expand at will. Under a gold standard, every dollar is a claim on a fixed weight of gold. You can’t print gold. So the government can’t monetize its deficits, and the money supply grows only as fast as miners pull metal out of the ground, historically around 1.5% a year.
Lately, it seems like you can’t open a financial publication without stumbling across another article declaring the 60/40 portfolio dead. The pitch is everywhere: bonds are broken, the old rules no longer apply, and investors should modernize by swapping the bonds in their portfolio for Bitcoin, gold, or whatever alternative the asset management industry is currently selling.
The AI bear case is worth taking seriously on price and financing. It is not worth taking seriously on demand. Anyone selling you the whole package as a single story, bull or bear, is selling you a mood, not an analysis. The revenue is real. The cash flow is the thing to watch. Price accordingly.
If you own treasuries, you need to make two separate decisions rather than one blended bet. The liquidity sleeve holds the bill exposure and does the work people mistakenly ask the long end to do. The duration sleeve stays deliberately small, sized as recession insurance rather than as a conviction call on falling inflation.
The second-quarter earnings season is in full swing. So far, the results are landing in line or better than the upwardly revised Wall Street estimates. That’s the opposite of how this usually works. Analysts normally trim their forecasts as a year wears on. In 2026, they’ve done the opposite.
When you measure home affordability today against the metric that actually governs the check you write each month, the picture flips. By that measure, buying a home may be easier now than it was for the Boomers and Gen Xers who get blamed for everything.
Decades of data across global markets reach the same verdict: the more frequently retail traders trade, the worse they perform. The infrastructure has never been more inviting. The losses have never been more documented. Here are some key statistics we will dive into further.
If you knew you were standing inside a stock market bubble, you wouldn’t be standing in it for long. You’d sell. So would I, and so would everyone reading this. And if spotting market bubbles was something everyone could do in real time, the bubble couldn’t form in the first place.
The AI capex risk profile has gotten sharper since then, and the argument needs tightening in a few places. The bull case and the tail risk are now the same buildout, but they are running in different directions.
Rising prices increase the value of collateral in every margin account, which automatically increases how much each investor can borrow under Reg T. Debt rises BECAUSE the market rose, not the reverse. That single fact is what breaks the ratios we’re about to examine, and it lies at the core of why margin debt risk is so often misjudged.
Wage growth peaked four years ago. Since 1985, it has led CPI by three to seventeen months in every single cycle. The May 4.2% inflation print is the noise. Watch the wages.
The money is REAL. The question was never whether it exists. It’s who’s spending it, and what they borrowed to do it. When the wall of cash and the bottom half finally commit to risk at the same moment the Fed turns hawkish, that’s not the start of something. That’s the part of the cycle where the careful investor gets paid to be careful.
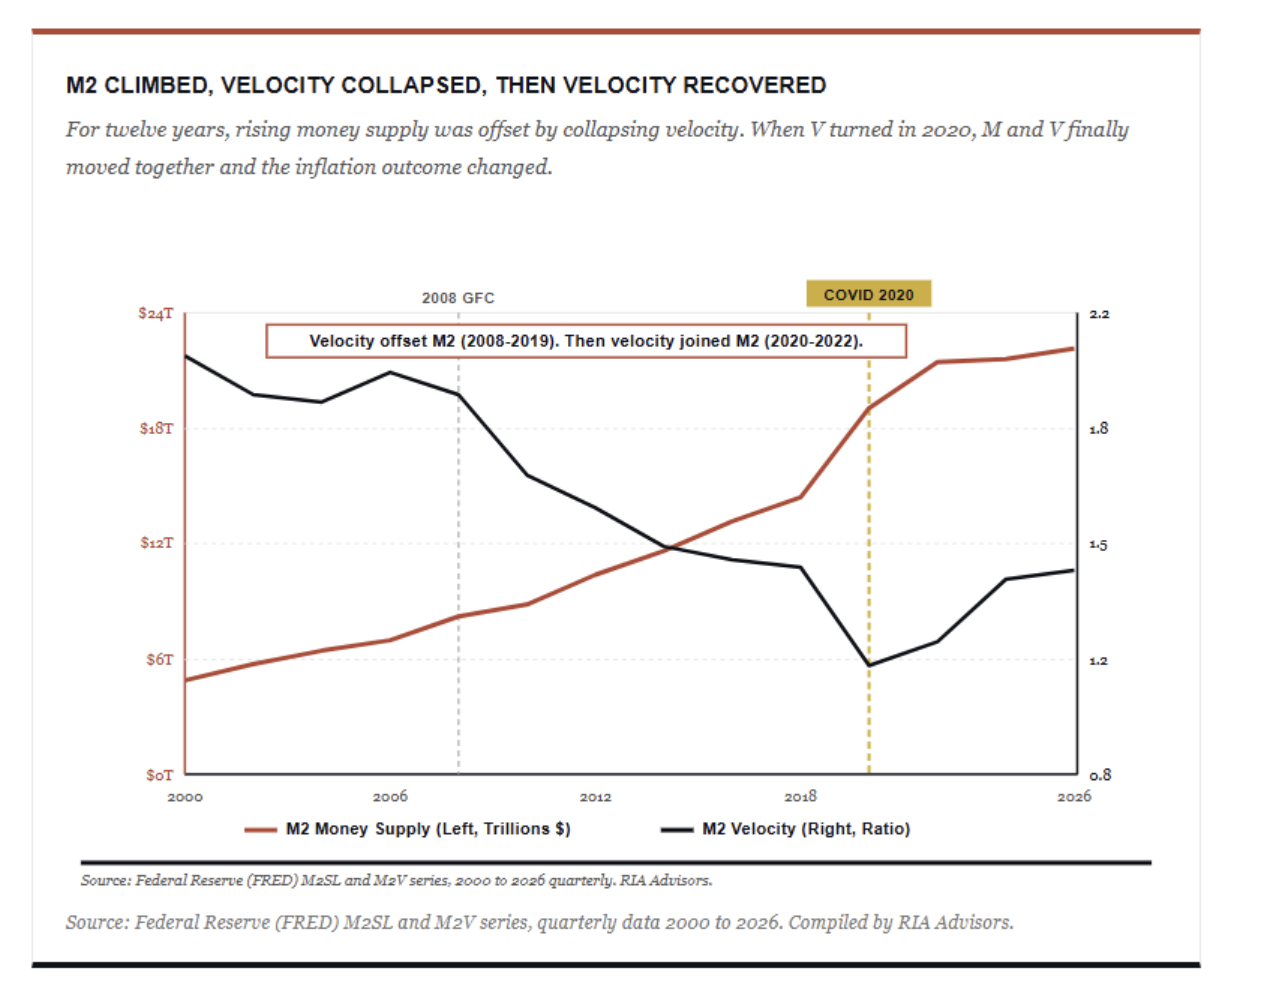
Friedman was reasoning from the equation of exchange, MV = PQ. Money times velocity equals prices times real output. It’s an identity, not a theory. Where it gets interesting is when you ask which variable does the work.
Here’s the setup most investors are underrating right now. Over the next two weeks, the tape will trade on plumbing rather than fundamentals. We just cleared the largest options expiration in history. Quarter-end pension selling comes next, and then July 1 reopens the passive-money firehose into a market that already routes forty cents of every S&P 500 dollar into ten stocks.
Start with the disconnect itself. If you only looked at the Michigan headline, you’d assume the country was in a depression. However, when you look at what people are actually doing, the picture changes completely.
The catalyst that turns a healthy pullback into something deeper won’t be a single oil-soaked CPI print. It’ll be the moment forward earnings expectations start to roll over while valuations sit at the high end of history. We aren’t there yet.
The K-shaped economy has become shorthand for a tidy story. The rich pull away while everyone else falls behind. It fits the mood, and it makes for a sharp headline. The problem is that it’s mostly wrong.
This past week, the market hit an all-time high. At the same time, Alphabet (GOOG) told investors it would raise $80 billion by selling stock to fund its AI buildout, and the shares fell about 4% on the news.
In Part 1, we explored why Dollar Dominance Remains Alive and Well. Today, we will explore the stronger-dollar trade, the one macro trade that nobody is sized for.
Reducing equity exposure during periods of elevated risk is not the same as market timing. The financial industry has spend decades blurring that distinction.
The dollar is supposed to be dying. We’ve heard that argument for the better part of a decade, and it’s getting louder, not quieter. Dollar dominance isn’t fading. In fact, the events of late April 2026 just delivered the loudest counter-signal in years.
After three decades of watching market cycles play out from both sides of the trade, I’ve come to a simple conclusion: Wall Street’s love of simple rules is one of the most dangerous aspects of investing.
Last Friday closed with the 10-year Treasury yield at 4.60%, a one-year high, and the doom commentary about rising interest rates was waiting before the bell even rang. Hyperinflation. Bond market breakdown. Paradigm shift. A 1981 fair-value retest.
That Buffett cash hoard has also created a lot of speculation, innuendo, and assumptions, which is what I want to walk through in today’s discussion. Primarily, what that cash hoard actually represents, the popular theories explaining it, and what it really costs shareholders to hold.
The stagflation narrative dominating financial social media isn’t completely wrong. That’s what makes it so dangerous. After more than 30 years of managing client portfolios through actual inflationary cycles, not watching them on YouTube, I’ve learned that the most damaging investment advice isn’t built on outright lies.
A real fundamental story doesn’t require a parabolic chart to validate it. In fact, fundamentals tend to drag prices up the trend line, not push them through the ceiling. When a “shortage” narrative arrives at the same moment that the worst-quality names in the sector are leading the index higher, that’s not fundamentals at work.
That skepticism isn’t contrarianism for its own sake, but rather the recognition that when a thesis achieves consensus, the crowd has usually already priced the easy part of the move, and the hard part is what comes next.
The S&P 500 hit a fresh record high last week. The median stock in the index is sitting 13% below its 52-week peak. That divergence is not a footnote or a curiosity.
Robots are coming to the economy. It is inevitable, really, and there is nothing that will stop it. At some point in the not-so-distant future, robots will infiltrate every aspect of our lives, from office work and manufacturing to service work and trade skills, and even your home. Here are some numbers for you.
Here’s where I want to start, because this is the point that almost every government debt analysis, including the article we’re responding to, completely ignores. Government debt doesn’t disappear into a void. By definition, if the Government borrows capital from someone, that capital must flow somewhere.
As of this writing, the Strait of Hormuz remains effectively closed since February 28. Roughly 20% of the world’s seaborne oil stopped moving through the chokepoint. T
The stock market selloff between February 28 and April 14 produced one of the more instructive market lessons in recent memory. It isn’t because of what the market did, but because of what investors did in response.
The BLS jobs report has become so distorted that it often tells us almost nothing reliable about the actual state of employment. I realize that is a serious claim, but let me back it up with the data. I want to show you what I believe is a simpler, more honest alternative.
Over the last few weeks, we have published real-time market commentary as the correction proceeded. The goal was to help investors navigate the more dire outcomes promoted on social media. A largely unexpected outcome was that the S&P 500 outlook changed dramatically in a matter of days.
That article digs into the plumbing behind oil shocks and recession, and exposes why, over the years, I’ve learned to distrust the loudest voices in the room.