The Road Up and the Road Down are the Very Same Road
Membership required
Membership is now required to use this feature. To learn more:
View Membership Benefits
Do not rest your understanding on my words; listen to the nature of reality itself. Wisdom is to recognize that all things are one. People fail to see how what pulls in opposite directions is nevertheless in harmony with itself – like the opposing tensions of the bow and the lyre. The road up and the road down are the very same road.
– Heraclitus, Fragments (50,51,60), 500 BCE
We often have the impression that this or that exists by itself alone. We see, for example, a $40 trillion Federal debt, record corporate profits, the most extreme stock market valuations in history, a mountain of so-called “cash on the sidelines”, a massive AI buildout, and the emergence of trillionaires amid growing economic challenges among working families. In order to discuss any of them well, it helps to recognize that all of them are different aspects of a single unbroken dynamic. Choose any single topic for discussion, and it becomes a door to all of them. We may be tempted to think, “oh, I’ve seen this before”, but the truth is that the deeper we look even into one thing, the more we can learn about everything else.
Heraclitus and the Buddha lived about the same time, one on the coast of the Aegean sea, and the other in modern-day India, along the Ganges and Niranjana rivers – both coming to the same realization “Wisdom is to recognize that all things are one.”
When we pursue what we think of as desirable outcomes, but discover that we somehow can’t stamp out dysfunctional outcomes elsewhere, whether in the economy, in society, or in our daily lives, it’s often because the two outcomes are the opposite sides of a single equilibrium; the dysfunctional outcomes may be the natural response of some part of the system we haven’t fully considered.
As a simple example, suppose that everyone in the economy tries to save more without considering the impact of their behavior on the overall economic system, and without any accompanying increase in real investment (housing, factories, capital expenditures). The result of our intended thrift may be that spending falls, income declines, and the economy contracts to the point where total savings fall as well. Keynes described this as the “paradox of thrift.” As a side note, while Keynes’ solution was to counter the recession by increasing government spending – essentially offsetting the attempted saving with an equivalent deficit, one could also support output by, for example, directly encouraging greater investment through temporary investment tax credits.
Suppose that economic policies and monetary responses constantly operate to suppress volatility and interest rates, in the hope of prolonging economic growth. The result may be a kind of false prosperity where leverage and risk-taking increases, while new types of securities emerge to enable new loans and offer investors a “pickup” in yield, all encouraged by the appearance of safety. As a result, the economic system may become progressively more fragile. Hyman Minsky developed this “financial instability hypothesis” after studying the Panic of 1907 and the Great Depression. Many later financial crises, including the global financial crisis and quite possibly the current bubble, have similar roots.
Beyond the speculative risks encouraged by years of fiscal and monetary stick-saves, unintended consequences can emerge from policies that only consider one “side” of the economy. If, for example, corporate strategies and economic policies are singularly focused on maximizing profits, reducing taxes on the wealthiest individuals, and cutting benefits for the most vulnerable among us, we shouldn’t imagine that the resulting “K-shaped” economy has come from nowhere. An economy that prospers at the top, struggles at the bottom, and runs massive government deficits to bridge the gap is the predicable outcome of deliberate policy choices.
The basic mistake is to treat ourselves and others, our decisions and their decisions, our situation and their situation, as wholly separate entities. We gain clarity when we begin to recognize the interdependent nature of things. That’s true not only in economics and finance, but in every other aspect of life.
Suppose that in our efforts to maximize our wealth, we amplify the lack of others, commandeer foreign resources as if they were our own, and exploit cheap foreign labor while drastically reducing foreign and humanitarian aid. If our lens is narrow, we may become indifferent to poverty in other nations and homelessness in our own. We may see situations like poor education, desperation, crime, and the attempts of others to find a better life by immigrating here. We may even come to hate them, not considering that our kind of love for the things we love may have contributed to their situation.
The things we think we hate may not be separate from the things we love; the things we love may not be separate from the things we hate. Seeing that this is because that is, we can widen our lens, and do better with all of them.
The road up and the road down are the very same road
Let’s begin our tour at a familiar spot. The sum of all deficits and surpluses in the economy must add to zero. If one sector runs a surplus, where its income exceeds its consumption and net investment, it must be true that the other sectors have run a deficit, where their consumption and net investment exceeds their income. This isn’t a theory or an opinion, it’s just arithmetic – an accounting identity.
In equilibrium, the people and sectors that enjoy a surplus end up owning new securities as assets. In equilibrium, the people and sectors that run a deficit end up issuing new securities as liabilities. They are exactly the same securities. When we say that the government owes $40 trillion dollars in liabilities, we also have to remember that the same $40 trillion is held by someone as securities that they call assets.
Some surpluses and deficits may be perfectly healthy. For example, most households obtain mortgage loans to buy houses that they would not be able to purchase with their current income. Meanwhile, other households may have members who have saved for retirement, and some of those savings take the form of bank deposits or mortgage securities. The deposits and securities are assets that memorialize the fact that their savings were intermediated to someone else, directly or indirectly, in order to buy their homes.
In contrast, the balance of deficits and surpluses can become lopsided, dysfunctional, and increasingly fragile if the “objective function” of an economic system becomes singularly focused on maximizing the prosperity of one group without taking full account of the feedback effects elsewhere.
Whenever we talk about ‘maximizing’ something, whether profits, or GDP, or expected returns, or the well-being of ourselves, our communities, or the world, we implicitly or explicitly create an ‘objective function’ that takes certain inputs, like X1, X2 and so on, and converts them into the resulting thing, Y, that will make us happy.
We should be careful about how we create our objective functions, for two reasons. One is that whatever we don’t include in our definition of happiness, and give zero weight, will be treated only as a means to our own happiness. We may then exploit or even destroy those things as long as they contribute to our pursuit. That leads to the second reason we need to be careful: there are often unobserved ‘feedback effects’ from one variable to another. If we choose our objective function carelessly, we can actually harm ourselves.
– John P. Hussman, Ph.D., Equilibrium and the Dentist in Poughkeepsie, March 202
The chart below offers an updated view of what a lopsided economic equilibrium looks like. The line at top is shows the surplus of the corporate sector: corporate earnings less net business investment. Given that 87% of corporate equities are held by the wealthiest 10% of the economy, I’ve left dividends in this line. In a real sense, it’s a proxy for how the wealthiest Americans are doing. The red line at bottom is the mirror image, aside from a few minor elements (FRED only allows 15 data series), and shows the combined deficit of U.S. households, government, and foreign trading partners. Since foreign trading partners actually run a moderate net surplus, the spread between strictly domestic sectors is even more extreme.
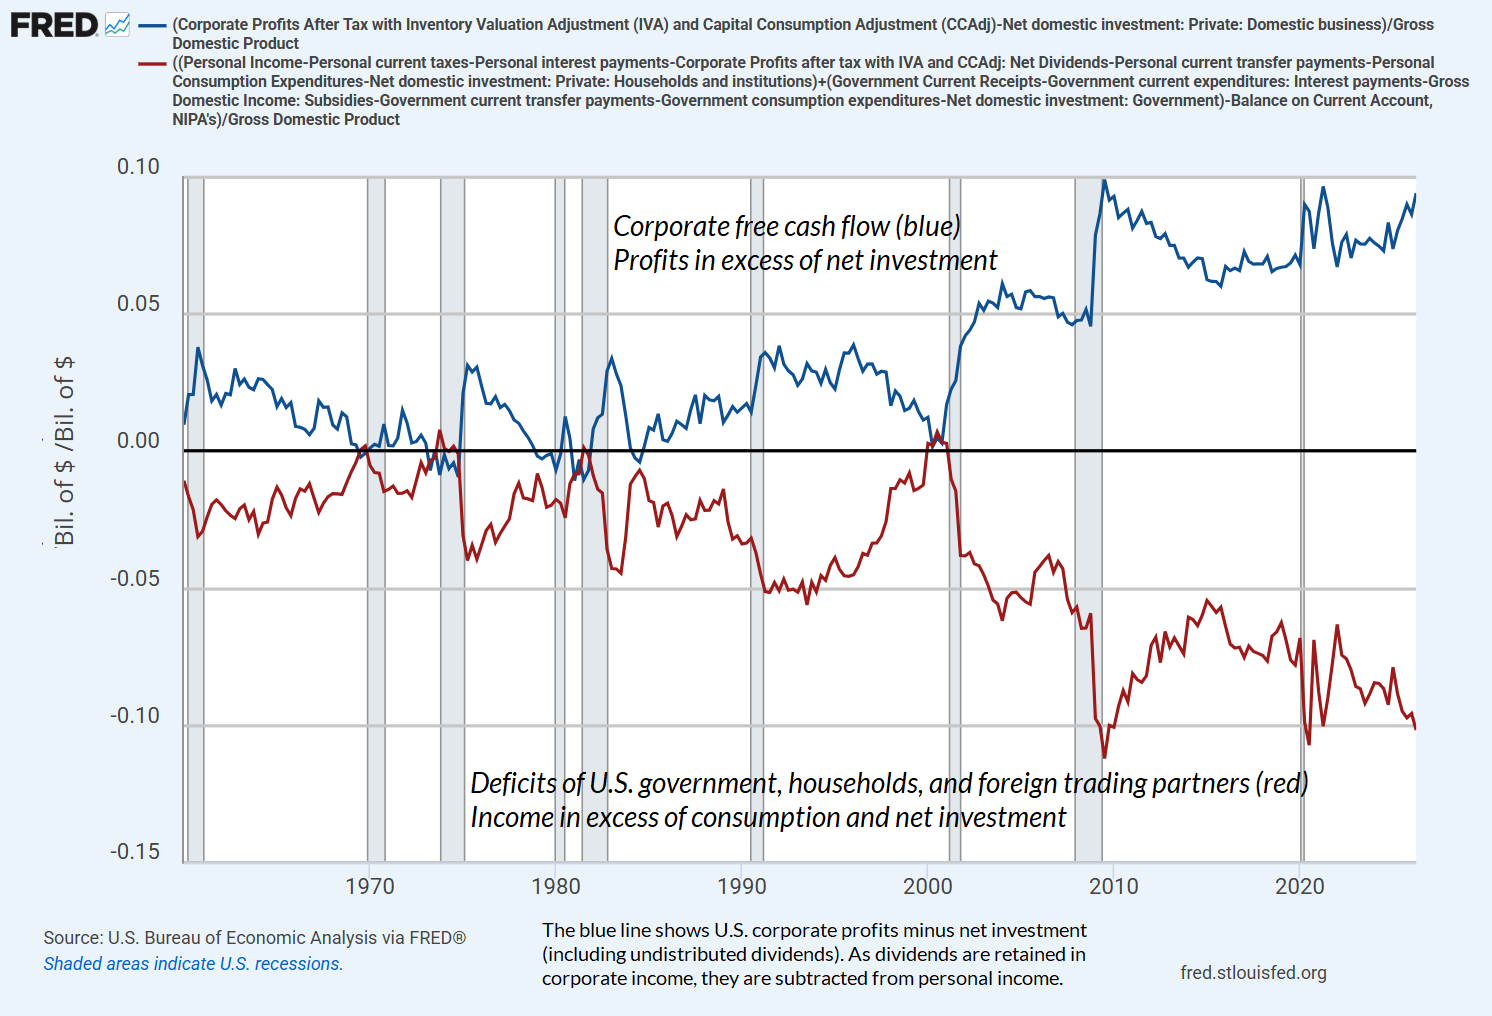
Seeing that the unprecedented prosperity of corporations as a share of GDP is the mirror image of unprecedented shortfalls and lack in other sectors of the economy, we may get an insight into the sustainability of current record profit margins. That doesn’t mean that margins need to normalize in the next few years, or even in the next decade. Yet because stocks are claims to corporate cash flows that extend into the indefinite future, we find across history that the most reliable valuation measures – those best correlated with actual subsequent S&P 500 total returns – are based on revenues or margin-adjusted earnings, rather than current or year-ahead earnings, which quietly assume that the profit margins of the moment will be permanent.
The chart below shows our most reliable gauge of market valuations in data since 1928: the ratio of nonfinancial market capitalization to gross value-added (MarketCap/GVA). Gross value-added is the sum of corporate revenues generated incrementally at each stage of production, so MarketCap/GVA might be reasonably be viewed as an economy-wide, apples-to-apples price/revenue multiple for U.S. nonfinancial corporations.
The recent record peak in mid-August was 4.3, exceeding both the 1929 and 200 extremes, and about four times the historical norm we associate with average subsequent 10-12 year S&P 500 total returns of about 10% annually, in market cycles since 1928.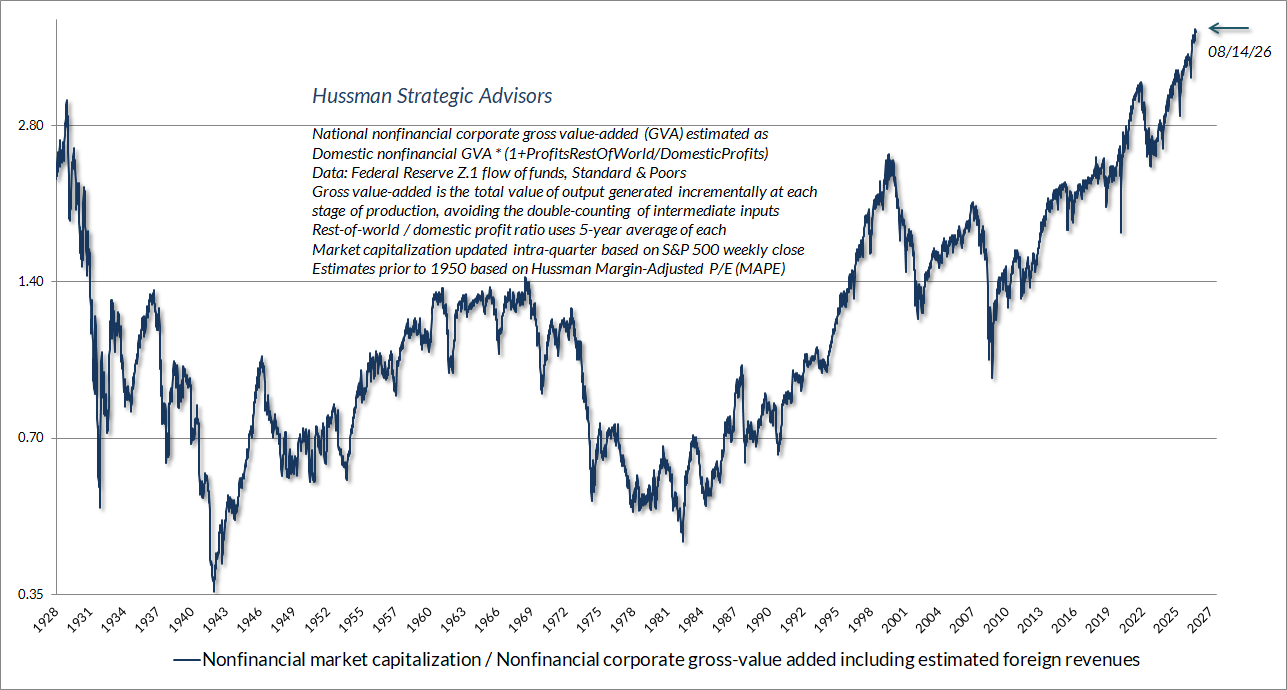
Our discipline has no requirement at all that valuations must revert to their historical norms, but because they have done so over the completion of most market cycles in history, it’s best to allow for that possibility – which currently implies potential downside risk on the order of 50-75% from current levels – even if we have zero intent of treating it as a forecast. Our (uncomfortably correct) market risk estimates from the 2000 and 2007 peaks (including an 83% loss estimate for tech stocks) were based on similar considerations. If you look deeply into a speculative bubble, you can already see the collapse. If you look deeply into a market collapse, you can already see the bull market. The road up and the road down are the very same road.
Assuming one takes current record profit margins at face value, relying on them to be permanent, the forward price-to-operating-earnings P/E for the S&P 500 is at levels historically associated with subsequent 10-12 year total returns in the low single digits. Still, investors can take current forward P/E multiples at face value only by straining credibility and dispensing with history.
The most aggressive compromise, in my view, is to assume that the average margins of the past decade will be permanent. I don’t actually recommend that compromise, but we can “fix” the largest outliers of recent years by adjusting MarketCap/GVA by the 10-year average nonfinancial profit margin, which gives us a MarketCap/GVA version of Robert Shiller’s Cyclically Adjusted P/E (CAPE).
The chart below shows the mapping between this adjusted measure, which I’ve dubbed GVA_PE10, and actual subsequent S&P 500 12-year average annual nominal total returns. The recent record high was 26, while the historical norm associated with subsequent 10% annual S&P 500 returns is less than 11. That comparison gives us a narrower baseline market risk estimate of a potential 58% loss from current levels over the completion of this market cycle.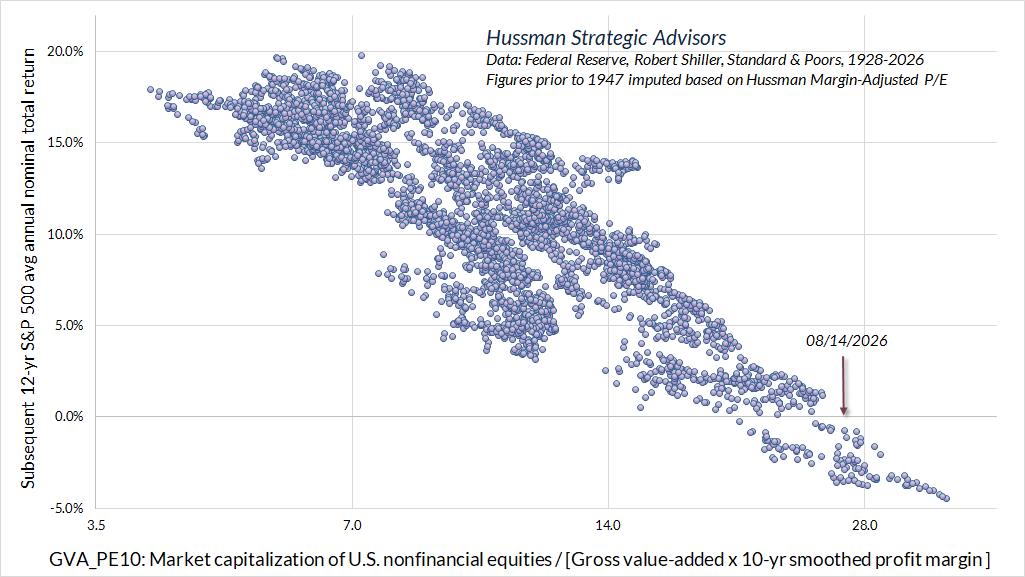
This is a good moment to emphasize, as usual, that while we view safety nets as obligatory at current extremes, nothing in our investment discipline relies on a retreat in market valuations, now or ever. More on that point in the final section of this comment.
On the boom in AI capital investment
The equilibrium between deficits and surpluses tells us a great deal about how the spike in investment spending on AI capacity has affected corporate profits. Notice that if the deficits of households and government, as a share of GDP, match historic extremes without breaking to fresh lows, the surplus of corporations (profits minus net investment), as a share of GDP, will also match historic extremes without breaking to fresh highs. This will be true even if corporations have embarked on an aggressive investment boom.
How can corporate profits – investment remain steady if investment is booming? What happens, in this case, is that corporate profits must expand to the same extent as the amount of investment. Some corporations will run smaller surpluses (profits minus net investment), and other corporations will run larger surpluses, with the net result that the investment spree will show up as someone’s profit. Accordingly, corporate profits themselves will boom, but the persistence of the boom in profits will necessarily rely on the persistence of the boom in investment spending. That’s essentially what we observe at the moment, and it’s important to realize that the recent surge to record profits is there because the investment boom is there. Here’s what corporate profits look like, as a share of GDP, without subtracting net investment.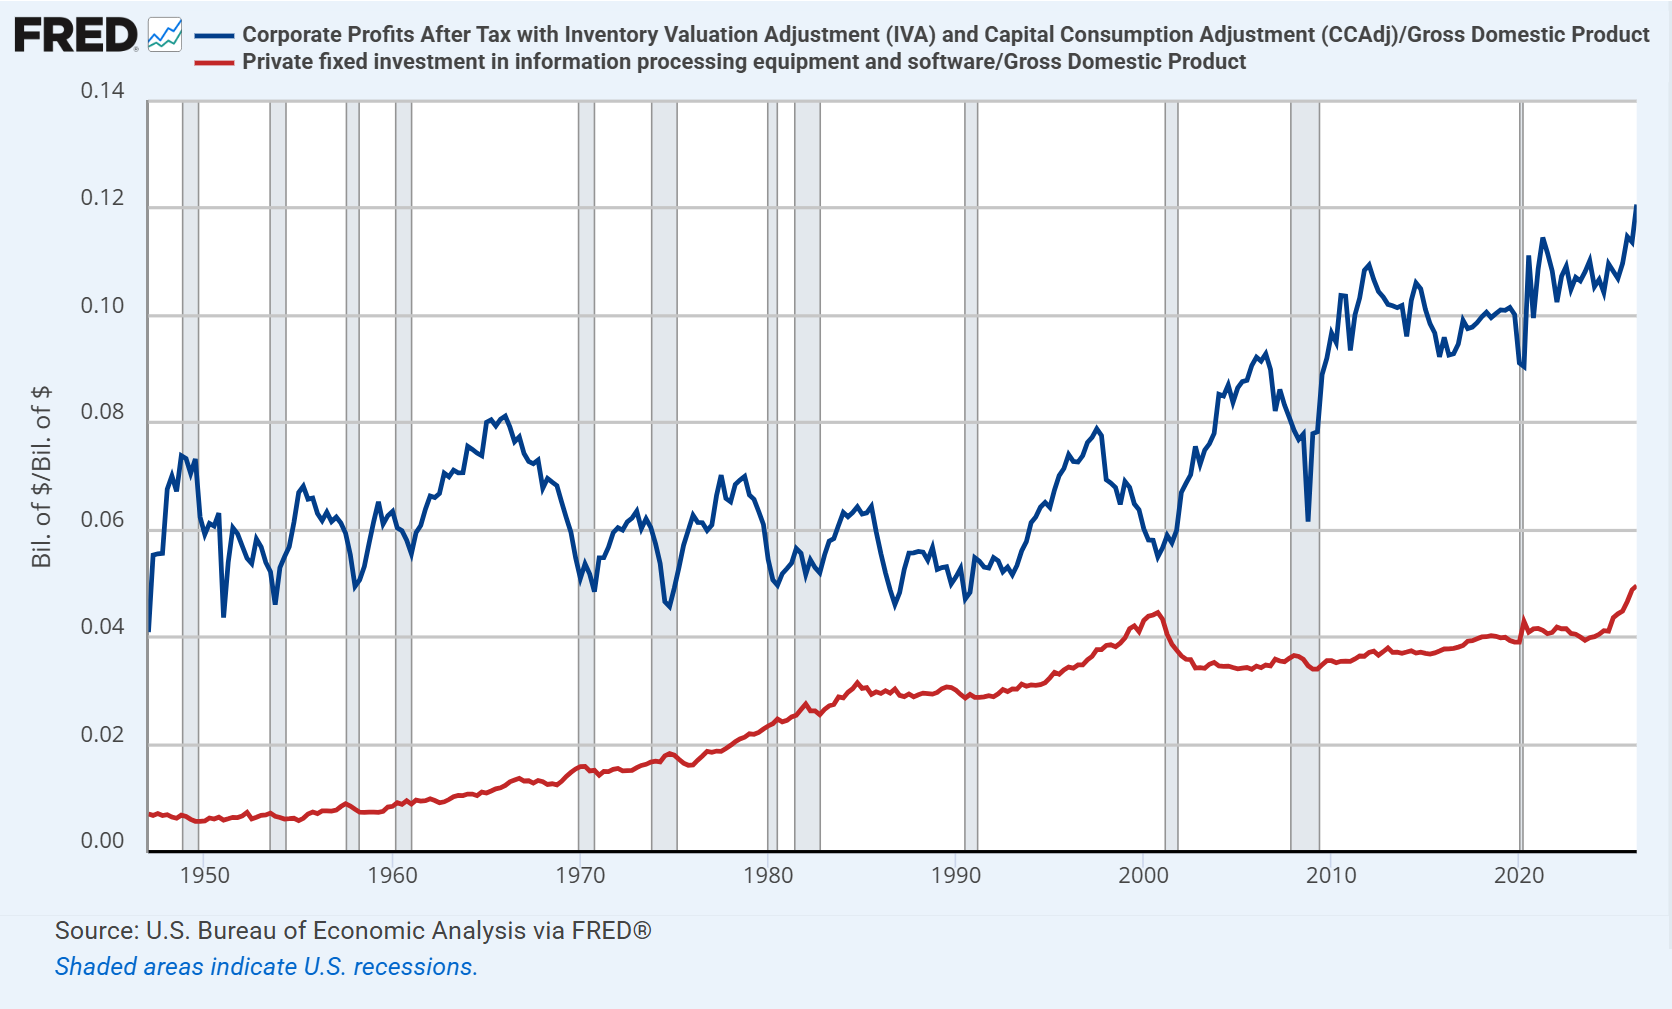
In recent weeks, we’ve heard projections of very long and sustained AI buildout, comparing this spending to the establishment of railroads and electrical grids, which progressed for decades. This analogy makes me wince a bit. Unlike railroads and electrical grids, AI expansion doesn’t need mile-by-mile linear expansion – the internet, fiber optic cables, cellular networks and the like are already fully functional. Instead, capital expenditures for AI are focused on expanding computing density at single points (more chips and memory in a given location). We’re not laying tracks and cables across the country. Equally important, once an AI model is trained, distributing it has nearly zero marginal cost aside from compute. Nobody needs to lay “AI pipe.”
My own impression is that the current AI buildout is closer to the internet buildout than we may be comfortable thinking about. The foundations of internet connectivity were established in the 1990’s, with a burst in the second half of the decade, and massive fiber-optic overexpansion near the peak of the bubble in 1999-2000. For stock market investors, that was the most glorious moment, even though more than 90% of global data capacity and internet scaling occurred after 2000. The foundations of modern internet, cloud, and streaming services were built on cheap, plentiful “dark fiber” that resulted from unprofitable overexpansion of capacity. Similarly, Cast AI recently analyzed utilization across 23,000 AI clusters and found that 95% of provisioned capacity is currently sitting idle.
Hyperscalers are still in the sweet spot of the AI investment boom because only a fraction of this investment operates as a deduction from reported or operating earnings. Meanwhile, many companies have been extending their depreciation schedules, which makes sense for solid-state memory, for example, but may also be an accounting convenience given that AI investments will be hitting earnings as depreciation in the coming years. It won’t be surprising if hyperscalers begin emphasizing alternative metrics like EBITDA (earnings before interest, taxes, depreciation and amortization) in the coming years.
One of the fascinating moments of a bubble is when it becomes circular – particularly when speculative activity produces “asset values” that become the basis for further increases in reported income, leverage and speculative activity. Under old accounting rules, paper gains from backing private tech startups, for example, were parked on the balance sheet under accumulated “other comprehensive income” until the investment was sold. FASB accounting rule ASU 2016-01 changed that. The rule requires companies to place these valuation markups – stakes in OpenAI, Anthropic, or SpaceX – directly into the income statement as headline earnings. Last quarter, according to the Financial Times, the windfall amounted to $160 billion. Stripping out these gains from S&P 500 would have reduced year-over-year S&P 500 earnings growth by nearly half.
The fun continues when the circular AI capital flows move to the top line. As glamour-tech hyperscalers plow billions of funding into AI labs, they also essentially manufacture their own downstream enterprise demand. For example, as OpenAI or Anthropic recycle their funding capital back to their venture investors, buying chips or cloud capacity, speculative venture-capital balance sheet investments are essentially laundered into high-margin operating revenue. Though not the same as the capacity swaps that companies used in the tech bubble to invent revenue, the circularity is hauntingly familiar.
The concept was simple: Company A would sell capacity on its network to Company B, and Company B would simultaneously sell a similar amount of capacity to Company A. No cash changed hands, yet both companies booked the transactions as immediate revenue, creating the illusion of growth out of thin air.
James C. Greenwood, Chairman of the House Subcommittee on Oversight and Investigations, October 1, 2002
As for AI capacity itself, the “swarm-like” appearance of competitors, to use Schumpeter’s phrase, often results in benefit in the form of “consumer surplus” rather than profit. The current boom in AI investment may very well result in a similar type of “dark compute” that gets absorbed over time, but not necessarily in a profitable way. That’s not to say that monopoly-like profits won’t persist for some companies, but as with the internet bubble, the stocks of these companies could languish for a decade or more even if that occurs. Nothing in our investment discipline relies on that outcome, but we’ve been very content, for decades, with a stock selection approach that can prosper without any need to chase speculative glamour.
Oh, and in case anyone’s interested, my wife Terri and I are pleased to announce that we will be providing $1 trillion – yes $1 trillion in financing – to enable people to buy rather expensive chocolate chip cookies that we’ll be baking in our kitchen. I believe this is the largest circular chip financing deal ever announced.
On the growing disparities in household income and wealth
Returning to the widening spread between the surpluses of corporations, and the steep deficits of government and households, the chart below shows how this dynamic is playing out for working families. The blue line shows corporate profits as a share of GDP (left scale). The red line shows employee wages and salaries, also as a share of GDP (right scale).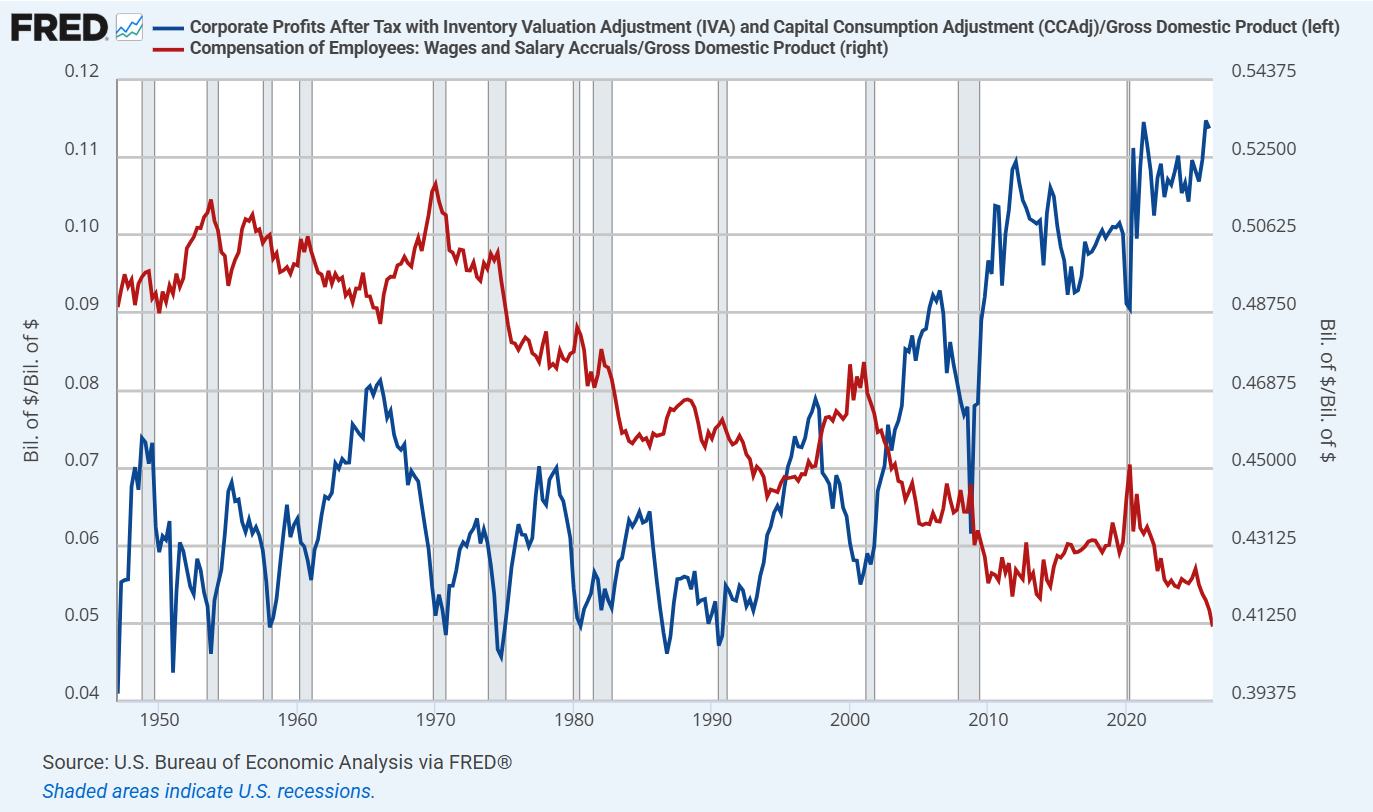
Now, we should be careful to avoid “zero sum” thinking. If one group becomes wealthier, it doesn’t necessarily follow that another group becomes poorer, but to avoid that outcome, growth is necessary. Real growth. The problem for the U.S. is that even as the distribution of income has become increasingly lopsided, the real rate of GDP growth has slowed. Indeed, despite all of the technological advances in the past 25 years, real GDP growth has been the slowest on record.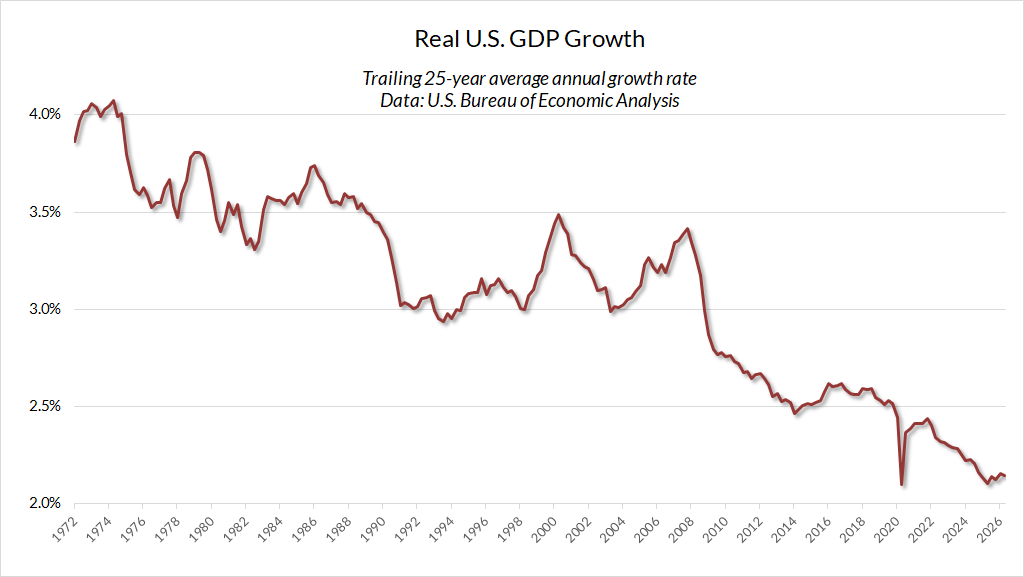
Meanwhile, the real wages of working families have been progressively falling behind labor productivity. Employees have produced increasing amounts of real output, but in return for real wages and salaries that don’t allow them to enjoy a proportional amount of real output as income. Technology explains part of this, labor offshoring explains part of this, and the gradual weakening of labor’s bargaining strength explains part. The end result is that an increasing share labor productivity accrues not to workers but to corporate profits.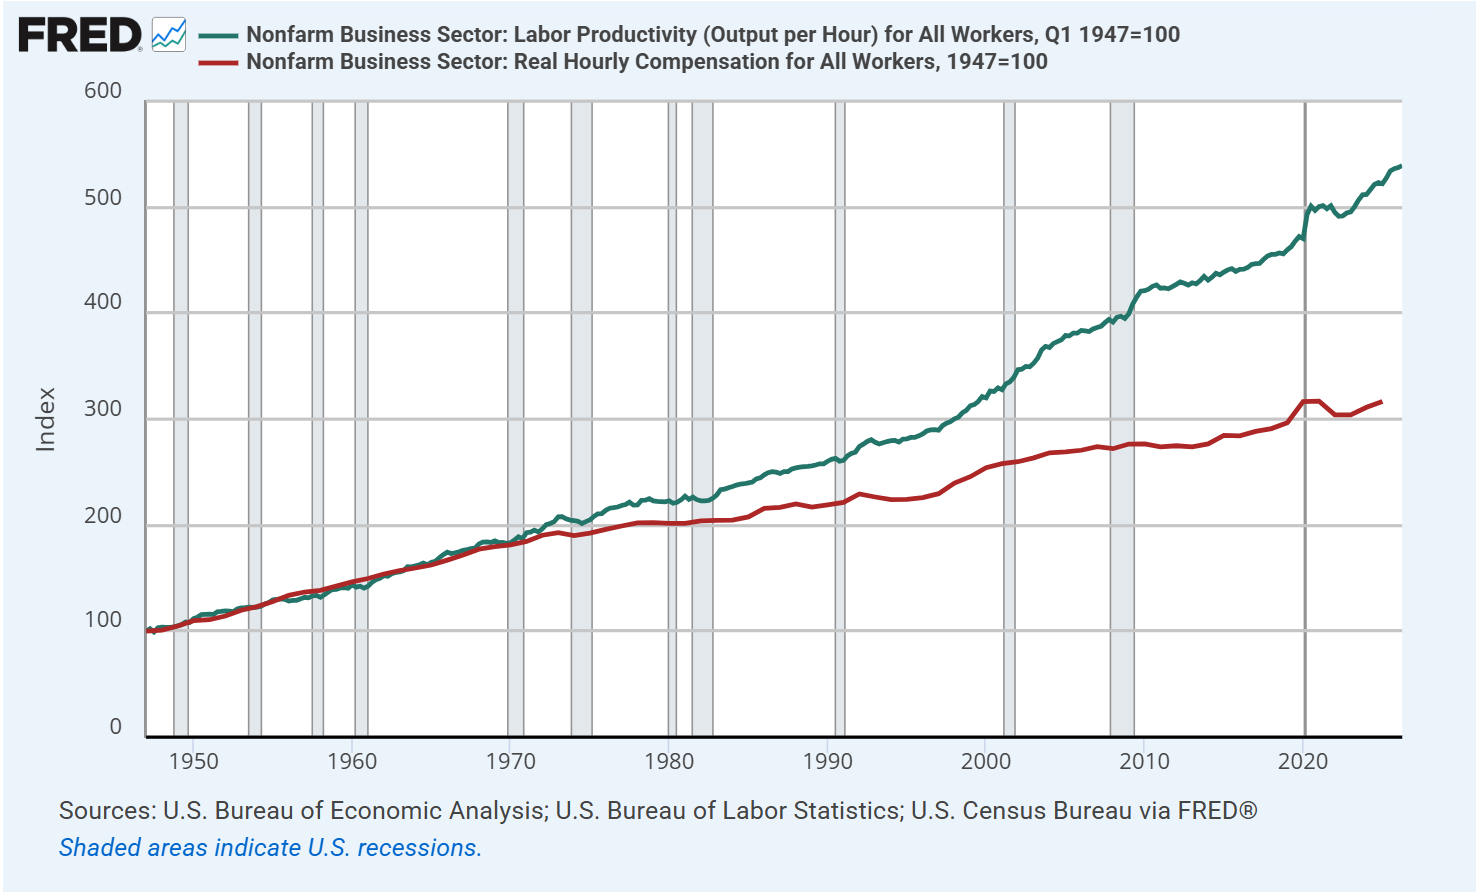
Now, if households, particularly outside the wealthiest 10%, are receiving a progressively smaller share of GDP as wages and salaries, how do they, in aggregate, make ends meet? How do companies sell the goods and services they produce? The answer is that government spending bridges the gap. Two-thirds of federal government expenditures are transfer payments. By contrast, federal employment had declined to just 1.9% of nonfarm employment, the lowest level in history, even by 2024.
The chart below offers a sense of what’s going on. The green line shows wages and salaries as a share of GDP. The higher blue line includes the employer contribution to payroll taxes. These lines have declined progressively. The blue line at top is the one that’s been able to tread water. It shows the direct compensation of employees by corporations, plus government transfer payments, plus all other Federal government non-defense consumption and investment expenditures.
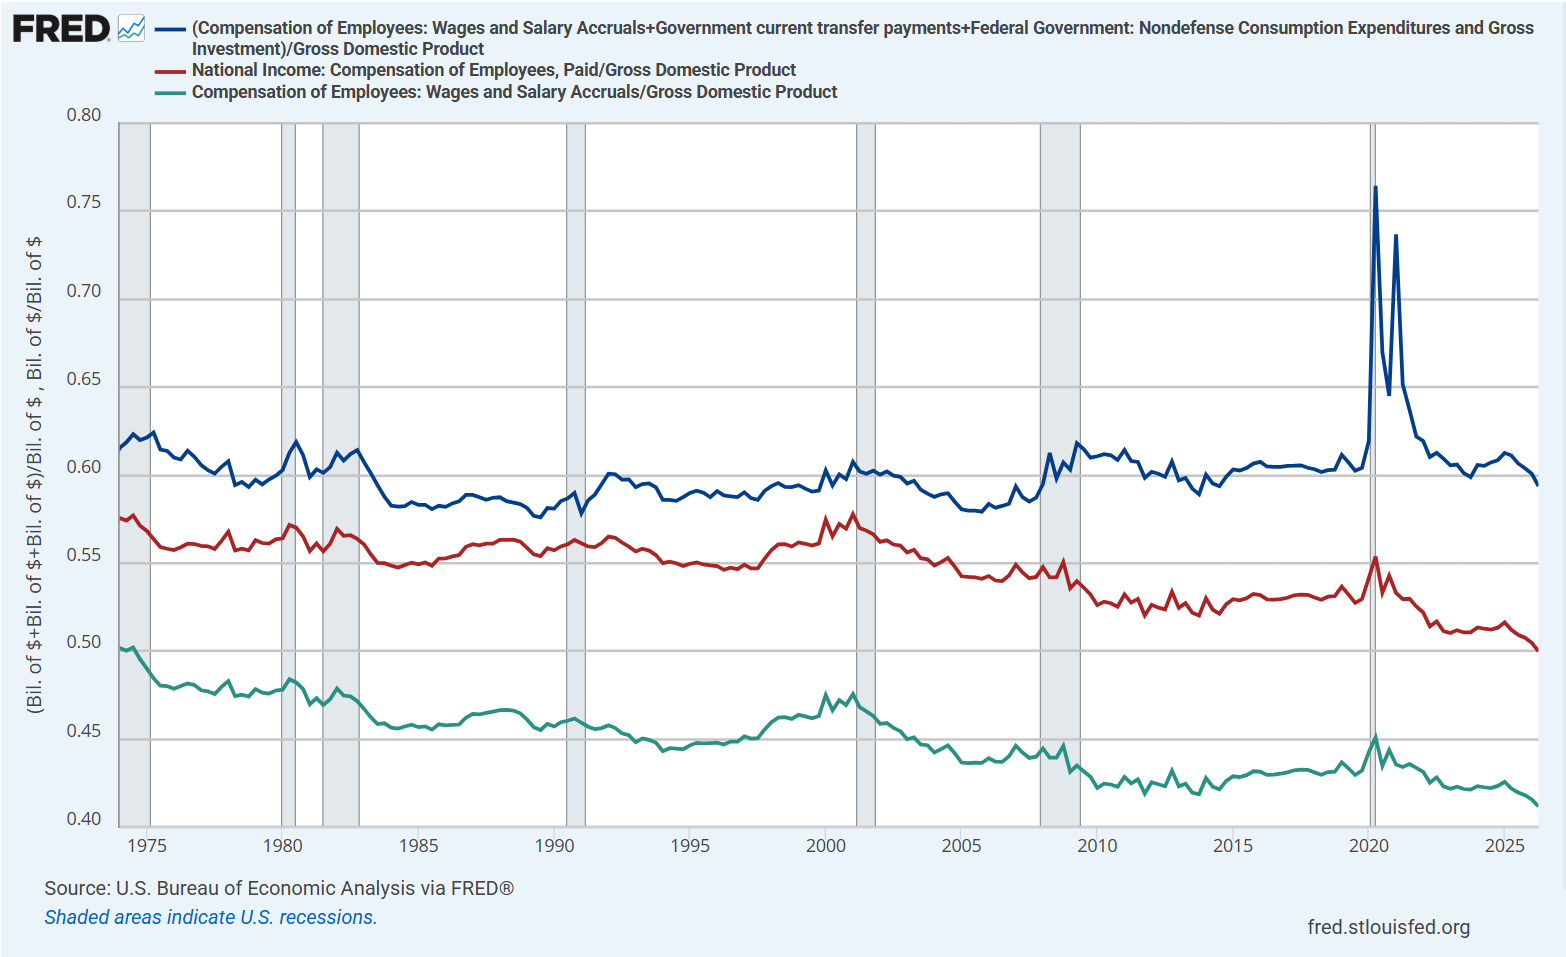
Our enormous and expanding government debt is precisely what allows this house of cards to keep standing. In equilibrium, government spending allows households to purchase more goods and services than their wages and salaries alone could command. This allows households to bridge the gap between what they produce and what they are actually paid. Because the output can still be purchased, corporate revenues aren’t harmed by the fact that workers have fallen behind. The combination of adequate revenues and suppressed labor costs results in high profits.
The surpluses of the top 10% are used to purchase the new liabilities issued by the government, which completes the circular flow. In effect, government deficits have become necessary for the record profits themselves – they’re part of the equilibrium forced by our policy choices.
The deficits are the surpluses. The liabilities are the assets. The road up and the road down are the very same road.
As usual, every deficit of government emerges as a surplus for some other sector (income over-and-above consumption and net investment). In order to finance a deficit, the government has to borrow someone’s income, and in return, it issues a Treasury security. In equilibrium, every security that’s issued has to be held by someone, and every dollar of income that’s borrowed by the government has to be lent by someone. While the individual lenders and holders may be different, and a whole chain of intermediate transactions might take place, when we look at the economy as a whole, the new private financial surpluses that resulted from the deficit spending will be held as new Treasury securities that were issued to finance the deficit.
Policy alternatives for a more balanced economy
The $40 trillion debt obligation of the U.S. Treasury primarily comprises securities that have been acquired as financial surpluses by the private sector, particularly households and the institutions that hold their savings, along with foreign investors (the full breakdown, including intragovernmental holdings, is discussed in the next section). Those financial surpluses are not independent of the deficits that produced them. For the economy as a whole, one sector can accumulate financial claims only to the extent that some other sector issues the corresponding liabilities.
The distribution of these claims is extraordinarily concentrated. As of the first quarter of 2026, the wealthiest 10% of U.S. households held 67.9% of all household net worth. The wealthiest 1% held 31.6%, and the bottom half of U.S. households held just 2.5% of household net worth.
Meanwhile, the wealthiest 10% of U.S. households held 87.4% of all corporate equities and mutual fund shares. The wealthiest 1% held 50.2%, and the bottom half of U.S. households held 1.1% of corporate equities and mutual fund shares.
Among government and municipal securities owned by U.S. households, roughly 79% are held by the wealthiest 10% of households, including about 38% held by the top 1%. The bottom half of U.S. households held just 0.5% of government and municipal securities.
The accumulation of financial wealth at the top isn’t simply the result of thrift, or the ordinary workings of the economy – it’s shaped by active choices, particularly the fact that we somehow can’t imagine taxing a dollar of income earned as capital gain or financial income at anything close to the combined rates commonly imposed on a dollar earned as wages and salaries, or to apply the payroll-tax base uniformly across labor and capital income. The 12.4% Social Security payroll tax base currently stops at $184,500 of wages. A broader tax base would permit substantially lower rates while reducing the extraordinary preference presently given to certain forms of capital income.
Meanwhile, we somehow can’t imagine a tax on the “dominance rents” of massive corporations that benefit from the private capture of network effects, content created by the public or trained by the intellectual property of others, and features of natural monopoly that go far beyond the normal compensation for productive innovation and risk-bearing (see Mountain, Cliff, or Ocean).
In my view, the balance is to preserve what is often high efficiency and innovation, while recognizing that hyperscale revenues typically reflect private capture of socially generated network value. For the most purposes here, a clean tax base would be:
Gross Value Added – Wage/salary allowance – Capital return allowance
for companies with revenues above some very large threshold. The U.S., by the way, is the only country in the OECD without a value-added tax – in most of those countries, it’s actually structured to be flat or progressive (not regressive as critics often claim), and can be particularly effective when paired with targeted credits or transfers to low income families. The proposal here isn’t a conventional VAT, but it begins with the useful concept of gross value added and then deducts ordinary compensation to labor and productive capital in order to isolate dominance rents.
The wage/salary allowance would exclude payroll up to say, $150,000 per employee, and the capital return allowance would deduct a fixed return, say the 10-year Treasury yield + 3%, times the undepreciated value of qualified tangible capital investment and capitalized R&D investment. That way, companies that earn enormous revenues by employing lots of individuals or carrying out actual investment activity would be unaffected, but the natural-monopoly problem would be addressed.
Taxing a dollar of income as a dollar of income somehow seems unimaginable, but that’s exactly how to restore balance to increasingly lopsided fiscal policies that tax the wage and salary income of working households at full freight, but apply vastly lower rates to corporate profits, retained or converted through buybacks into trillions in unrealized financial gains that will eventually be taxed at rates that have a discounted present value of next-to-nothing.
I do believe that short-term capital gains rates are too high. You want the combined corporate tax rate Tc and capital gains rate Tg – together – to match the combined tax Ti on ordinary income:
(1-Tc)(1-Tg) = (1-Ti)
Ditto for the combined corporate tax rate and dividend tax rate. If a company earns a dollar and pays it out as dividends, the two taxes should combine to equal the tax on ordinary income. It’s fine to have exclusions for moderate incomes, but the current tax treatment of multi-million and multi-billion dollar equity holdings is insane.
Ideally, one could eliminate the short-term gain / long-term gain distinction with a single capital gains rate, and every year that investors defer unrealized capital gains, there would be a modest current interest charge, say:
1-year Treasury yield x Capital gains rate x Unrealized gains
that prevents the free deferral of tax on massive amounts of unrealized gains. In that way, whether a dollar of corporate income is taxed and distributed immediately, retained by the company, converted through buybacks and held for decades as a long-term gain, or transferred to another stockholder through a sale, the present value of combined taxes on that dollar of income would be exactly the same.
The modest interest charge would be calculated annually on aggregate net unrealized gains, avoiding any need to track individual securities or historical tax lots. If unrealized gains decline, the following year’s charge declines automatically; if they disappear, so does the charge. The charge isn’t an advance payment on a future capital gain, and doesn’t require the gain to persist. It simply reflects the benefit of the tax deferral for that year. Also, the interest rate isn’t based on average market returns, but simply the government’s actual 1-year financing costs. The investor retains both the upside and downside risk of continuing to hold the asset. Put simply, the government doesn’t share the investment risk. It just stops providing free financing for deferred taxes.
As I’ve noted before, it’s useful to distinguish financial capital “capital with a c”, from real productive capital investment “capital with a K”. Financial capital © consists of stocks, bonds, and other financial claims; productive capital (K) consists of factories, equipment, software, research and development, infrastructure, and human capital that actually increase the economy’s productive capacity. Financial capital may be used to finance productive capital, but the two are not the same thing, and giving preferential tax treatment to © is an indirect and inefficient way to encourage (K).
Equalizing the taxation of financial income need not weaken investment incentives. If the objective is more productive investment, policy should support (K) directly: through expensing, investment tax credits, R&D incentives, and investment in human capital, rather than indirectly through preferential taxation of financial gains © – particularly multi-billion long-term capital gains that are essentially produce tax revenues with a present value of next to nothing.
When you instead tax corporate earnings lightly, and they can be retained or converted to long-term gains taxed at a present value close to zero, you create a huge gap that favors a financial dollar of income over a working family’s dollar of income.
The point isn’t simply to collect more revenue. A broader and more neutral tax base creates room to lower the tax rates on ordinary wages, strengthen Social Security and Medicare financing, provide earnings-linked family support, and reduce the extent to which basic household needs need to be financed through private debt or government deficits. The goal is to shift the tax system away from playing favorites between this dollar and that dollar based what form the income takes.
The cumulative effect of current policy choices has been to create a huge preference toward a dollar earned as profits and financial gains, and against dollars earned as wages and salaries. One should not be surprised that, as a share of GDP, one has flourished and the other has collapsed.
On interest rates, Fed policy, “cash on the sidelines” and our $40 trillion Treasury debt
The gross debt of the U.S. Treasury reached $40 trillion last month. About $8 trillion of that debt is held by federal trust funds and other government accounts. The other $32 trillion is “debt held by the public”: about $18.5 trillion by domestic investors and institutions, about $9 trillion held by foreign investors and central banks, and roughly $4.5 trillion held by the Federal Reserve.
We can learn a lot about how the debt has accrued by examining when it spikes. The chart below shows the year-over-year change in the U.S. federal debt to GDP ratio. Notice the spikes. The shaded areas are recessions. That’s when the floodgates open, partly for valid counter-cyclical reasons, and partly because opportunism says “never let a good crisis go to waste.”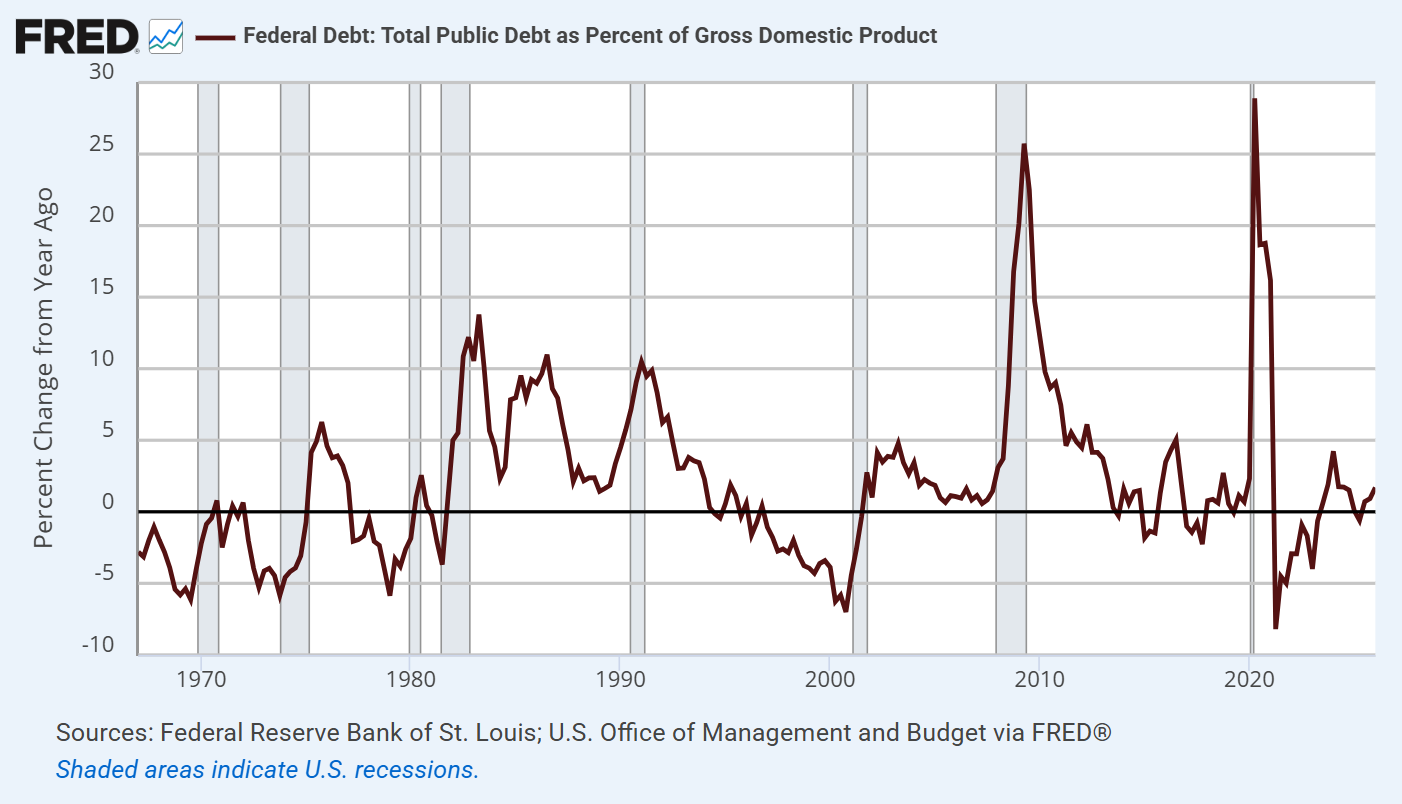
As I’ve noted before, if we’re truly interested in a sustainable federal debt, the first priority is to avoid watering the seeds of future crisis in the first place: discourage policy distortions that encourage speculation and its inevitable collapse; ensure that bank capital requirements are sufficient to limit the risk of financial crises; avoid the tendency to abandon concern about speculation, leverage, and lax oversight just because things are going well; and when stimulus packages are necessary, demand that they are well-targeted, directly encouraging real capital investment, taking failing financial institutions into receivership followed by “purchase and assumption” rather than bailing them out, targeting lower- and middle-class households with the highest propensities to consume.
Like the response to the Global Financial Crisis, the first round of pandemic support had features that acted as direct subsidies to corporate balance sheets and profits, because they covered payroll expenses even for businesses that were not experiencing economic hardship (something I strongly discouraged when advising members of Congress on structure, but other members wouldn’t have it otherwise). The second round of pandemic support funded a lot of discretionary spending by households that also ended up as corporate profit, but also as nonessential consumption goods and services. Surrounding the GFC and the pandemic, we’ve also had spikes related to corporate and high-income tax reductions. Both spending and revenue decisions have played a part in our expanding debt.
The largest holders of Treasury debt are domestic savers (directly or indirectly through banks, money market funds, pensions, insurance companies, or other intermediaries), with about $18.5 trillion in holdings.
When the United States imports more goods and services than it exports, foreigners receive something in return: U.S. financial assets, including securities. Indeed, the “current account” deficit for goods and services is essentially the mirror image of the “capital and financial account” surplus. That is, we export more financial stuff than we import. Apart from statistical discrepancies, they add to zero, which is what we call the “balance of payments.” Treasury securities, about $9 trillion at present, are among the main assets that our foreign trading partners ultimately hold.
The Federal Reserve bought most of its $4.5 trillion in Treasury securities over more than a decade of quantitative easing following the GFC, with a final burst during the pandemic. When the Fed buys a Treasury security, some saver in the economy who previously held the security (directly or indirectly) obtains a different asset instead – usually a bank deposit or a money market instrument – while the bank or money market institution holds a new liability created by the Fed: bank reserves or a “reverse-repo”.
In effect, the Fed removes Treasury securities from the hands of the public and replaces them with a Fed liability instead: bank reserve, reverse repos, or currency (read the top line of the dollar bill in your wallet). The government’s obligation doesn’t disappear, it just changes the form of that obligation.
The combination of heavy Treasury debt, disruptions in the global oil supply chain, and labor market tightness has placed upward pressure on long-term interest rates in recent months. My own impression is that many of these pressures are temporary, but as I’ve noted before, inflation isn’t driven by fundamentals, or even monetary policy nearly as much as it is driven by what’s in people’s minds. Hands down, the best predictor of inflation next year, beyond employment, beyond GDP growth, beyond Federal Reserve policy moves, is inflation over the past year. The next best predictor is inflation two years ago.
Based on systematic historical relationships between the Federal Funds rate and observable economic variables, yes, the Fed Funds rate is presently a bit lower than conditions might indicate. As I’ve detailed previously, however, the link between Fed policy rates and real economic activity and even inflation is quite weak and unreliable in terms of effect size. Rate changes of hundreds of basis points do matter, and the speculative effect of near-zero rates also matters, but we’ve been out of those woods for a while. I don’t see a pressing case for rate hikes at the moment – the departure from systematic policy benchmarks is nowhere near as egregious as it was between 2008 and 2022 – but it will be useful for the Fed to monitor this gap as conditions evolve.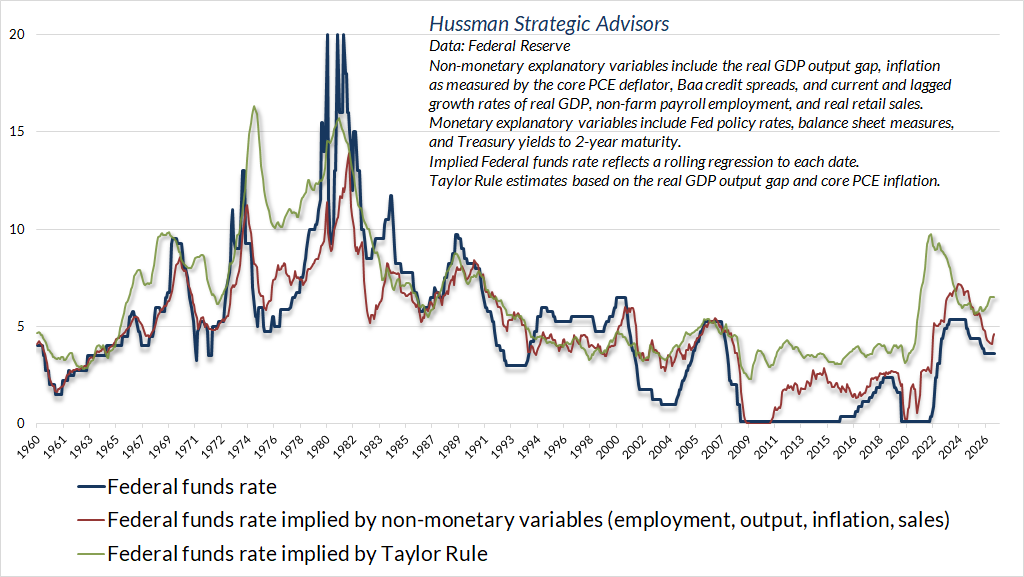
The good news is that after a very long period of inadequate long-term Treasury yields, they’ve finally pushed into the area where a bond component makes sense in a diversified portfolio, particularly if one uses price weakness as opportunity. As I demonstrated in the June comment Record Extremes, Alternative Investments, and the Hippo, some investment holdings can be extremely valuable in raising the overall portfolio return/risk ratio even if the standalone return is modest or, in some cases, even negative. We’ve seen a few assertions that the 60/40 portfolio is “dead” based on the performance of bonds since 2000, but that’s a bit like closing the barn door after the horse has left. From the standpoint of Treasury bonds, the horse has actually returned to the stable. The chart below shows the current position of the 10-year Treasury yield relative to the simple but useful benchmarks we often share.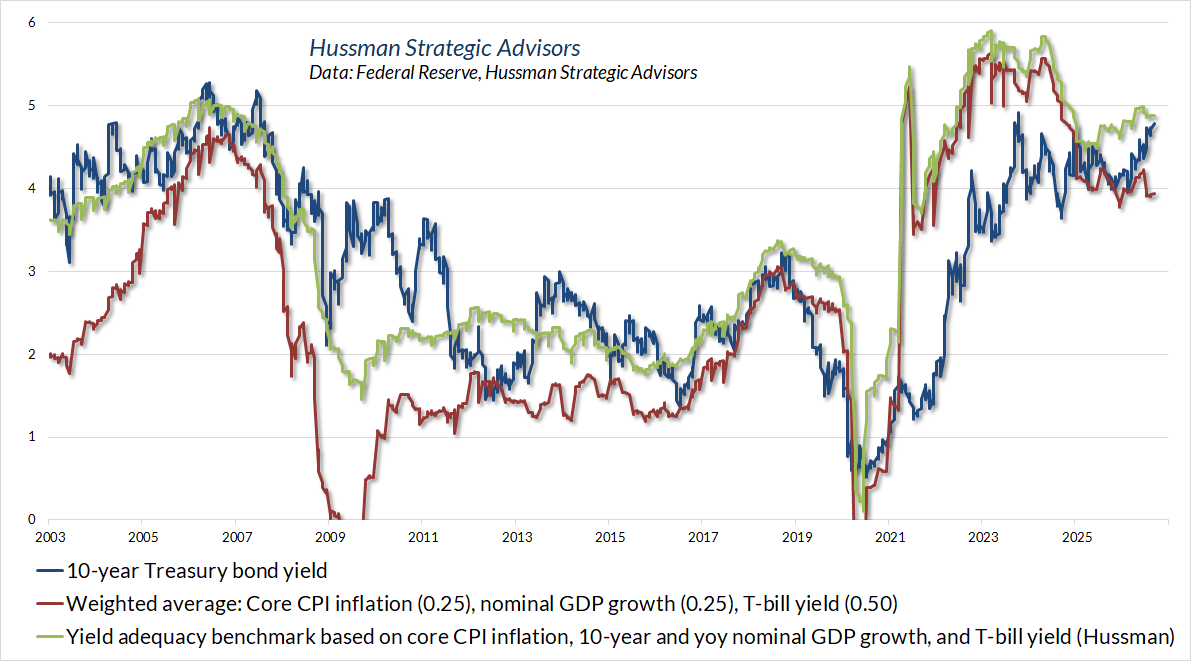
Meanwhile, the frequently-discussed mountain of so-called “cash on the sidelines” is a stack of liabilities that exist in their own right – someone has to hold every dollar the Fed has created, in the form of currency, reserves, or reverse-repos, until the Fed retires them. The cash is there because the Fed put it there. The cash will cease to be there only if and only when the Fed removes it by shrinking its balance sheet. Of course, Fed liabilities can behave as hot-potatoes, which was true between 2008 and 2022 when banks received zero interest for holding them, but even then, they can only change hands from one holder to another. The notion that this “cash on the sidelines” is sitting there just “waiting to go into” the stock market is like talking about the sound of one hand clapping. If someone puts a dollar of cash “into” the market, the seller takes it right back out.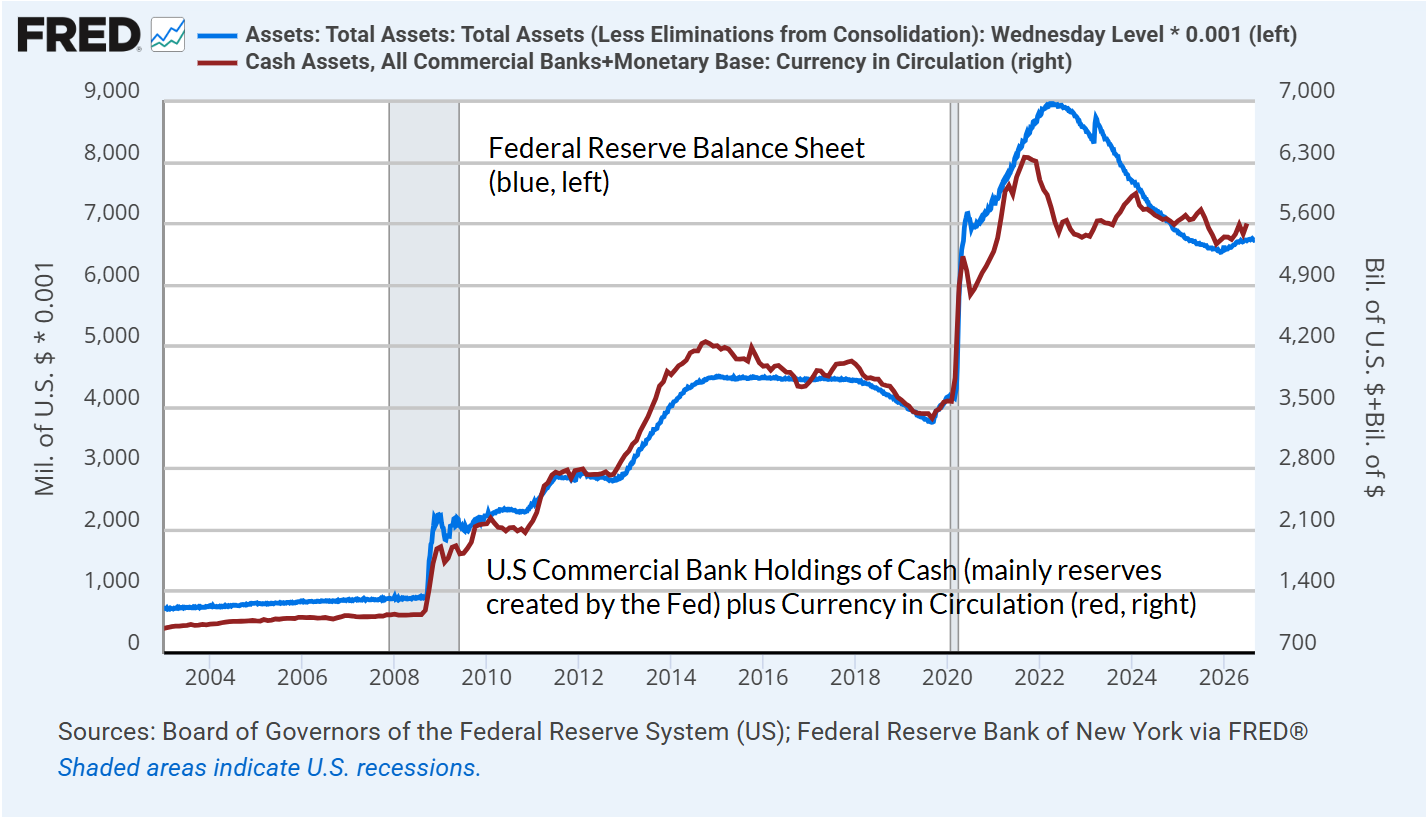
In short, the government’s deficit is someone else’s surplus. The government’s liabilities are someone else’s assets. The deficit bridges the gap between the income of working families and their spending, particularly the 50% of American families that collectively hold just 2.5% of the nation’s total net worth, 1.1% of its equities and mutual funds, and just 0.5% of government and municipal securities.
In recent decades, we’ve seen a remarkable kind of sleight of hand. We’ve wholly ignored the emergence of massive natural monopolies that often go virtually untaxed; we’ve created large tax preferences that favor a dollar of financial income over a dollar of wage and salary income; we’ve issued Treasury securities, mostly to the top 10%, to finance transfer payments to the other 90% of households whose wage and salary income has kept up neither with their labor productivity nor their health and spending needs; and while the largest holders of government obligations are the wealthiest households, we point to the Treasury liabilities, announce that the country is “deeply in debt”, and demand cuts in the very spending that bridges the income gap of the 90%.
The $40 trillion debt obligation is real, but the other side of that $40 trillion liability is $40 trillion of financial claims, and the distribution of those claims tells us a great deal about how we got here.
Yes, our investment flexibility has widened
When I was growing up, my parents put an enormous emphasis on education. Looking back, I probably could have done everything short of landing in jail – as long as I pulled straight A’s I was golden. The problem is that knowledge can lead us to forget that the maps we make of the world, the concepts we apply, the ideas, notions, lenses, viewpoints, theories, and discriminations we invent, are only our own inventions and not the world itself. As we gain “knowledge” we can begin to see a world created from countless human minds, and we can begin to miss reality itself. In truth, reality is too large and too nuanced to be contained within our concepts.
The practices that help, and definitely helped us this year, is to bring our mindfulness to the present moment, release our judgments, concepts, discriminations between this and that, to see that this is because that is, that everything we observe is made from a flowing river of causes and conditions. Those practices – mindfulness, deep looking, non-discrimination, letting go – remain among of the enduring gifts offered by my beloved friend and teacher Thich Nhat Hanh (“Thay”). Eventually, we start to see that the solid blocks of our knowledge aren’t as solid as we thought; that the labels we attach to this thing, or that person, are labels of our own construction. As things become less solid, the light begins to come in.
“Enlightenment” is nothing other than the dissipation and letting go of our notions, dogmas, concepts, judgments, discriminations, ideas that this is separate from that. As Thay often said, it’s moment the wave realizes it’s also the water. It doesn’t mean we abandon the tools, indicators, insights, or skills we’ve learned, but we apply them in a more flexible, appropriate, light-handed way, seeing the situation in the present moment as the thing in itself, rather than stuffing it tightly into one of the boxes we’ve invented. We stop hating this and loving that, because the thing we hate may only be the thing we love, jarred by causes and conditions that we can address with compassion. The thing we love may be inseparable from the thing we hate, because we haven’t seen how our attachment to the thing we love has inadvertently created suffering on the other side of the same coin.
Dr. Wayne Dyer had a wonderful quote – “When you change the way you look at things, the things you look at change.” That change may be internal – changing our perspective can change the way we experience a given situation; it may be external – changing our perspective can change our actions, and allow our situation to change. Either way, as the Buddha taught, “with our thoughts, we create our world.”
Since February, and particularly since mid-May, there’s an aspect of our investment outlook, our day-to-day actions, and our market comments that’s important for our long-term followers to recognize and understand. It’s a change, and one that shouldn’t be missed. The introduction to that change is detailed in How I Learned to Love the Bubble (Before it Bursts). The central insight is extended in (More) Roses amid Garbage and Trap Doors. And because once you recognize the shoots of a rose, you begin to see them everywhere, we’ve been able to extend that insight to the point where fully two-thirds of history, and even about one-third of periods in recent years, comprise periods that we can classify as “constructive” based on well-defined, measurable, observable conditions. Moreover, these periods, in themselves, capture the entirety of market gains even during the recent bubble.
It’s not that valuations, market internals, or other core features of the market environment have changed. They haven’t. Nor have the central elements of our discipline changed. My long-term view remains that the S&P 500 has the potential to lose something on the order of 50-75% from recent highs, over the completion of this market cycle. Indeed, even if we take recent extreme profit margins as permanent and representative of the indefinite future, current valuations are still at levels that have historically been associated with 10-12 year S&P 500 total returns in the low single-digits.
Still, every bit of news and information that affects the market exerts that effect only to the extent that it changes someone’s behavior. News doesn’t move the market, earnings don’t move the market, fundamentals don’t move the market, economic events don’t move the market – at least not directly. The only things that directly move the market are the beliefs, perceptions and expectations about this information as it filters through the collective heads of investors.
If people believe gibberish, it can and will affect their actions, even those actions are based on distorted perceptions. Likewise, the identical piece of news might have a positive or negative impact on the market, depending entirely on whether it supports or refutes some hope or fear that was previously in the collective heads of investors.
What has changed profoundly is the flexibility of our response, even amid bubble conditions. If the current speculative bubble was to persist and expand, forever, we would be very content with that. If the bubble was to collapse immediately, we would be equally content.
Earlier this year, I discovered that I had vastly underexploited the hedging implementation that we introduced back in September 2024. See, prior to 2024, all of our adaptations to this bubble focused on how to manage our investment positions when our key gauge of market internals is favorable. In contrast, the 2024 hedging implementation gave us a systematic way to vary the intensity of our bearish outlook even when market internals are unfavorable.
In early February, in a moment of meditation actually, one additional realization hit me like a brick – “Oh, no. I’ve been discriminating against the bubble.” The are technical and analytical ways to describe the greatly increased flexibility that resulted, but a lot of the analytics, particularly the option and hedging mathematics, were already in place by September 2024. Because the February adaptation emerged mainly from non-dualistic insight rather than brute analytical effort, the cleanest description is this: letting go of inflexible labels like “garbage”, “hostile” and “trap door” made it possible to see places where roses would often bloom even amid conditions that a century of market history had convinced us were garbage – and just as important, safe ways to cultivate those roses without abandoning the lessons of history.
The chart below is reprinted from the July comment Mountain, Cliff or Ocean. It shows the cumulative total return of the S&P 500 based on the more flexible return/risk classifications that we’ve adopted into our current investment discipline. Our current implementation improves on even this, and we’ve been briefly constructive even since mid-May. My hope is that the impact will be progressively obvious in real-time. The greatly increased flexibility of our constructive and defensive return/risk profiles reflects the “tilt” of market conditions we’ve monitored for decades – just without rigid top-level discriminations like “garbage”, “hostile”, “trap door”, that often eliminated our flexibility.
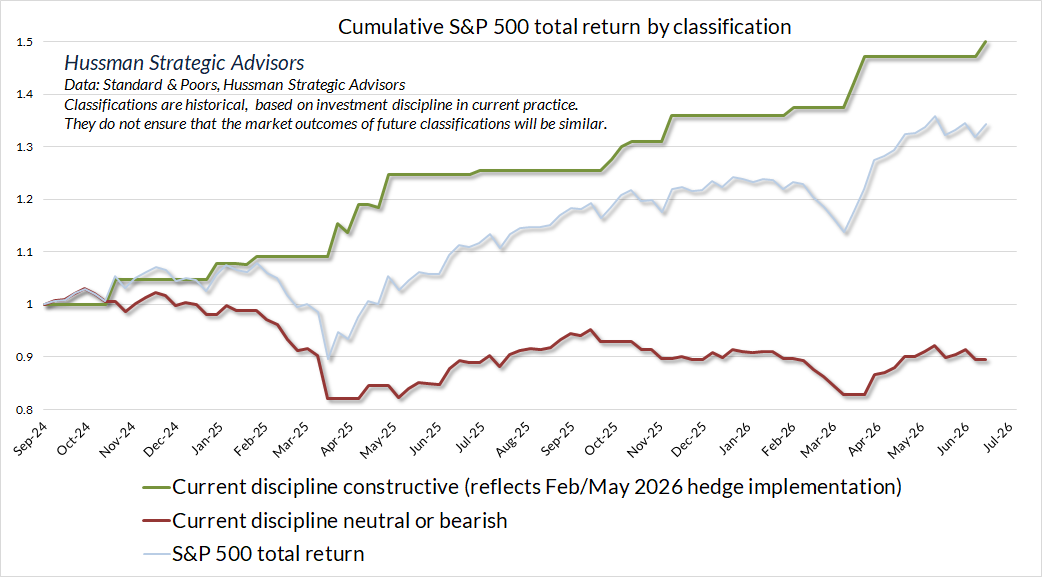
Part of my tortured adolescence included several years as a performing magician/ventriloquist, during which time, I learned how to make balloon animals (yes, that was an actual sentence). Imagine blowing up a balloon. The first time you blow it up, it may take a bit of effort. But if you let the air escape, then blow it up again, it inflates very quickly. In a speculative bubble, the “fast, furious” market rebounds that accompany market selloffs are often of that variety, particularly if market internals are unfavorable (as they are now). Under those conditions, the majority of constructive opportunities occur once the market has retreated from its highs. It isn’t nearly as simple as “buy the dip”, because many dips extend significantly, and some devolve into collapses. But as I’ve detailed in prior comments, there are often measurable, observable features of investor sentiment and market internals (even when broad internals are unfavorable) that can identify a constructive tilt with a surprising level of consistency. That’s what gives these constructive periods a kind of “stair-step” profile.
There’s no assurance that future market conditions will generate the same profile of returns, but across a century of data, the profiles look similar whether we look back to 2021, 2000, 1940 or 1928. Since mid-May, we’ve seen the early impact of a few of these constructive periods in real time.
It’s particularly encouraging that our present, more flexible classifications would have improved on the already admirable record of our investment discipline in previous market cycles, including the tech bubble, the mortgage bubble, and also during their subsequent collapses. We have no intention of “getting cute” with a bubble, or to reach for nickels in front of a steamroller. It’s clear, however, that there are regular instances that systematically tend to accompany “fast, furious” advances, when it’s far more sensible to maintain safety net and remove the upside “cap” than to “fight” speculators who have a bit in their teeth. For a full discussion of the adaptations we’ve made during this bubble, see the section titled “Understanding the discipline – a review of adaptations to the bubble” in our June comment Record Extremes, Alternative Investments, and the Hippo.
One can reasonably ask – but wait, if our discipline is capable of adopting a constructive outlook even amid the most extreme valuations in history, and even in a period where our measures of market internals remain unfavorable, have we somehow disabled the impact of valuations and market internals on our investment work? The answer, happily, is no.
Valuations and market internals continue to dictate whether or not we require a safety net, and the frequency of constructive positions is clearly lower during periods when these conditions are hostile. It’s just that we’re no longer caught in boxes of our own making – even amid hostile conditions, the frequency of constructive positions rarely drops below about 20% (that is, roughly once in 5 weeks). Even in the most extreme bubble periods, the overall gain of the market is generally concentrated in that smaller handful of periods. Here’s what the frequencies of constructive market return/risk classifications and safety nets look like in data since 1928, as a function of market valuations.
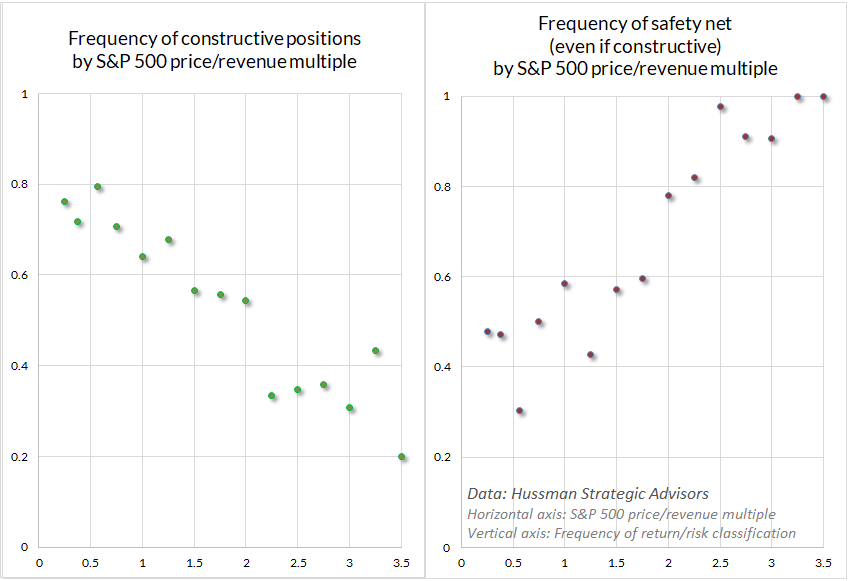
Aside from knowing that our investment position presently requires a safety net regardless of short-term conditions – we have utterly no opinions, preferences, or scenarios about the market outlook even a month or a quarter from now. Given present market extremes, yes, we’re about twice as likely to be defensive as constructive, but even here, we expect our investment stance to be constructive about 20-30% of the time. Again, we’ve been briefly constructive even since mid-May.
In early February, in a moment of meditation actually, one additional realization hit me like a brick – ‘Oh, no. I’ve been discriminating against the bubble.’ The are technical and analytical ways to describe the greatly increased flexibility that resulted, but a lot of the analytics, particularly the option and hedging mathematics, were already in place by September 2024. Because the February adaptation emerged mainly from non-dualistic insight rather than brute analytical effort, the cleanest description is this: letting go of inflexible labels like ‘garbage’, ‘hostile’ and ‘trap door’ made it possible to see places where roses would often bloom even amid conditions that a century of market history had convinced us were garbage – and just as important, safe ways to cultivate those roses without abandoning the lessons of history.
Even these classifications are things to be held without too much attachment. They can certainly be incorrect, and that’s part of the reason for the safety nets. Recall the “bell curves” that I’ve presented in prior comments. It’s clear that every one of the market return/risk classifications we identify is associated with both gains and losses – in any given week, it’s close to a coin flip – but the average return, the width, the shape of the distributions, particularly the shape of the tails, is significantly different across these classifications.
Again, none of this means that we give up the tools and skills we’ve learned. Only that we apply them in a more flexible, appropriate and hopefully insightful way, seeing the situation in the present moment as the thing in itself, rather than stuffing it too tightly into a box we’ve invented. We still use our eyes, whether we look at an apple and see just an apple, or whether we look at the apple and see the whole universe. But to let go of the fixed ideas that we’ve dragged around, and to allow light into the cracks of their solidity, is liberation.
The takeaway shouldn’t be missed – even amid the most extreme valuations in history, and even amid reasonable expectations for significant market losses over the completion of this cycle, we would be perfectly content with a never-ending bubble, and perfectly content with an immediate collapse. Nothing in our investment discipline relies on either, or on any of the myriad scenarios that many investors seem to believe we are “forecasting” or relying on.
It’s fair to say that current valuation extremes make us very skeptical that the long-term investment prospects of U.S. stocks are something other than dismal. We also continue to estimate potential downside market risk (not a forecast) on the order of 50-75% over the completion of this rather spectacular cycle. Maintaining a safety net is essential, regardless of shorter-term considerations. But – aside from safety nets – if even we can’t say whether our investment stance will be constructive or negative even a few weeks or months from now, believe me, nobody else knows either.
The foregoing comments represent the general investment analysis and economic views of the Advisor, and are provided solely for the purpose of information, instruction and discourse.
Prospectuses for the Hussman Strategic Market Cycle Fund, the Hussman Strategic Total Return Fund, and the Hussman Strategic Allocation Fund, as well as Fund reports and other information, are available by clicking Prospectus & Reports under “The Funds” menu button on any page of this website.
The S&P 500 Index is a commonly recognized, capitalization-weighted index of 500 widely-held equity securities, designed to measure broad U.S. equity performance. The Bloomberg U.S. Aggregate Bond Index is made up of the Bloomberg U.S. Government/Corporate Bond Index, Mortgage-Backed Securities Index, and Asset-Backed Securities Index, including securities that are of investment grade quality or better, have at least one year to maturity, and have an outstanding par value of at least $100 million. The Bloomberg US EQ:FI 60:40 Index is designed to measure cross-asset market performance in the U.S. The index rebalances monthly to 60% equities and 40% fixed income. The equity and fixed income allocation is represented by Bloomberg U.S. Large Cap Index and Bloomberg U.S. Aggregate Index. You cannot invest directly in an index.
Estimates of prospective return and risk for equities, bonds, and other financial markets are forward-looking statements based the analysis and reasonable beliefs of Hussman Strategic Advisors. They are not a guarantee of future performance, and are not indicative of the prospective returns of any of the Hussman Funds. Actual returns may differ substantially from the estimates provided. Estimates of prospective long-term returns for the S&P 500 reflect our standard valuation methodology, focusing on the relationship between current market prices and earnings, dividends and other fundamentals, adjusted for variability over the economic cycle. Further details relating to MarketCap/GVA (the ratio of nonfinancial market capitalization to gross-value added, including estimated foreign revenues) and our Margin-Adjusted P/E (MAPE) can be found in the Market Comment Archive under the Knowledge Center tab of this website. MarketCap/GVA: Hussman 05/18/15. MAPE: Hussman 05/05/14, Hussman 09/04/17.
Disclosure Notice
Performance data quoted represents past performance. Past performance does not guarantee future results. Investment return and principal value of an investment will fluctuate so that an investor’s shares, when redeemed, may be worth more or less than their original cost. Current performance may be lower or higher than the performance data quoted. More current performance data through the most recent month-end are available at the Fund’s website www.hussmanfunds.com or by calling 1-800-487-7626.
Investors should consider the investment objectives, risks, and charges and expenses of the Funds carefully before investing. For this and other information, please obtain a Prospectus and read it carefully.
The Hussman Funds have the ability to vary their exposure to market fluctuations depending on overall market conditions, and they may not track movements in the overall stock and bond markets, particularly over the short-term. While the intent of this strategy is long-term capital appreciation, total return, and protection of capital, the investment return and principal value of each Fund may fluctuate or deviate from overall market returns to a greater degree than other funds that do not employ these strategies. For example, if a Fund has taken a defensive posture and the market advances, the return to investors will be lower than if the portfolio had not been defensive. Alternatively, if a Fund has taken an aggressive posture, a market decline will magnify the Fund’s investment losses. The Distributor of the Hussman Funds is Ultimus Fund Distributors, LLC., 225 Pictoria Drive, Suite 450, Cincinnati, OH, 45246.
The Hussman Strategic Market Cycle Fund has the ability to hedge market risk by selling short major market indices in an amount up to, but not exceeding, the value of its stock holdings. However, the Fund may experience a loss even when the entire value of its stock portfolio is hedged if the returns of the stocks held by the Fund do not exceed the returns of the securities and financial instruments used to hedge, or if the exercise prices of the Fund's call and put options differ, so that the combined loss on these options during a market advance exceeds the gain on the underlying index. The Fund also has the ability to leverage the amount of stock it controls to as much as 1 1/2 times the value of net assets, by investing a limited percentage of assets in call options.
The Hussman Strategic Allocation Fund invests primarily in common stocks, bonds, and cash equivalents (such as U.S. Treasury bills and shares of money market mutual funds, aligning its allocations to these asset classes based on prevailing valuations and estimated expected returns in these markets. The investment strategy adds emphasis on risk-management to adjust the Fund’s exposure in market conditions that suggest risk-aversion or speculation among market participants. The Fund may use options and futures on stock indices and Treasury bonds to adjust its relative investment exposures to the stock and bond markets, or to reduce the exposure of the Fund’s portfolio to the impact of general market fluctuations when market conditions are unfavorable in the view of the investment adviser.
The Hussman Strategic Total Return Fund has the ability to hedge the interest rate risk of its portfolio in an amount up to, but not exceeding, the value of its fixed income holdings. The Fund also has the ability to increase the interest rate exposure of its portfolio through limited purchases of Treasury zero-coupon securities and STRIPS. The Fund may also invest up to 30% of assets in alternatives to the U.S. fixed income market, including foreign government bonds, utility stocks, convertible bonds, real-estate investment trusts, and precious metals shares.
The Prospectus of each Fund contains further information on investment objectives, strategies, risks and expenses. Please read the Prospectus carefully before investing.
The Market Climate is not a formula but a method of analysis. The term "Market Climate" and the graphics used to represent it are service marks of Hussman Strategic Advisors (formerly known as Hussman Econometrics Advisors). The Fund Manager has sole discretion in the measurement and interpretation of market conditions. Information relating to the investment strategy of each Fund is described in its Prospectus and Statement of Additional Information. A schedule of investment positions for each Fund is presented in the annual and semi-annual reports. Except for articles specifically citing investment positions held by the Funds, general market commentary does not necessarily reflect the investment position of the Funds.
Membership required
Membership is now required to use this feature. To learn more:
View Membership BenefitsSponsored Content
Upcoming Virtual Events View All