Underlying Inflation Gauges: Trimming Noise or Trimming Signal?
Membership required
Membership is now required to use this feature. To learn more:
View Membership Benefits
By repeatedly describing standard inflation gauges as “imperfect measures of underlying inflation,” Federal Reserve Chair Kevin Warsh has pushed a long-running technical debate into the center of the policy conversation: What is the best way to measure underlying inflation?
With most measures of underlying U.S. inflation still running above the Fed’s 2% target, policymakers are understandably concerned about these gauges and what they mean for the inflation outlook – and for monetary policy.
Our analysis of key measures suggests that underlying U.S. inflation is running around 2.2% to 2.8% through June 2026 relative to a year earlier. That’s well below the 3.3% rate of core Personal Consumption Expenditures (PCE) inflation – how the Fed generally gauges progress toward its inflation target (data as of June 2026, according to the U.S. Bureau of Economic Analysis (BEA)). But relative to other inflation measures, the recent acceleration in core PCE inflation appears to be more of an outlier.
See more: Inflation Since 1872: A Long-Term Look at the CPI
Our base case remains that core inflation will cool over time, and that the Fed likely will keep its policy rate on hold this year. But the risks argue for diligence in monetary policy, and key to managing risk is measuring it.
What is “underlying inflation” and how do we measure it?
Central bank officials have long looked beyond headline and core gauges when assessing underlying inflation. (Core inflation is headline inflation minus the more volatile food and energy categories.) Median and trimmed mean measures are standard across most major developed market central banks, and regional Federal Reserve banks have published their preferred versions for decades.
In essence, underlying inflation measures seek to reduce the potential noise in broader measures and pinpoint persistent trends.
The problem with measured inflation is that in any given month, the distribution of price changes contains a small number of very large, noisy moves that carry little information about the persistent components of inflation. For example, a hurricane-driven spike in used vehicle prices, an event-driven surge in airfares, or an unusually warm winter that leads retailers to discount winter apparel are all price changes that could affect reported inflation but carry little information about persistent inflation.
In theory, “underlying inflation” measures, by discarding such idiosyncratic shocks, can better track the trends. In practice, these underlying measures have historically tracked the medium-term trend in headline inflation more smoothly than core inflation itself has. Indeed, a range of studies have shown headline inflation consistently converging to trimmed inflation measures.
How the underlying inflation gauges can fail
Like any measure, there are limitations embedded in the construction. Trimmed and median measures discard the outliers (called “tails” for their position on a statistical distribution curve) on the assumption that extreme moves are idiosyncratic and one-off. That holds most of the time, but it fails when the tails themselves carry the signal.
The technical issue is called skewness. If the distribution is roughly symmetric, trimming removes offsetting tails and recovers the center. However, if the distribution is persistently skewed in one direction, then the trimmed measure is biased in the other. This is why these gauges are systematically late at turning points: A broad economic or price shock usually enters the inflation index through a small handful of categories first – usually those where prices are more flexible, meaning retailers, wholesalers, or other price-setters can change prices more quickly and easily – and where large price changes all skew in one direction. In a trimmed mean measure, these initial price shocks get discarded as outliers. The turning point only registers once the middle of the distribution joins. By definition, a broadening shock is what the trimmed mean recognizes last.
The 2021–2022 U.S. inflation surge offers a clear illustration. Even as headline PCE moved above 4%, the Dallas Fed Trimmed Mean still sat near 2% as used vehicles, airfares, and categories related to the post-pandemic reopening were trimmed away. This lent statistical respectability to the “transitory inflation” thesis at exactly the moment the distribution’s right skew (i.e., tendency of outlier price changes toward higher prices) was signaling something more persistent.
What complicates real-time diagnosis is that the baseline skew can itself shift. Since the 1990s, the distribution of U.S. price changes has generally been left-skewed – a higher frequency of large price declines. This was overwhelmingly a goods phenomenon: Globalization and falling import costs delivered persistent core goods deflation to the U.S. economy, with apparel, electronics, and household furnishings supplying reliable left-tail ballast. However, prior to that, the pattern of large price changes tended to have a right skew.
The practical question is not whether these underlying inflation measures are well-constructed. It is whether we can distinguish, in real time, between trimming noise and trimming signal.
What the measures are currently saying
There is a range of underlying inflation measures based on both PCE and Consumer Price Index (CPI), many of them developed and published for many years by regional Federal Reserve Banks in Cleveland, Dallas, and Atlanta. Looking across a range of these measures over 25 years (see Figure 1), two points stand out.
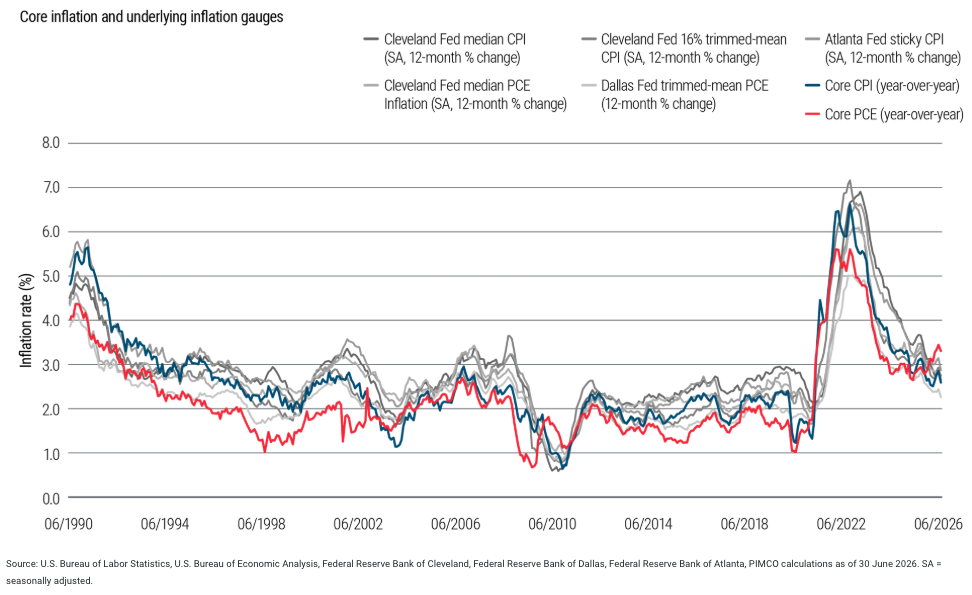
First, as of the most recent readings (June 2026), all of the underlying inflation measures are running above 2% but, importantly, below 3% – the “two-point-something” zone, as we have called it.
Second, comparisons across the various measures show that core PCE inflation (year-over-year) is currently an outlier on the high side. A look at the underlying distribution of recent price changes shows that core PCE skewness has drifted toward zero from its typical left-skew territory, largely due to fewer goods price declines and large increases. We haven’t seen that same skew drift in CPI, although the price sources are very similar.
Acceleration in core PCE – signal or noise?
Whether the recent acceleration in core PCE is signal or noise really comes down to whether price changes in the tails of the distribution are idiosyncratic or a foreshadowing of a broadening in inflation. Despite some concerning signs from the shifting skew, we see good reasons to believe that it’s more noise than signal.
First, in addition to core PCE inflation decoupling from measures of its underlying trend, it has also decoupled from core CPI. In 2022, both core CPI and core PCE were accelerating before their respective underlying inflation measures, as both measures realized a higher frequency of large price shocks before we witnessed more generalized price increases. This time, the right skew is more specific to measured PCE inflation.
Second, the current gap between core CPI and core PCE can be largely explained by weight and scope differences of two categories that are arguably overstating inflationary pressures and have realized a higher frequency of large price jumps – portfolio management services and software-related categories (see Figure 2). Both have been heavily influenced by AI-related developments, including strong equity market performance reflected in management fees along with rapidly rising prices for certain technology inputs. And both arguably overstate underlying inflation trends. The software price index doesn’t currently fully account for rapid quality improvements (cloud services, AI functionality, software bundling) and relies on a CPI series that does not perfectly match the underlying PCE category. Meanwhile, the current portfolio management category treats higher dollar fees paid resulting from rising asset prices as inflation. Conceptually, fees captured as a percentage of assets under management (a measure that has been generally declining) are likely a truer measure of the price of portfolio services. The BEA has already announced methodological improvements that are expected to lower reported year-over-year PCE inflation by roughly 0.2–0.3 percentage points.
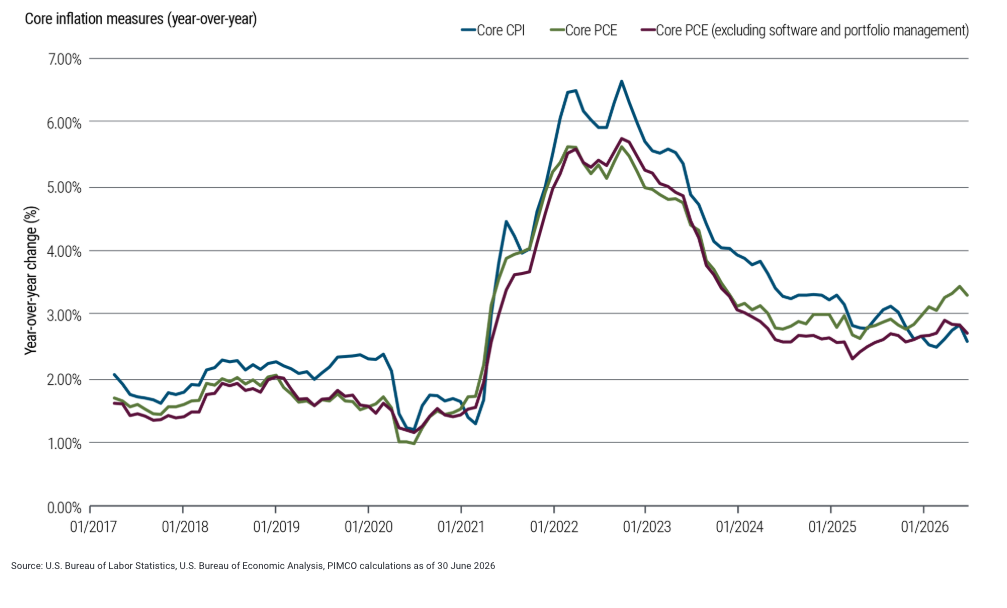
Third, these measures just provide a gauge of underlying inflation today, which could itself be driven by larger fundamental developments, such as supply shocks, that should ultimately fade. The acceleration in core goods prices that has shifted the skew of the distribution of price increases is likely to diminish as price pressures from tariffs, energy, and AI-related components diminish. Furthermore, as my colleague Richard Clarida recently reminded us, over time measures of core inflation do tend to converge to labor costs, and right now unit labor cost inflation (according to the Bureau of Labor Statistics) is firmly in line with the Fed’s 2% target.
Implications
Overall, there are good reasons to believe the inflationary signals coming from underlying inflation gauges. Despite the wide range of shocks over the past two years, underlying inflation still appears to be in the two-point-something zone. While central banks may be grappling with the more general question of whether they should do more to combat inflation that is persistently above 2% amid a higher frequency of global supply shocks, evidence that the underlying trend hasn’t changed meaningfully recently reduces the urgency to shift policy quickly.
In the end, the heightened focus on the various measures and what they could be signaling is good news for policy credibility. While inflation looks broadly contained at slightly above-target levels, we have no doubt that the central bank, referencing a broad array of imperfect measures, will set policy amid changing developments and bring inflation back to its 2% target over time.
A message from Advisor Perspectives and VettaFi: Discover something new! Click here to register for our upcoming webcasts.
Disclosures
Statements concerning financial market trends or portfolio strategies are based on current market conditions, which will fluctuate. There is no guarantee that these investment strategies will work under all market conditions or are appropriate for all investors and each investor should evaluate their ability to invest for the long term, especially during periods of downturn in the market. Outlook and strategies are subject to change without notice.
PIMCO as a general matter provides services to qualified institutions, financial intermediaries and institutional investors. Individual investors should contact their own financial professional to determine the most appropriate investment options for their financial situation. This material contains the opinions of the manager and such opinions are subject to change without notice. This material has been distributed for informational purposes only and should not be considered as investment advice or a recommendation of any particular security, strategy or investment product. Information contained herein has been obtained from sources believed to be reliable, but not guaranteed. No part of this material may be reproduced in any form, or referred to in any other publication, without express written permission. PIMCO is a trademark of Allianz Asset Management of America LLC in the United States and throughout the world.
© PIMCO
Membership required
Membership is now required to use this feature. To learn more:
View Membership BenefitsSponsored Content
Upcoming Virtual Events View All