Sharpe Is Back in Emerging Markets
Membership required
Membership is now required to use this feature. To learn more:
View Membership BenefitsKey takeaways
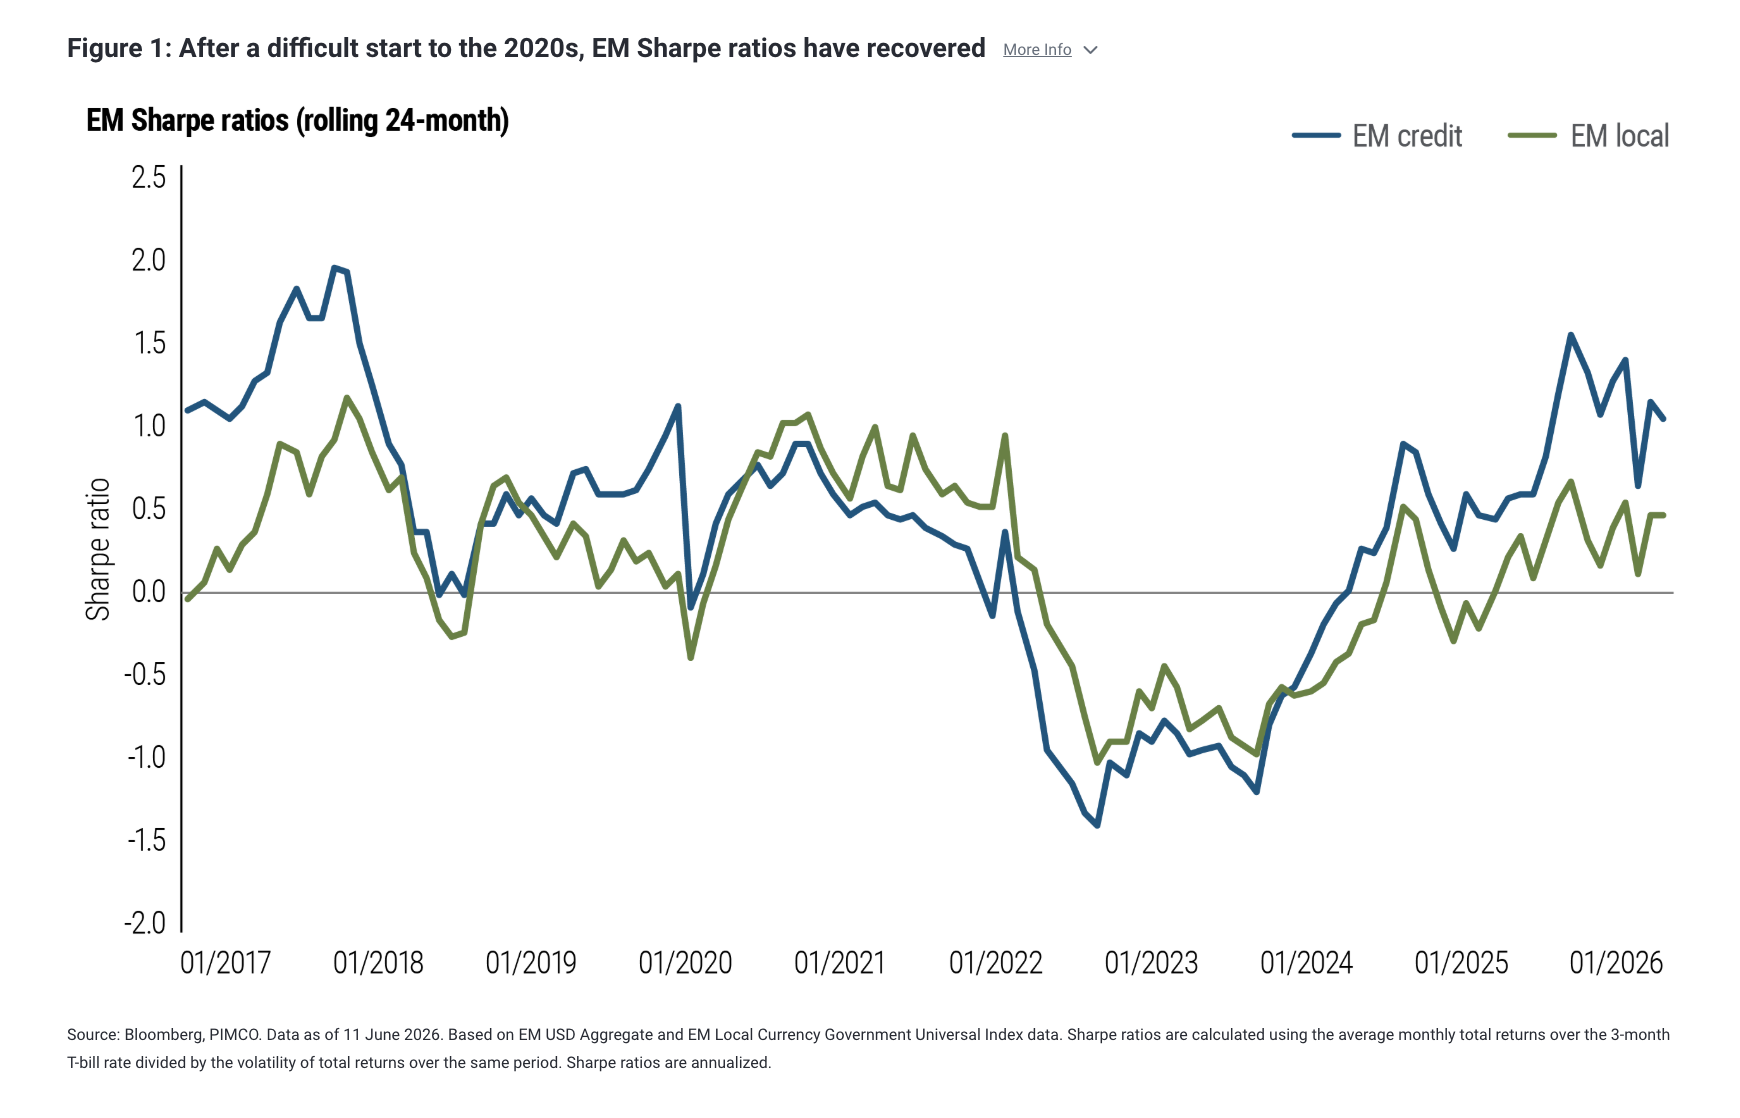
- Emerging market (EM) fixed income's risk-adjusted profile has meaningfully improved. Sharpe ratios across EM credit and local rates have rebounded, with EM credit delivering one of the strongest risk-adjusted performances in fixed income over the past two years.
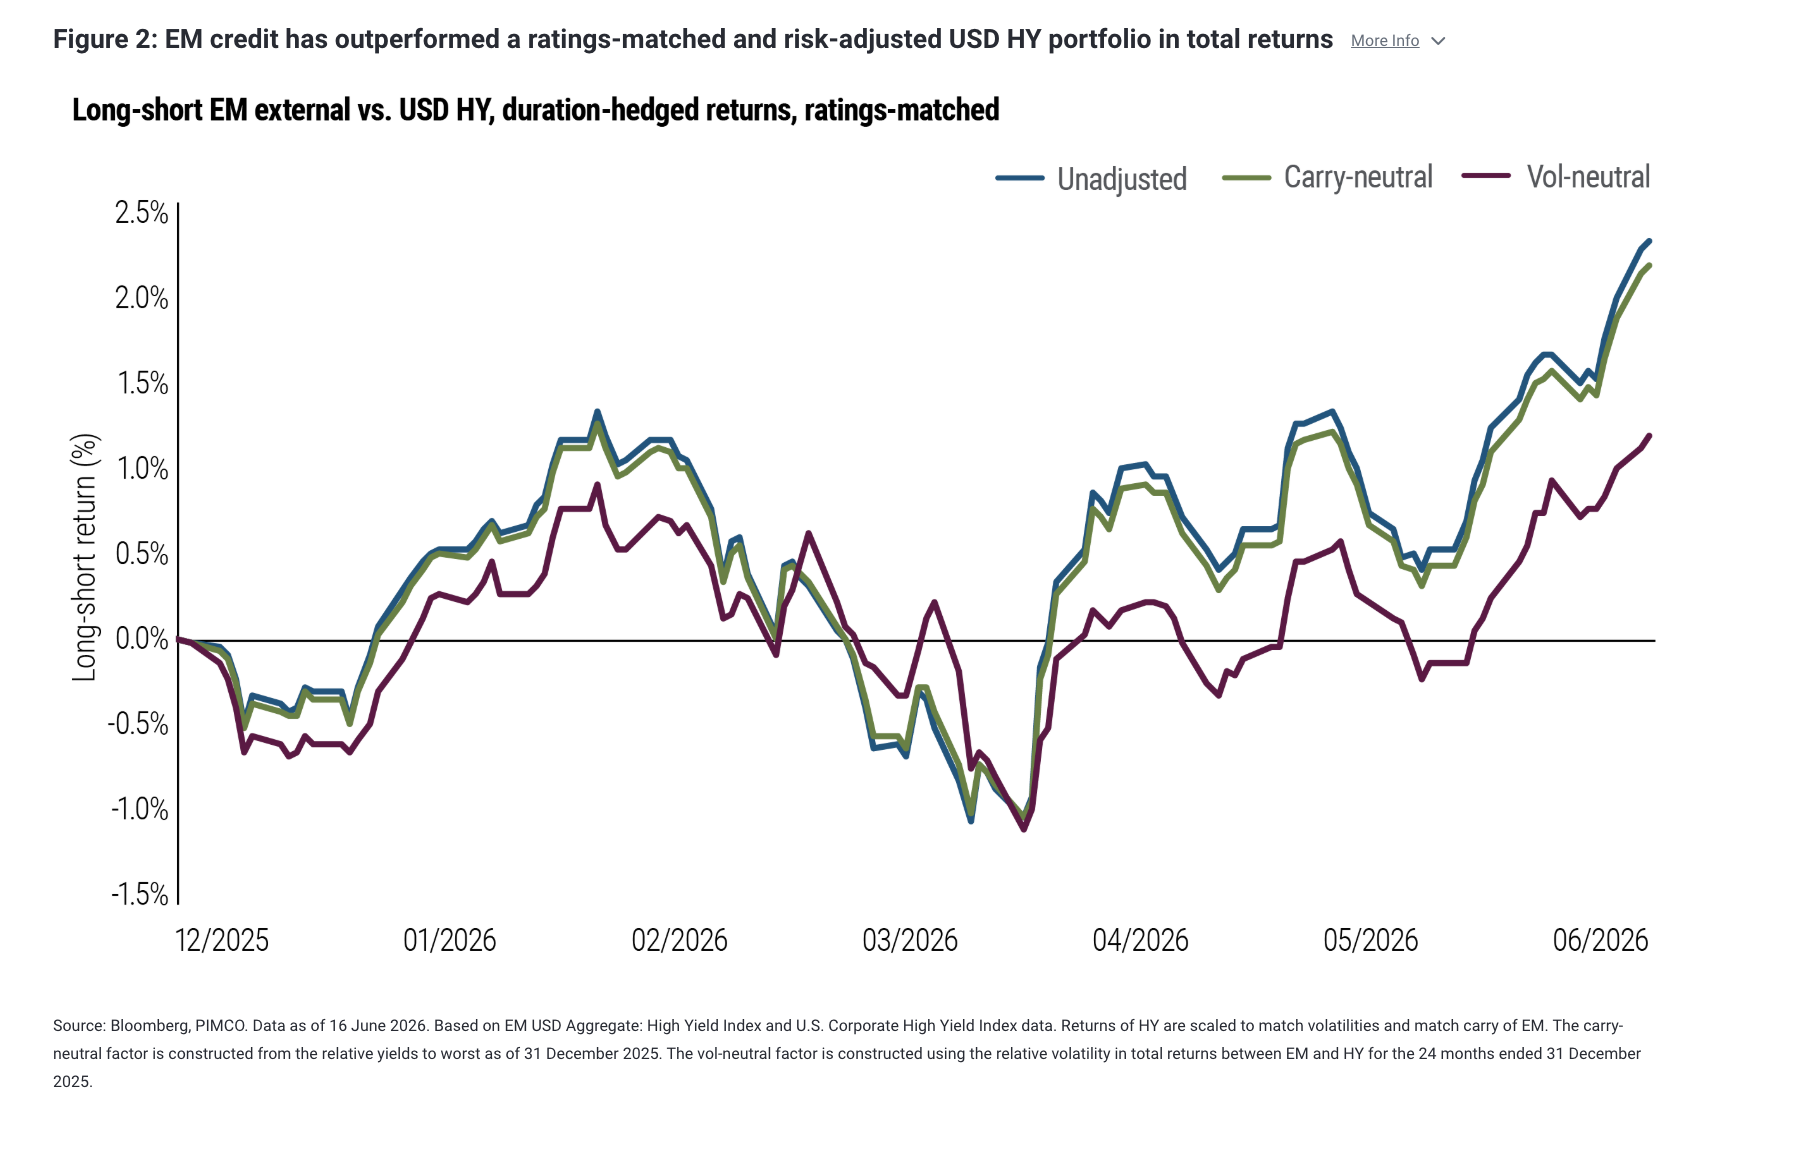
- The outperformance reflects more than higher yields. Even after matching ratings and stripping out duration, EM credit has outpaced comparable U.S. high yield year-to-date – evidence of relative value.
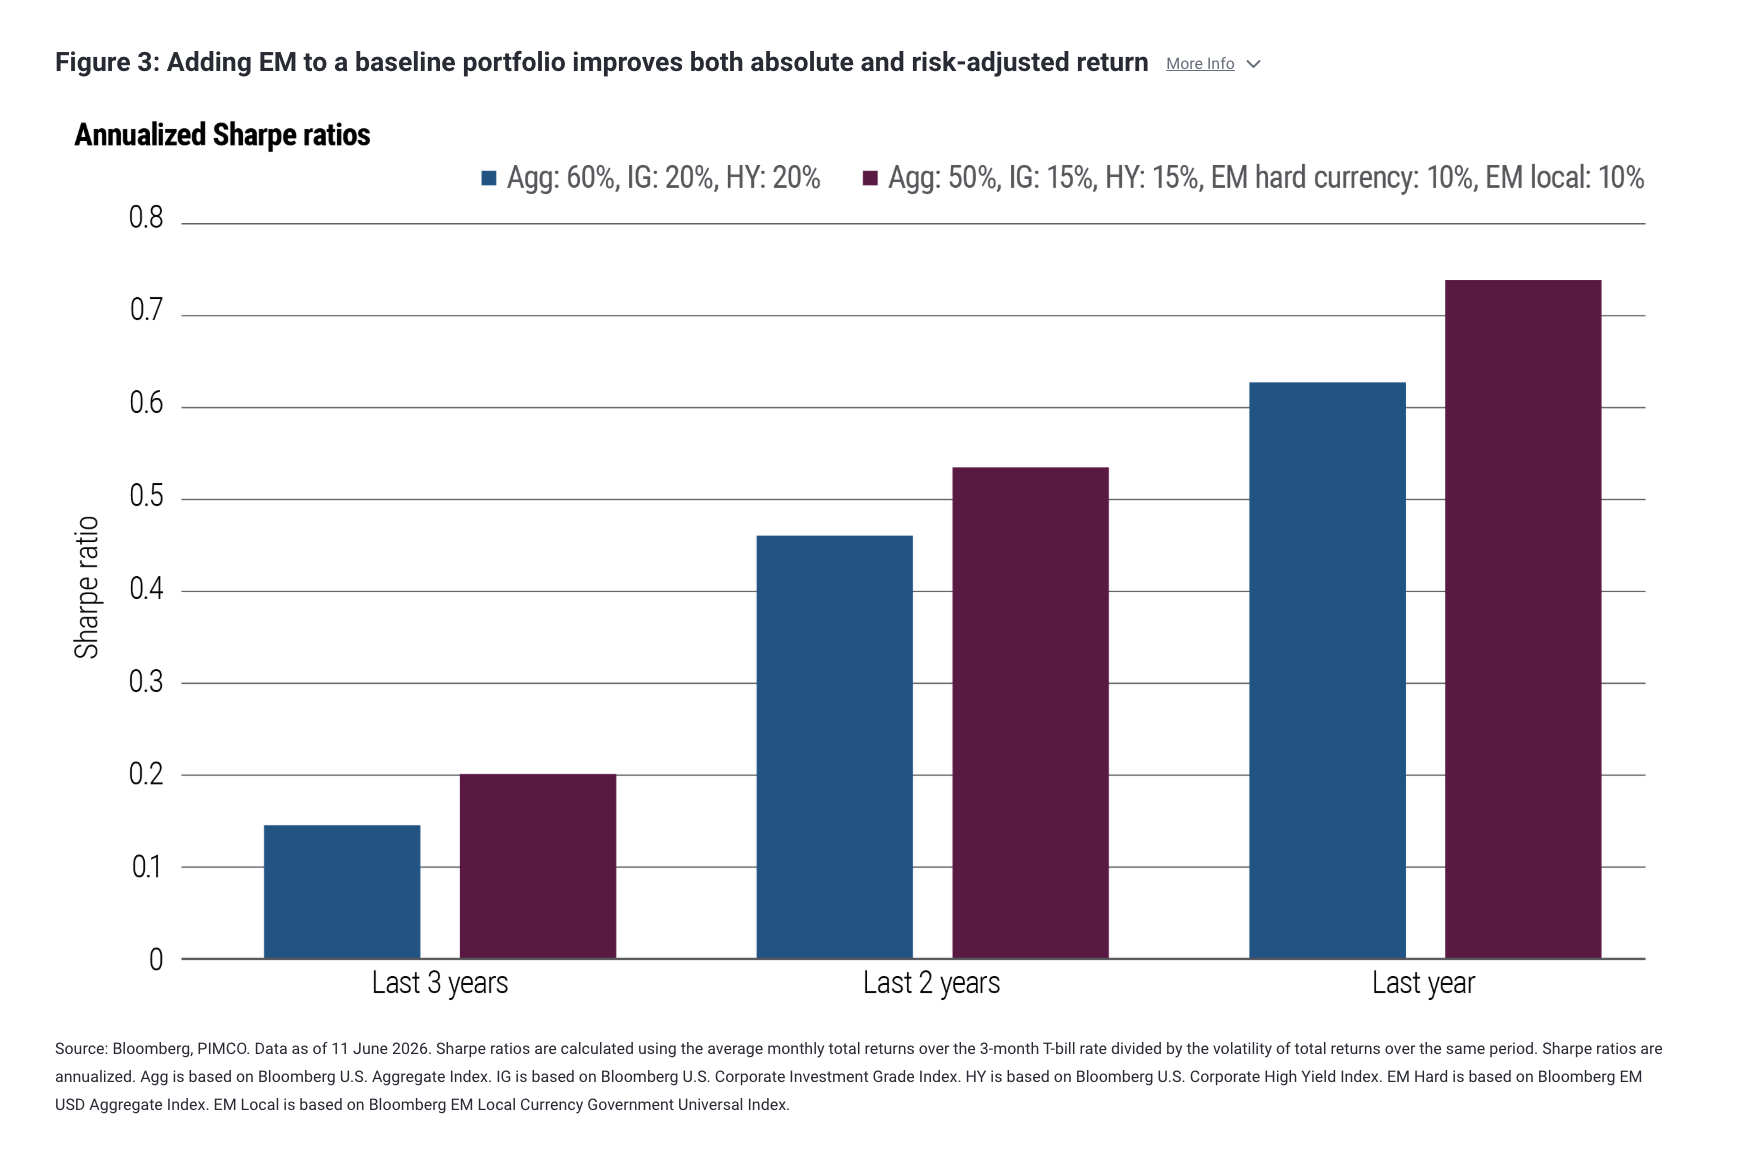
- The case for EM in multi-asset portfolios remains intact, though the next leg may be more selective. With index level valuations now less compelling, dispersion across issuers and yield curves may drive risk-adjusted opportunity.
Emerging market (EM) assets have continued to perform well this year despite geopolitical headwinds and a generally stronger U.S. dollar. Figure 1 shows that, after several years of structurally lower Sharpe ratios – a gauge of risk-adjusted return – the asset class has begun to recover. EM credit, in particular, has delivered one of the strongest risk-adjusted performances across fixed income over the past two years. The more interesting question, however, is no longer whether EM has been worth owning, but how to own it from here.
Read more: Hawkish-Leaning Committee, Reform-Minded Chair: Warsh’s First Fed Meeting
Part of that outperformance reflects higher starting yields and the extra compensation investors demand for EM’s higher volatility. But that is not the whole story. Figure 2 compares year-to-date total returns with those of a ratings-matched U.S. dollar high yield (USD HY) benchmark constructed to mirror the EM HY index’s BB, B, and CCC rating weights. (While EM debt is now mostly investment grade, here we are focusing on the HY component as an analytical exercise.) Even on that basis, and even after stripping out duration, EM has outperformed USD HY. Relative-value advantages of this significance can be a feature of maturing asset classes – and tend to compress as that maturation progresses.
For multi-asset fixed income investors, the more relevant question is what EM adds to a broader portfolio. Figure 3 addresses that directly by comparing ex-post annualized Sharpe ratios for portfolios with and without EM. Starting from a baseline mix of 60% Agg, 20% IG, and 20% HY, we then add EM external and local assets, funded from HY and Agg. We see that EM has lifted total returns without reducing return per unit of risk.
A shifting opportunity
How durable is this EM recovery? On many metrics, this is not the EM fixed income universe of past cycles. The external vulnerabilities that defined earlier EM crises have given way to more common risks like domestic and fiscal considerations, which typically evolve more gradually.
Deep local rates markets, often funded by domestic savings, have largely reduced the foreign exchange (FX)-mismatch vulnerabilities that shaped the late 1990s. At the same time, many EM central banks strengthened their credibility after COVID by hiking interest rates ahead of the Federal Reserve and engineering soft landings for their economies.
Taken together, these shifts argue for structurally lower risk premia than history would suggest and support EM fixed income’s continued role in multi-asset portfolios. At the same time, the maturation that has compressed the beta opportunity is now widening the dispersion across issuers, sovereigns, and curves.
From here, the forward Sharpe story is increasingly idiosyncratic: The same valuation constraints facing developed market (DM) credit portfolios also loom large in EM credit, shifting the opportunity set toward more selective situations. In local rates, as in G10, the repricing of the front end of yield curves after the Iran shock leaves room for some relief if tensions ease, particularly in high-yielding markets.
But dispersion is likely to remain elevated given differing domestic macro fundamentals. Inflation, for example, is still rising in parts of EM, notably Asia, where policy remains accommodative and limits the scope for a sustained rally. By contrast, markets such as South Africa and Mexico – where policy is restrictive and inflation appears closer to peaking – look better positioned for more durable gains.
Disclosures
Statements concerning financial market trends or portfolio strategies are based on current market conditions, which will fluctuate. There is no guarantee that these investment strategies will work under all market conditions or are appropriate for all investors and each investor should evaluate their ability to invest for the long term, especially during periods of downturn in the market. Outlook and strategies are subject to change without notice.
Past performance is not a guarantee or a reliable indicator of future results. Forecasts, estimates and certain information contained herein are based upon proprietary research and should not be considered as investment advice. There is no guarantee that results will be achieved.
All Investments contain risk and may lose value. Investing in the bond market is subject to risks, including market, interest rate, issuer, credit, inflation risk, and liquidity risk. Investing in foreign-denominated and/or -domiciled securities may involve heightened risk due to currency fluctuations, and economic and political risks, which may be enhanced in emerging markets. High yield, lower-rated securities involve greater risk than higher-rated securities; portfolios that invest in them may be subject to greater levels of credit and liquidity risk than portfolios that do not. Sovereign securities are generally backed by the issuing government. The credit quality of a particular security or group of securities does not ensure the stability or safety of the overall portfolio.
Yield to Worst (YTW) is the estimated lowest potential yield that can be received on a bond without the issuer actually defaulting. The YTW is calculated by making worst-case scenario assumptions by calculating the returns that would be received if provisions, including prepayment, call, or sinking fund, are used by the bond's issuer. The measure does not reflect the deduction of fees and expenses and is not necessarily indicative of a portfolio's worst possible performance.
References to specific securities and their issuers are not intended and should not be interpreted as recommendations to purchase, sell or hold such securities. PIMCO products and strategies may or may not include the securities referenced and, if such securities are included, no representation is being made that such securities will continue to be included.
PIMCO as a general matter provides services to qualified institutions, financial intermediaries and institutional investors. Individual investors should contact their own financial professional to determine the most appropriate investment options for their financial situation. This material contains the opinions of the author and such opinions are subject to change without notice. This material has been distributed for informational purposes only and should not be considered as investment advice or a recommendation of any particular security, strategy or investment product. Information contained herein has been obtained from sources believed to be reliable, but not guaranteed. No part of this material may be reproduced in any form, or referred to in any other publication, without express written permission. PIMCO is a trademark of Allianz Asset Management of America LLC in the United States and throughout the world.
CMR2026-0617-5590572
A message from Advisor Perspectives and VettaFi: Discover something new! Click here to register for our upcoming webcasts.
© PIMCO
Membership required
Membership is now required to use this feature. To learn more:
View Membership BenefitsSponsored Content
Upcoming Virtual Events View All


