Last week's economic narrative was dominated by a surge in retail sales as consumers seemingly bought ahead of tariffs while a volatile stock market experienced a sharp mid-week sell-off following a Federal Reserve warning on tariff uncertainty. While March saw a significant jump in consumer spending, this pre-tariff strength is unlikely to be sustained. The Fed's cautious outlook on the economic impact of tariffs rattled investors, leading to a notable downturn in equities on Wednesday. Meanwhile, other indicators like industrial production and builder confidence offered a mixed picture, further underscoring the uncertainty that tariffs are injecting into the economic outlook.
Retail Sales
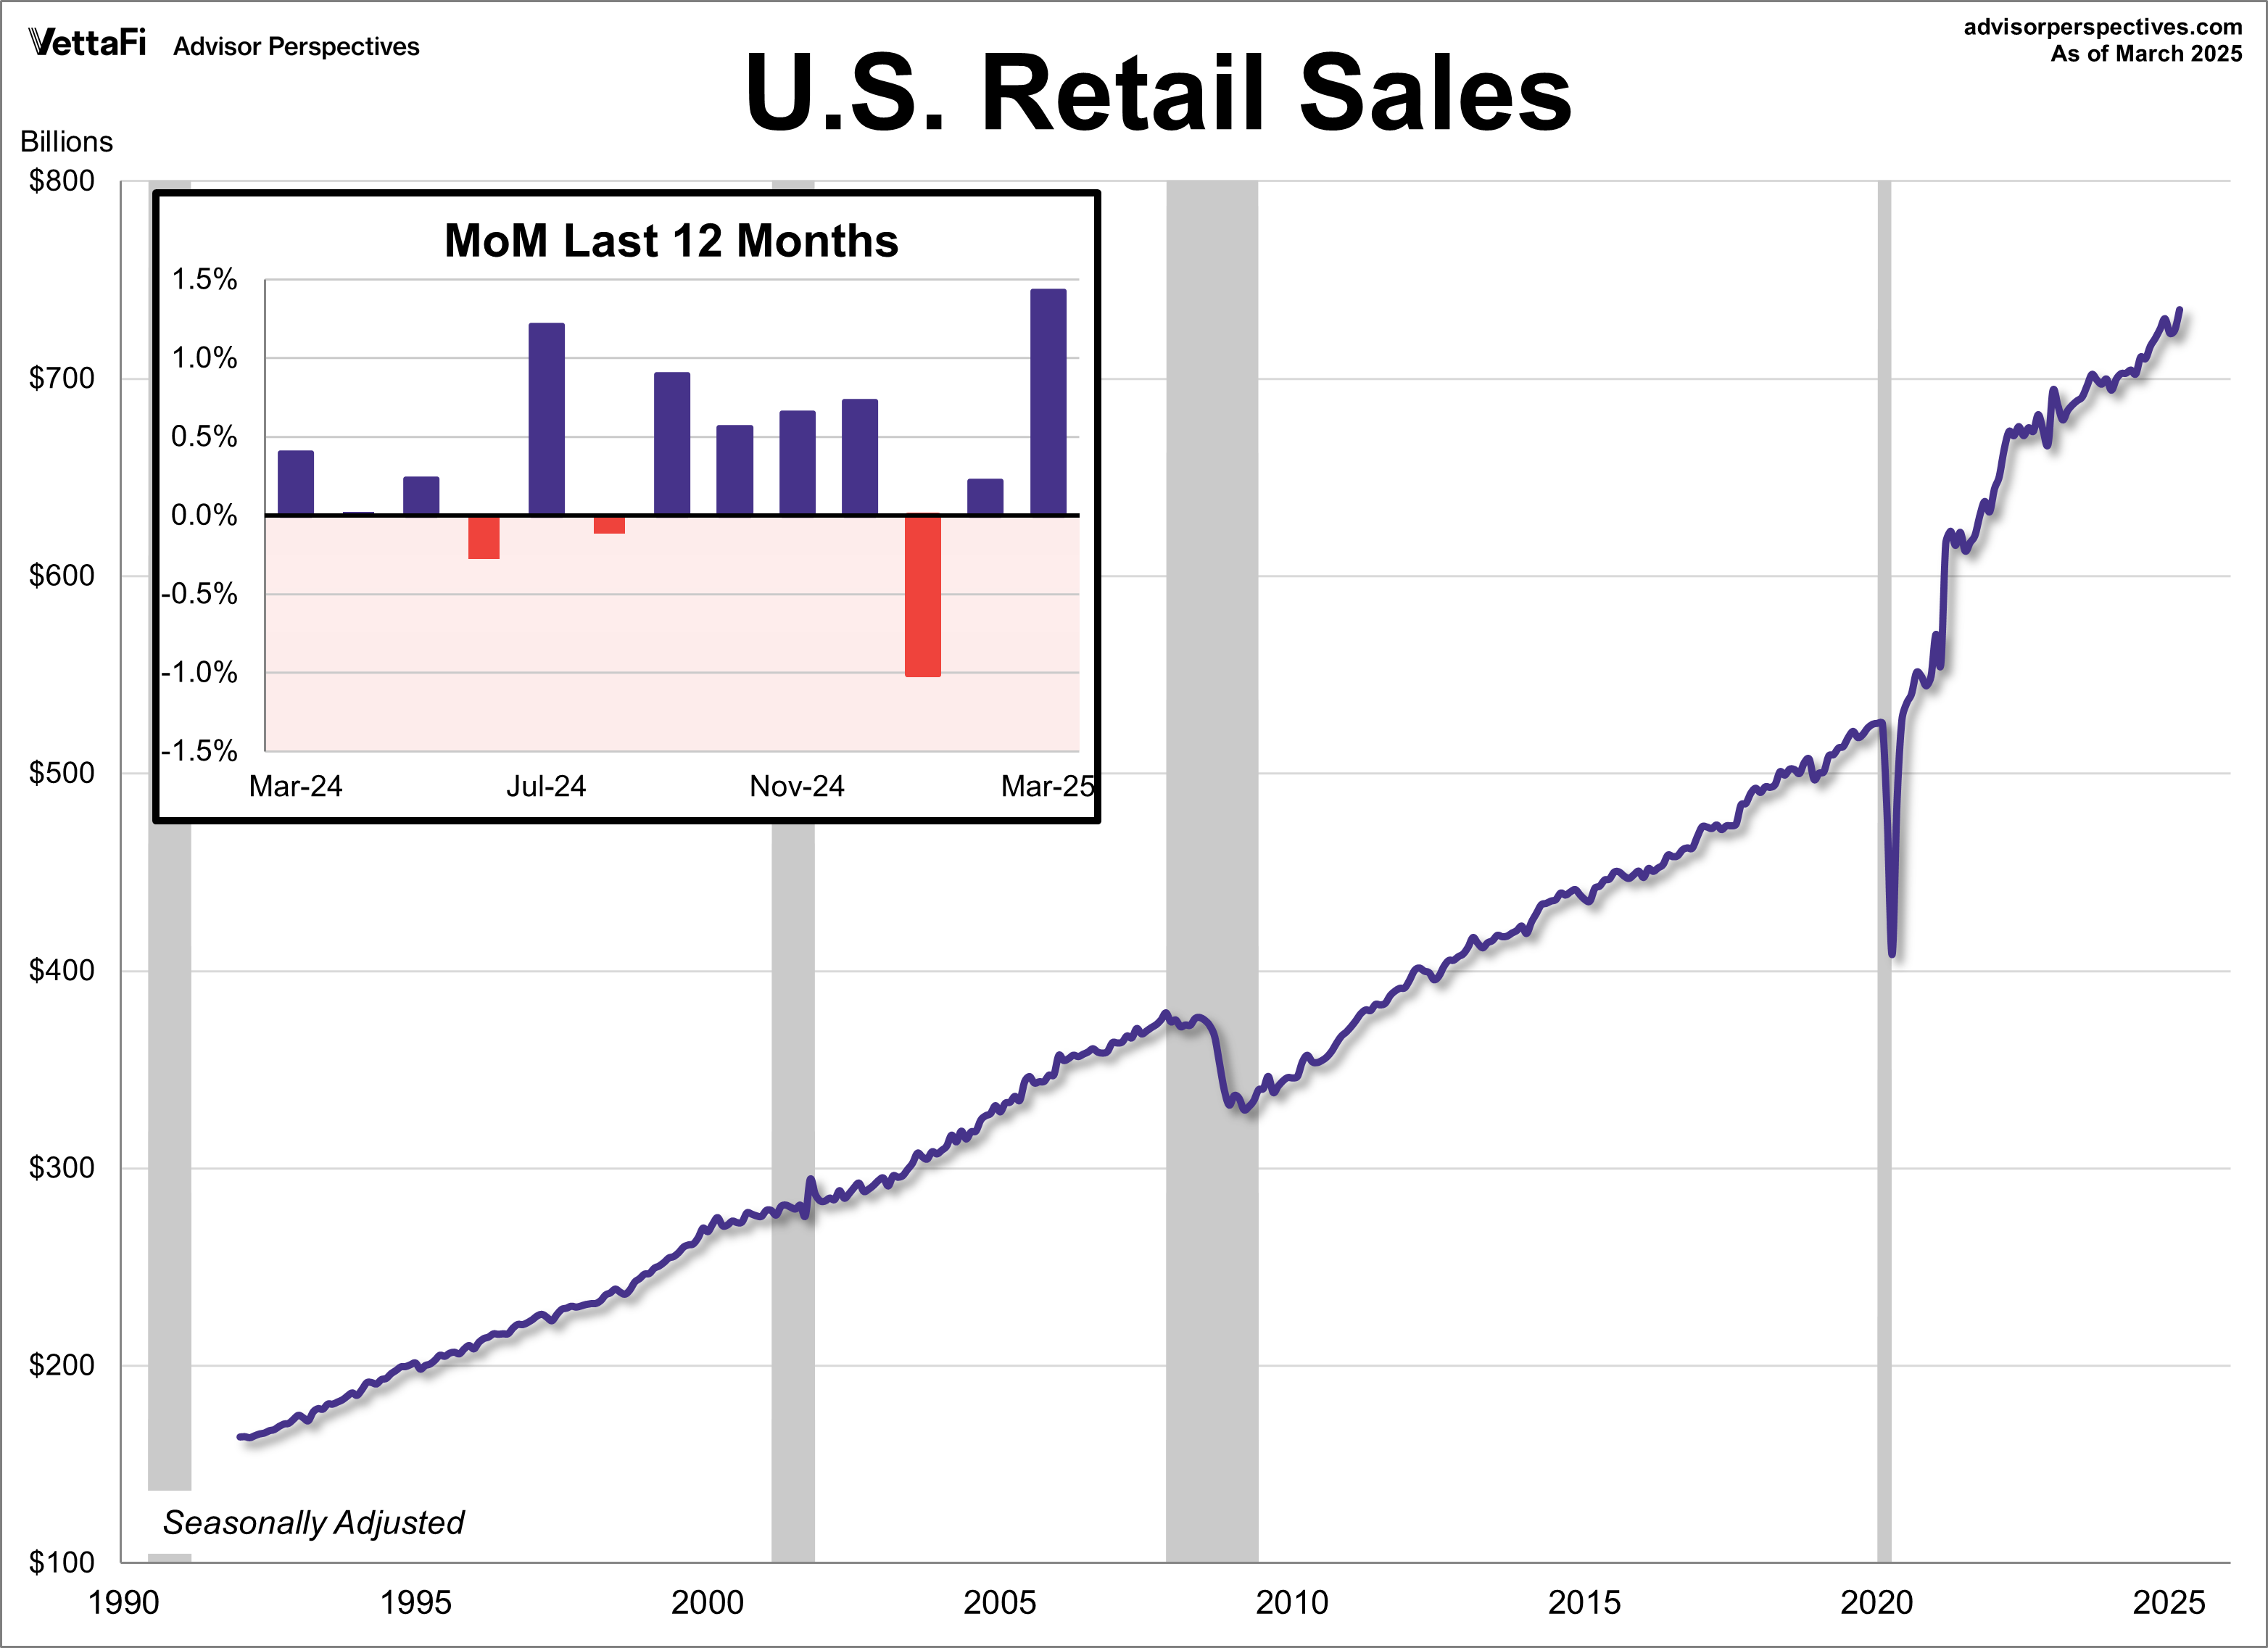
U.S. consumer spending saw its biggest jump in more than two years last month as consumers frontloaded purchases ahead of tariffs. Retail sales surged 1.4%, more than the expected 1.3% growth. Core sales, which exclude autos, also came in higher than expected, rising 0.5% from February. Meanwhile control purchases — a crucial GDP input — were up 0.3%, lower than the expected 0.6% growth.
The spike in sales last month was driven by increased sales at motor vehicle dealers (5.3%), building materials (3.3%), sporting goods, hobby, musical, and bookstores (2.4%), and restaurants and bars (1.8%). On the other end, there was a sharp pullback in spending at gas stations (-2.5%) and furniture stores (-0.7%).
While recent data indicates ongoing consumer resilience, it precedes President Trump's tariff announcement. Despite this current strength, consumer sentiment is trending downwards to historic lows. Coupled with potential inflationary pressures from tariffs, future retail sales data may reveal weakening consumer demand.
Retail sales could impact the SPDR S&P Retail ETF (XRT), VanEck Retail ETF (RTH), Amplify Online Retail ETF (IBUY), and ProShares Online Retail ETF (ONLN).

Industrial Production
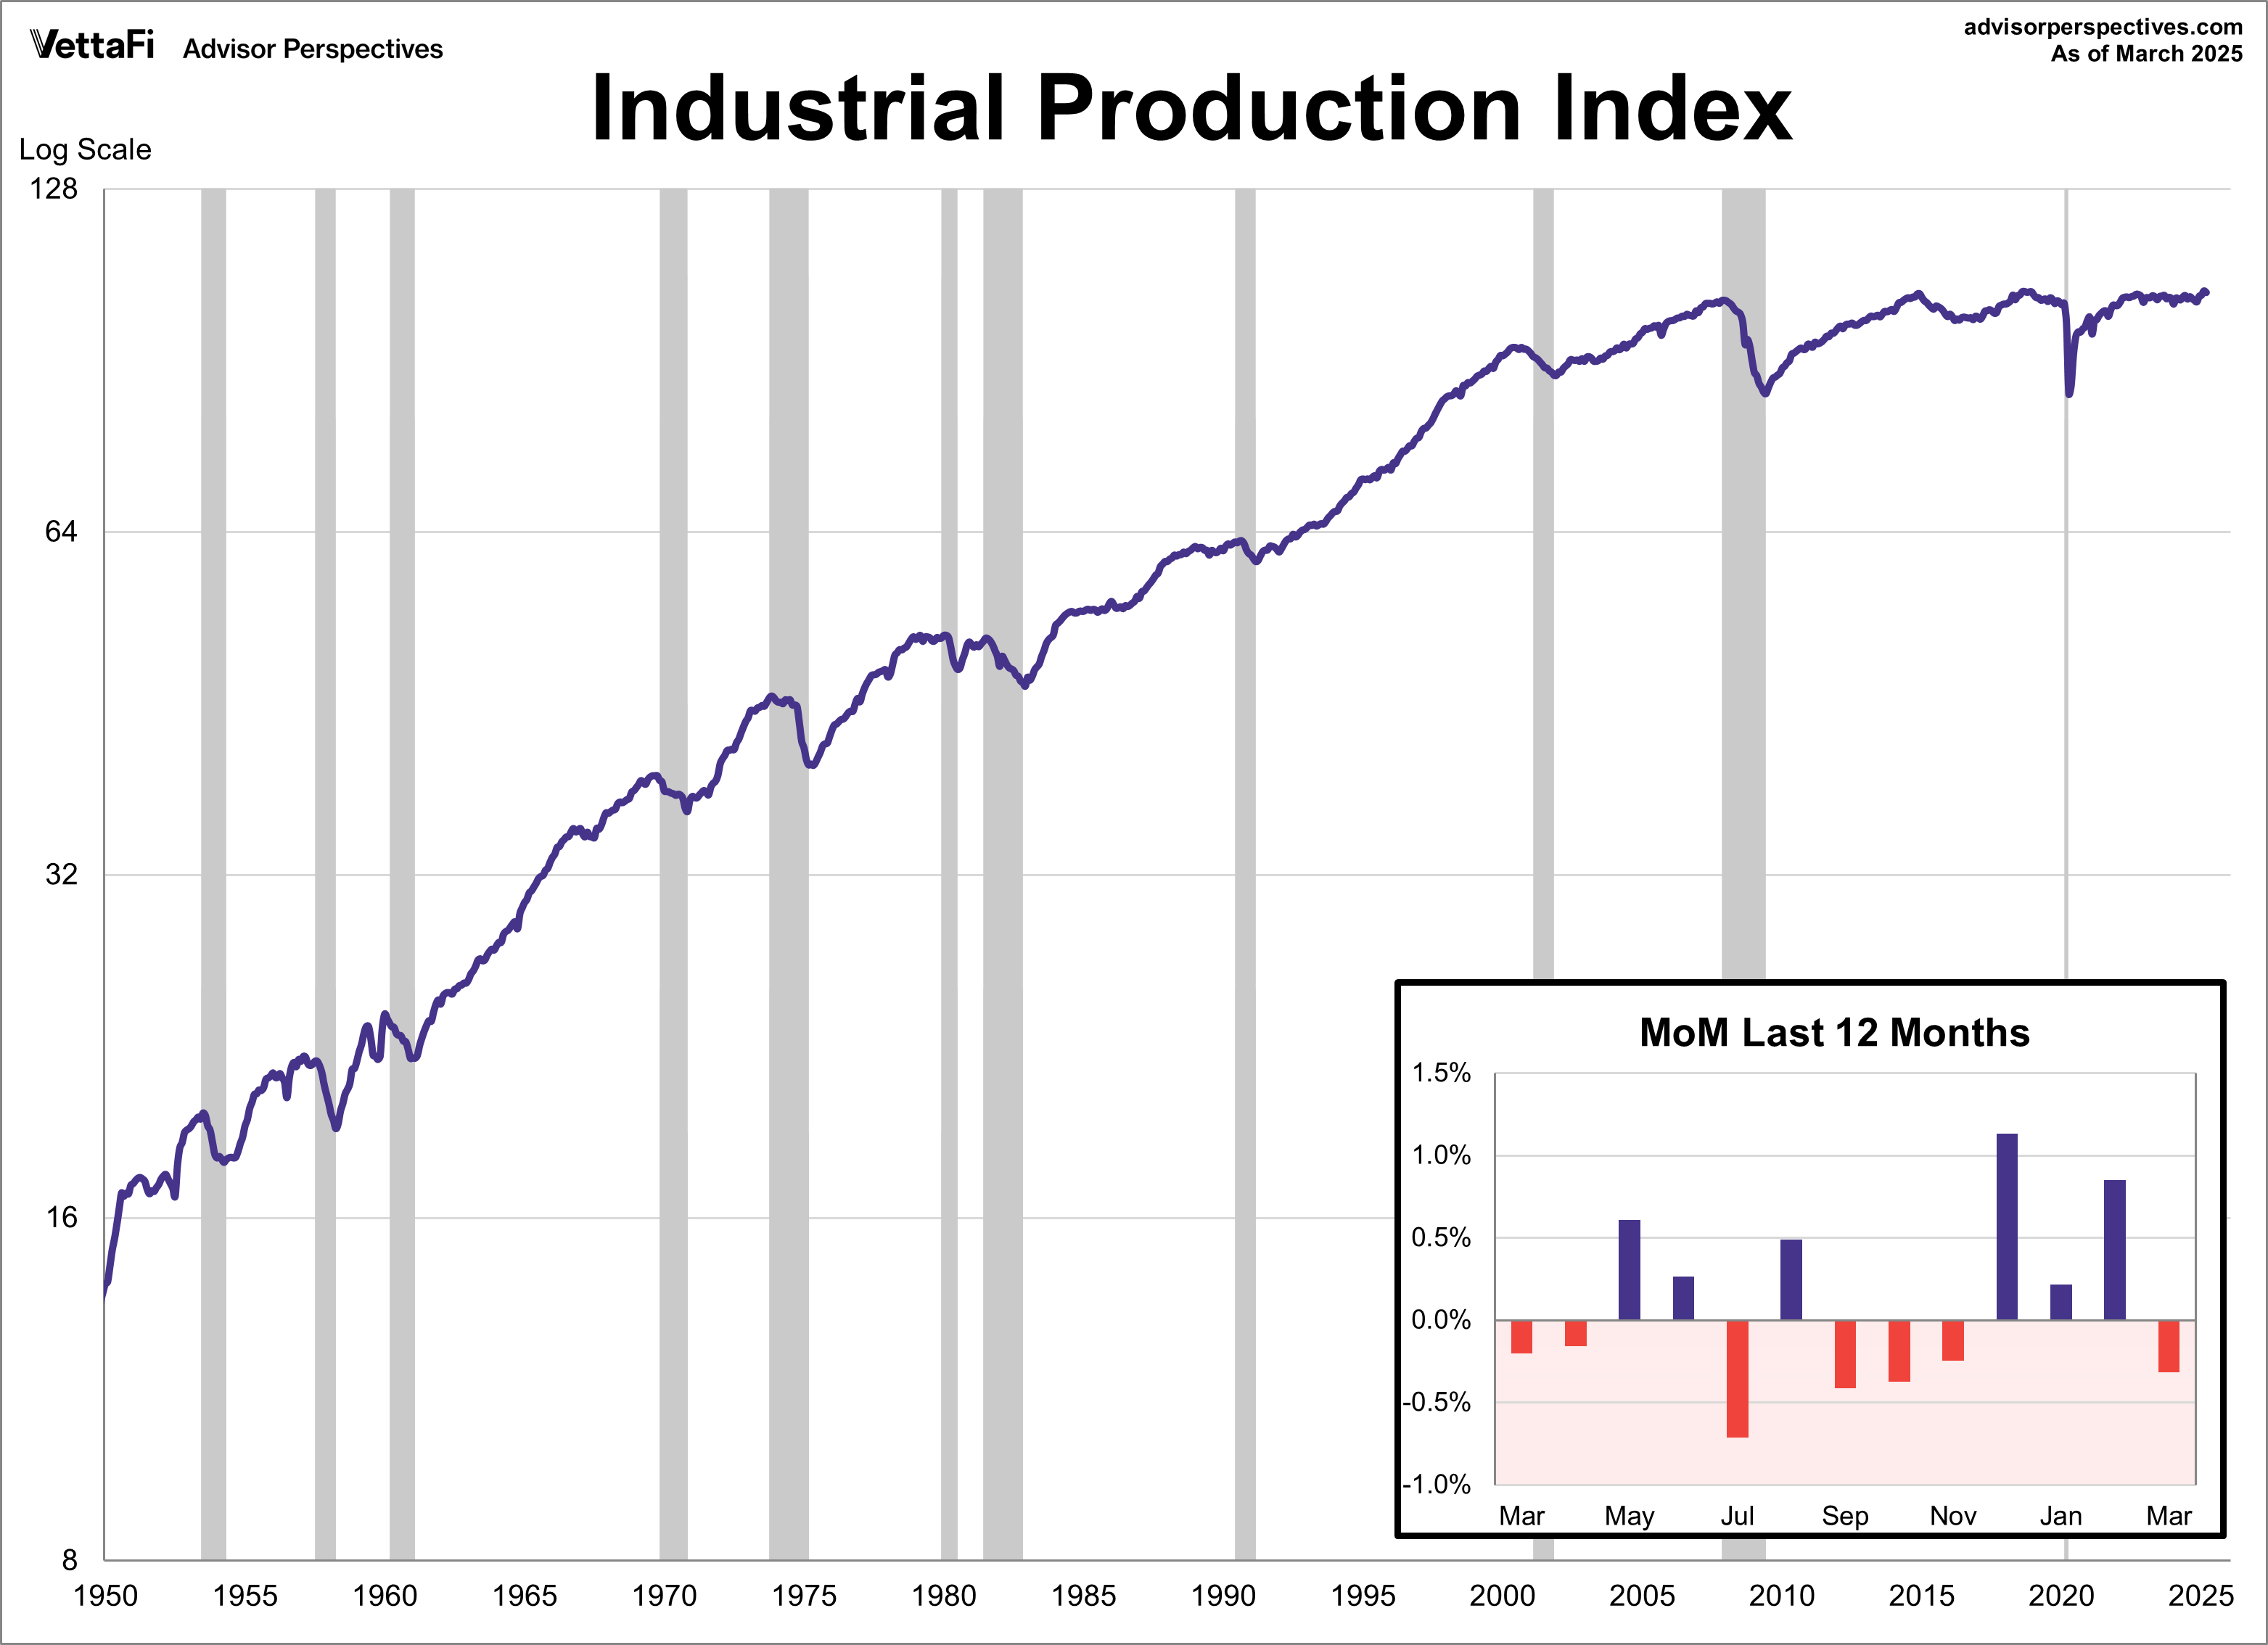
U.S. factory output decreased for the first time since November last month. Industrial production fell 0.3% in March, more than the expected 0.2% decline. A closer look revealed that the decline can be largely attributed to the utilities sector, which was down 5.8% from the previous month from warmer-than-usual temperatures. Compared to one year ago, industrial production was up 1.3%, marking the fourth consecutive month of annual growth.
Capacity utilization, which measures the amount of slack in the economy by comparing current production output to its maximum potential output, was also down last month. The capacity utilization index fell 0.4% from the previous to 77.8%, falling short of the 78.0% forecast.
Industrial production could impact the Industrial Select Sector SPDR Fund (XLI).
NAHB Housing Market Index
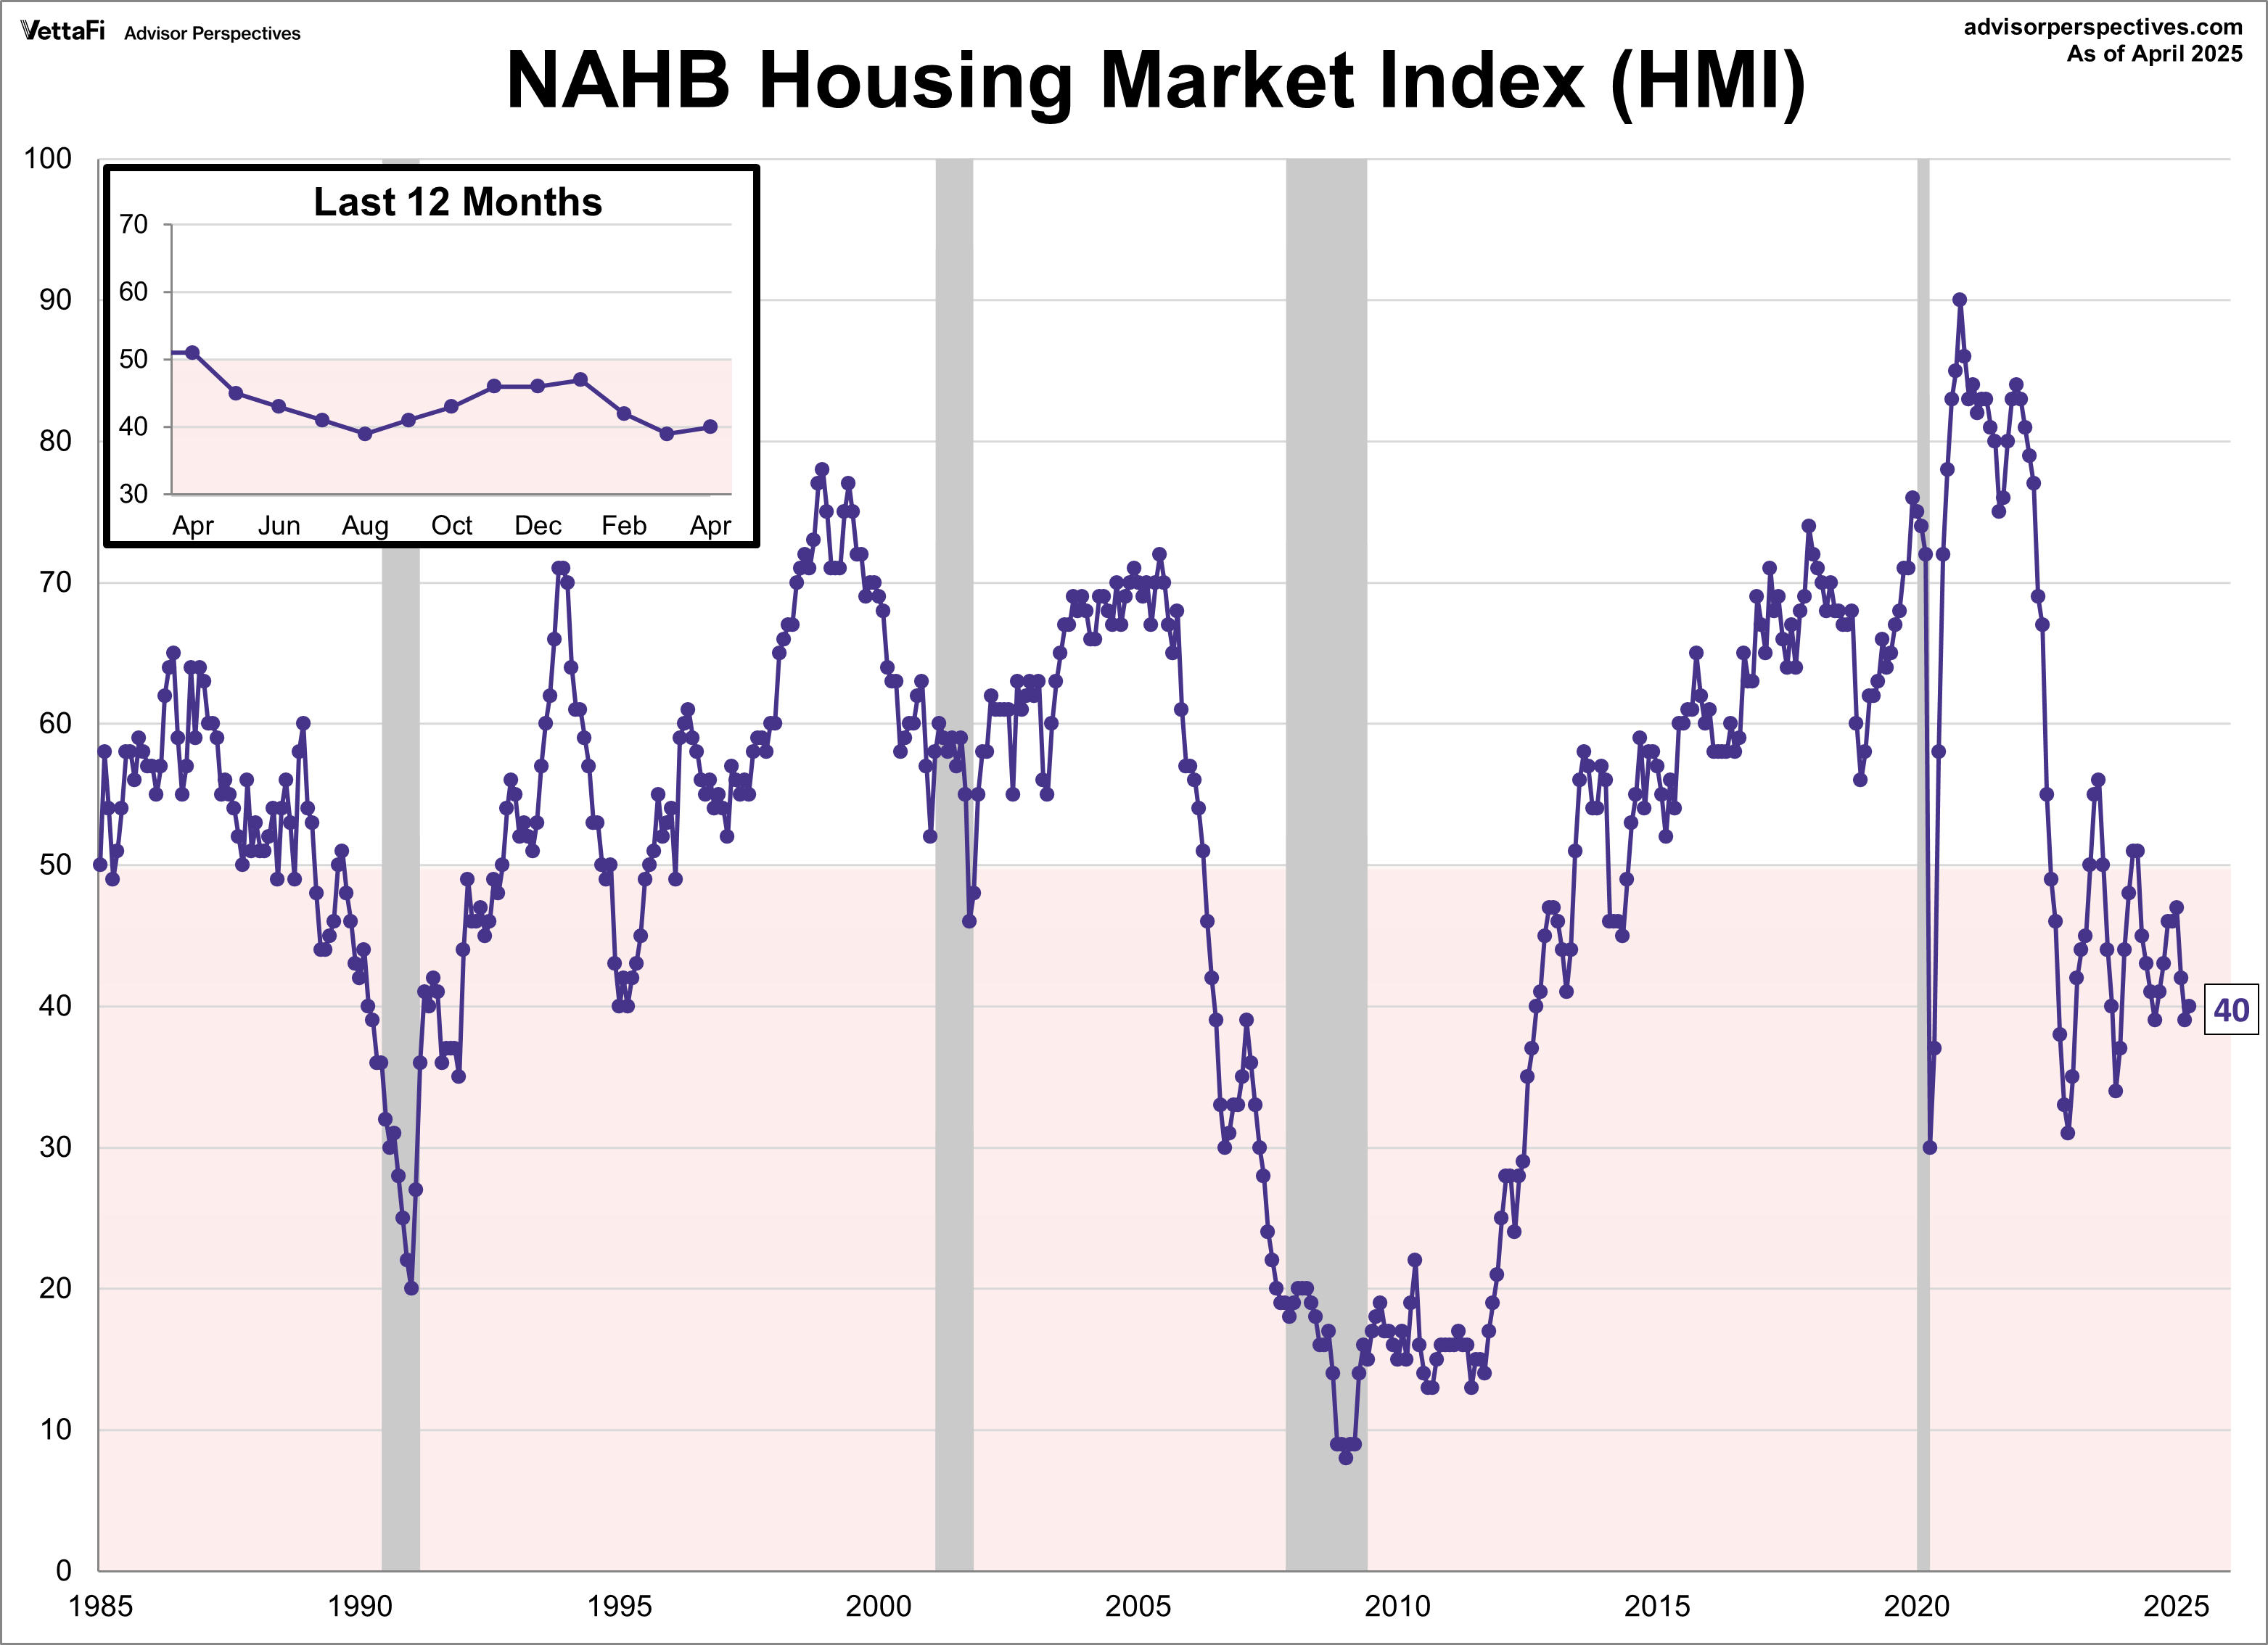
Builder confidence inched up in April thanks to a recent retreat in mortgage rates. However, economic uncertainty coming from tariff threats and elevated construction costs continue to weigh on sentiment. The NAHB Housing Market Index, which measures builder opinion on current and future home sales, rose one point to 40 this month. This marks the twelfth consecutive month of negative builder sentiment, the longest streak since the housing crisis from the mid-2000s. The latest reading was above the 38 forecast.
The index is calculated based on three components: current sales, expected sales over the next six months, and prospective buyer traffic. In April, current sales and prospective buyer traffic each rose for the first time since January but remained subdued. Meanwhile, expected sales fell to their lowest level since November 2023.
Builder confidence could impact home builders and residential real-estate ETFs such as Invesco Dynamic Building & Construction ETF (PKB), iShares U.S. Home Construction ETF (ITB), SPDR S&P Homebuilders ETF (XHB), and iShares Residential and Multisector Real Estate ETF (REZ).
Market Reactions
The S&P 500 formed a death cross this week, a pattern where the index's 50-day moving average crossed below its 200-day moving average. As a result, the SPDR S&P 500 ETF Trust (SPY) fell 1.4% last week. Meanwhile, the S&P Equal Weight Index was up 0.3% from the previous week and the Invesco S&P 500® Equal Weight ETF (RSP) rose 0.4%.
The yield on the 10-year note ended April 17, 2025 at 4.34% while the 2-year note ended at 3.81%.
The CME FedWatch Tool currently shows a 90% likelihood that the Fed will hold rates steady at their meeting next month. Markets are pricing in four 25 basis point cuts for later this year coming at the June, July, October, and December meetings. Additionally, one 25 basis point cut is projected in 2026.
Economic Data in the Week Ahead
The economic calendar for the upcoming week includes releases on consumer sentiment, housing market activity, and manufacturing sector strength. Key indicators will include the University of Michigan's Consumer Sentiment Index, reports on new and existing home sales, durable goods orders, and regional surveys from the Richmond and Kansas City Feds. The Chicago Fed National Activity Index will also provide a broad overview of economic activity. While perhaps not as widely followed as other indicators, these releases are still important pieces of the larger economic puzzle.
For more news, information, and strategy, visit the Innovative ETFs Channel.
A message from Advisor Perspectives and VettaFi: To learn more about this and other topics, check out our podcasts.
Read more commentaries by VettaFi