Key Takeaways
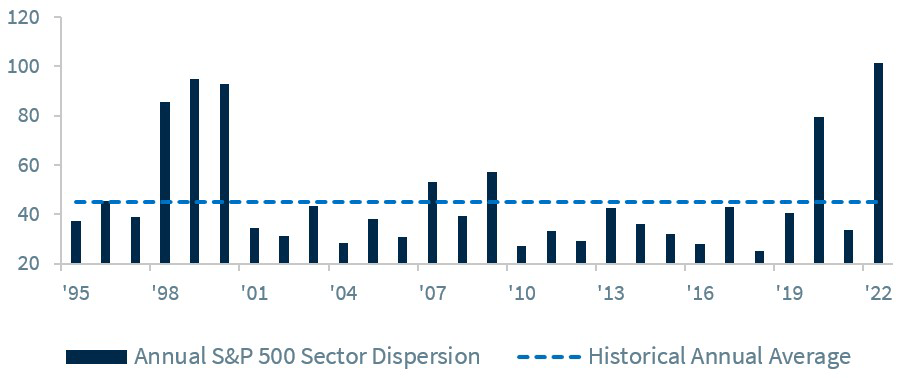
- S&P 500 sector dispersion is at multi-year highs
- The Dow is strongly outperforming the S&P 500
- Active management outperforming YTD
What a win! With Tuesday’s victory over Iran, the U.S. Men’s National Soccer team advanced past the World Cup group stage for the first time since 2014 and will play tomorrow versus the Netherlands at 10 a.m. ET. It was an exciting game, but probably more so than it needed to be. Why? A change in tactics. To start the game, the U.S. played an aggressive attacking style – leading to scoring chances and the lone goal of the game. But in the second half, the U.S. took a different approach, playing more defensively to preserve its lead. While the U.S. won 1-0, the strategy shift was nerve-wracking as Iran had several goal chances to close the game. For a soccer enthusiast, knowing these nuances adds a level of appreciation to the game. The same can be said for investors in understanding the nuances of the equity market indices.
-
Sector Dispersion Highlights | 2022 has been a challenging and volatile year for investors. At the lows year-to-date (October 12), the S&P 500 had declined ~25%, but has since recovered modestly to being down ~14%. If the year ended today, this would mark the weakest annual performance for the S&P 500 since 2008 (14 years!). Despite this weak ‘headline’ number, there is significant dispersion beneath the surface. In fact, the best performing sector (Energy: +70%) is outperforming the worst performing sector (Communication Services: -35%) by an astounding ~105% year-to-date! This marks the largest annual sector dispersion between the best and worst performing sector since at least 1995 and is nearly three times the historical average. Additionally, it is worth pointing out that six of the 11 S&P 500 sectors are either in positive territory or down less than 10% year-to date, while some of the more heavily weighted sectors (e.g., Communication Services, Consumer Discretionary and Tech) are down over 20%. This suggests that the ‘average’ sector is doing much better than the ‘headline’ S&P 500 performance number.
-
Index Calculation/Composition Matters | While the two most widely followed U.S. equity indices – the S&P 500 and the Dow Jones Industrial Average – tend to track closely (correlation of +0.96 dating back to 1930), there are years where there can be major discrepancies. In fact, with the Dow down only ~5% YTD, it is on pace to outperform the S&P 500 by the widest margin (9%) since 1934. This outperformance has occurred for a few reasons:
The Calculation of Each Index | The Dow is 30 companies versus the S&P 500’s 505 companies. However, the Dow is a ‘price’ weighted index, while the S&P 500 Index is a market-capitalization-weighted index. This means for the Dow that higher ‘priced’ stocks (e.g., UnitedHealth at $537/share has a ~4 times larger impact than Apple at $147/share) have a larger weighting and impact on the price swings of the overall Index. In comparison, the S&P 500 uses the market cap of each company (e.g., Apple, Microsoft and Amazon are the largest companies) to determine its weight within the Index.
The ‘Player’ Score this Year | For the Dow, 13 of the 30 companies have had positive performance year-to-date. Because some of these are higher ‘priced’ stocks, they represent ~60% of the Dow. In contrast, these same stocks only represent 9% of the S&P 500. A higher exposure to these positive performing companies has supported the Dow’s outperformance.
Sector Composition Differences | The sector composition of each Index also plays a large role in performance dispersion. For example, the Dow has a higher weighting to some of the relative outperforming sectors year-to-date such as Health Care, Industrials and Financials, whereas the S&P 500 has higher exposure to the underperformers such as Tech and Communication Services. For example, Health Care, which is up 0.2% year-to-date, has a 21% weighting in the Dow, but a 15% weighting in the S&P 500. On the flip side, Communication Services has a 2% weighing in the Dow but an 8% weighting in the S&P 500.
-
Active Management Takes the Stage | Large-cap active money managers have struggled to outperform the S&P 500 over the last decade. In fact, our basket of the largest 100 active large-cap mutual funds has underperformed the S&P 500 in aggregate by an average of 103 bps over the last eight years. However, year-to-date, given the elevated levels of dispersion and volatility, these large-cap mutual funds are outperforming the S&P 500 by the widest margin (76 bps) since at least 2013.
Bottom Line | Understanding the nuances of equity indices enhances your market insights. As dispersion is expected to remain high around the Fed tightening cycle and a potential recession, performance differences and opportunities are likely to continue.

Click here to enlarge
All expressions of opinion reflect the judgment of the author(s) and the Investment Strategy Committee, and are subject to change. This information should not be construed as a recommendation. The foregoing content is subject to change at any time without notice. Content provided herein is for informational purposes only. There is no guarantee that these statements, opinions or forecasts provided herein will prove to be correct. Past performance is not a guarantee of future results. Indices and peer groups are not available for direct investment. Any investor who attempts to mimic the performance of an index or peer group would incur fees and expenses that would reduce returns. No investment strategy can guarantee success. Economic and market conditions are subject to change. Investing involves risks including the possible loss of capital.
The information has been obtained from sources considered to be reliable, but we do not guarantee that the foregoing material is accurate or complete. Diversification and asset allocation do not ensure a profit or protect against a loss.
© Raymond James
Read more commentaries by Raymond James