The S&P 500 had its worst day since March 2020, but don't lose sight of the bigger picture, said Larry Adam, chief investment officer at Raymond James.
The financial markets have had a laser focus on inflation as it has such a huge impact on the prospects of Federal Reserve (Fed) tightening, interest rates and valuation metrics on the equity market. The markets have been constantly recalibrating expectations: easing inflation with the potential ending of the Fed’s tightening cycle versus persistent inflation driving further rate hikes. Today’s 4.3% decline is over the apparent disappointment that the latter scenario is likely. Just as the three-year inflation expectations in the New York Fed’s Survey of Consumer Expectations fell to nearly a two-year low, the August inflation report came in hotter-than-expected and the fears of an aggressive for longer Fed were once again revived as the S&P 500 posted its worst day since March 2020. While market movements such as these are uncomfortable, there are some dynamics to consider.
The shortcomings of CPI calculation
The Consumer Price Index (CPI) captures more than its fair share of media attention, perhaps because it is heavily utilized as a benchmark for public policy and oftentimes is the first inflation reading released each month. Regardless, the methodology behind its calculation is flawed and many economists and market commentators (including ourselves and the Fed) do not believe it is a superior measure of inflation. In fact, in 2013, Federal Reserve Bank of St. Louis President James Bullard wrote about the many reasons why the Fed changed its preferred measure of inflation to the Personal Consumption Expenditures (PCE). In summary, the Consumer Price Index does not account for the substitution of goods (e.g., trading down), has less comprehensive coverage, and does not readily account for shifts in consumer behavior. As a result of these biases, CPI tends to overstate inflation. For example, over the time period of Bullard’s study (January1995 to May 2013), CPI was more than 7% higher than PCE.
One print doesn't make a pattern
This is a phrase expressed by the Fed and we’ve repeated it as we’ve discussed the potential policy path over the past several weeks and months. Today, we will use it again as we explain why this singular CPI reading is not indicative of inflation’s path moving forward – which we believe is still in a downward trajectory. Why? There are a number of real-time indicators that suggest inflationary pressures are easing. The average price of a gallon of gasoline has fallen for over 90 days – the longest streak since 2015. Oceanic freight rates posted their largest weekly decline on record (-14%) and are now down~70% from their recent peak. Elevated inventories have led to an above-average proportion of apparel and footwear on markdown. The Manheim Used Vehicle Value Index has declined for six out of the last seven months. There are even more indicators that we could highlight (e.g., impact of the stronger dollar, falling supply chain bottle necks), but we believe the breadth of evidence supports our view that the pace of inflation will ease in the months ahead.
Pricing pressures expected to ease
In the Investment Strategy Webinar held this past Monday, we explained that many of the components that drove inflation higher are set to reverse in the coming months. We laid out a clear timeline of how we expected inflation pressures to decelerate. First, commodity prices such as oil, copper and lumber have already fallen 29%, 27%, and67% from their respective peaks. Second, goods prices like apparel and home furnishings are being discounted to reduce inventories to bring in holiday-oriented goods. Third, service prices for things like travel are in the process of easing as we exit the travel-heavy summer travel period. Going forward, we believe food price increases are likely to fall during the fourth quarter. And while U.S. inflation statistics point to still increasing prices, broader global food indices like the UN Food Price Index have declined for five consecutive months since its record high in March – supported by declines in wheat, corn, and soybean oil down32%, 13%, 26% respectively.
This should translate into grocery bills and restaurant costs easing in the fourth quarter and the early part of 2023.Finally, rent (or shelter prices) increases should start to slow if not stall in 2023. It our belief that rents lag the health of the housing market so when the housing market is strong, rents tend to move higher and when the housing market stalls, rental increases stall or are lower. And from our vantage point, the housing market is struggling – especially as mortgage rates have risen. As a result, our economist believes that rents tend to lag the housing market by approximately one year, so as house price appreciation decelerates from approximately 20% year-over-year to the mid to low single digits over the next year, so will rental increases slow which will cause inflation to decelerate. And the good news is when you look at real time data from Zillow, it does look as if rents are already starting to decelerate from very elevated levels.
The bottom line is that inflation is going to have multiple pieces fall into place – falling commodity prices, falling goods prices, falling food prices and then decelerating rents as we go into next year – which should help inflationary pressures accelerate their downward trajectory going into next year.
Supportive seasonal shift
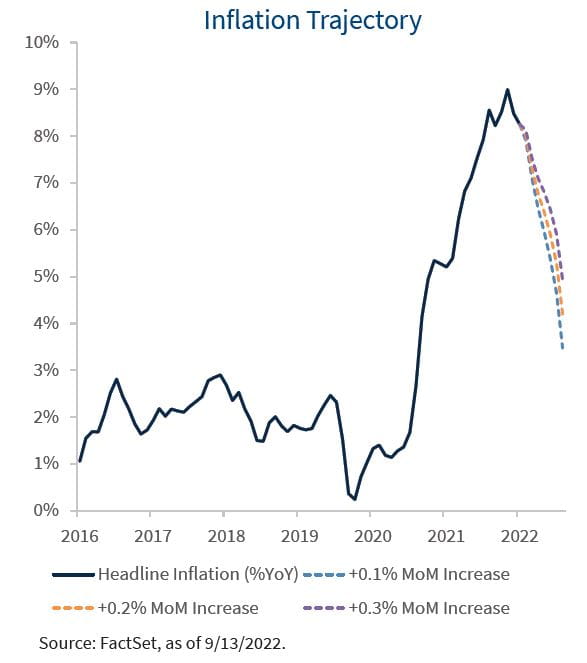
In addition to the fundamental components of inflation, the calendar effects will also help push inflation lower. As we transition into the fall, headline and core indices will ‘roll off’ two of the hotter monthly inflation prints seen in October and November of last year. At the headline CPI level, these prints were +0.9% and +0.7% for the two months, respectively. How does this impact the year-over-year pace? If the monthly pace of headline inflation remains consistent with this month’s report (+0.1%), the year-over-year pace will fall from +8.4% to +6.5% by November. If this occurs, it would be the swiftest three-month deceleration in the year-over-year pace of headline CPI since 2009, exclusive of COVID-related impacts.

Bottom line: What's the market impact?
The equity market traded significantly lower following the inflation report, as the S&P 500 posted its largest drawdown of the year. However, to put this move into perspective, and following the 5% rally that we’ve seen over the last week, the market is back to its post-Labor Day weekend level.
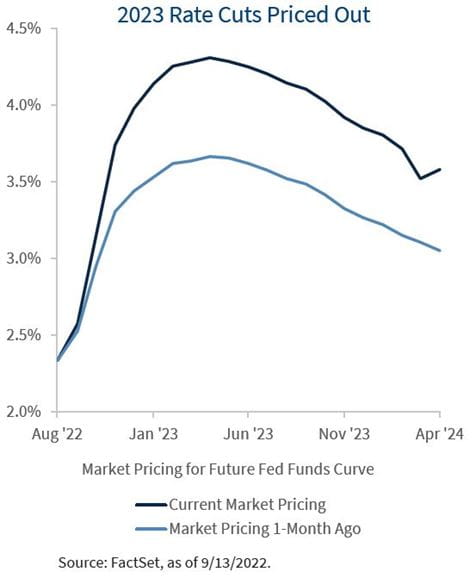
The market selloff is indicative of fears that the hotter inflation print will inevitably push the Fed further into restrictive territory. In fact, the futures market has now fully priced in a 75 basis point hike at next week’s September FOMC Meeting with which we now agree. As for the peak policy rate, the futures market is now expecting a terminal rate of 4.3% in April 2023, translating to 180 basis points of additional tightening from current levels. This is a significant adjustment considering the peak rate was 3.7% just one month ago. In contrast, we see the fed funds rate peaking at or below 4%. The September 14 Producer Price Index release could place additional pressure on the Fed’s decision, as it could follow CPI’s trend or it could confirm the broader picture that we’ve been seeing.
Ultimately, we believe this sharp upward adjustment in the terminal rate expectations is likely overdone, as the deceleration in the future pace of inflation, combined with a slowdown in economic growth in early 2023 (due to the lagged effects of tightening monetary policy) should allow the Fed to ease its stance by the end of the year.
All expressions of opinion reflect the judgment of the author(s) and the Investment Strategy Group, but not necessarily those of Raymond James & Associates, and are subject to change. This information should not be construed as a recommendation. The foregoing content is subject to change at any time without notice. Content provided herein is for informational purposes only. There is no guarantee that these statements, opinions or forecasts provided herein will prove to be correct. Economic and market conditions are subject to change. Investing involves risks including the possible loss of capital. Material is provided for informational purposes only and does not constitute a recommendation. Diversification and asset allocation do not ensure a profit or protect against a loss. The information has been obtained from sources considered to be reliable, but we do not guarantee that the foregoing material is accurate or complete. Diversification and asset allocation do not ensure a profit or protect against a loss.
The S&P 500 is widely regarded as the best single gauge of large-cap U.S. equities. There is over USD 7.8 trillion benchmarked to the index, with index assets comprising approximately USD 2.2 trillion of this total. The index includes 500 leading companies and captures approximately 80% coverage of available market capitalization.
© Raymond James
Read more commentaries by Raymond James