History can help equity investors maintain perspective as monetary policy tightens, says Raymond James Chief Portfolio Strategist Nicholas Lacy.
With the US Federal Reserve (Fed) and other central banks going down the path of increasing policy rates, it seemed a good time to look at market impacts over the last 40 years or so. Since 1984, there have been six cycles where the Fed raised the fed funds rate multiple times. Each time the Fed raised rates, it was based on a different set of circumstances; however, there were usually some similarities in each cycle. Bear in mind, it takes time for rate hikes to work through the economy, yet the markets are attempting to forecast the impact one year out.

Historically, the Fed has raised interest rates as a way to cut pricing pressures that could lead to higher inflation. In each instance in which the Fed raised rates in the last 40 years, inflation was moving to a higher point and unemployment was at, or below, the natural level of unemployment. On average, the unemployment rate has been 5.5% when the Fed started the rate hike cycle, with the 4.2% unemployment rate in 1999 being the lowest rate. When the Fed started raising rates in March of 2022, the unemployment rate was approximately 3.8% and below the 4.0% target the Fed set. The big difference in 2022 is the level of inflation which is the highest since 1982. How this impacts sector performance going forward compared to the past remains to be seen.
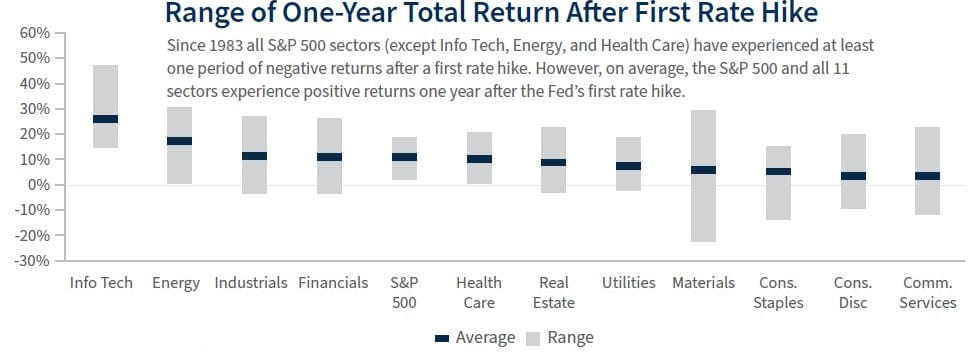
Sector performance varied from cycle to cycle but there were some constants. For example: most sectors were positive one and two years out from the first time the Fed started to hike the fed funds rate. The Information Technology, Energy and Industrials sectors have outperformed, on average, one year from the time the Fed starts hiking. At the same time, Communication Services, Consumer Discretionary and Consumer Staples have been the worst performing sectors. Many believe that financial stocks always perform well during rate hike cycles because banks benefit from higher rates. This may be true, yet, historically other sectors have tended to perform better. The chart showing the ranges of one-year returns from the point the Fed starts hiking rates as well as the average returns indicates most sectors have seen at least one period of negative returns. Information Technology, Energy, and Health Care are exceptions.
Source: FactSet; Data from 1988 - 2022
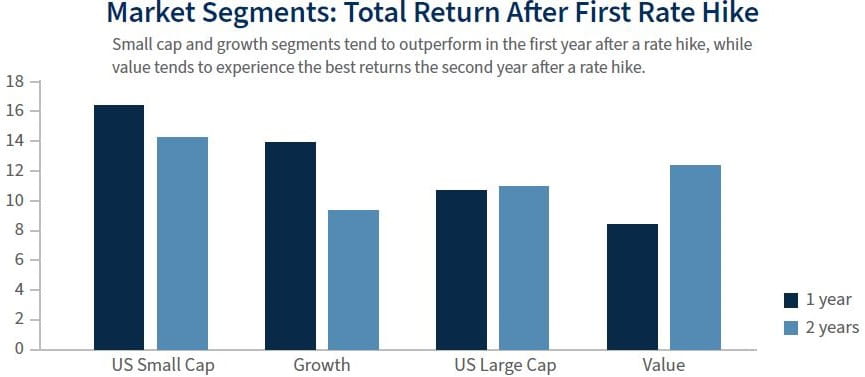
Looking beyond sectors to market segments; large/small and growth/value, small caps and growth stocks had the highest return one year following the first rate hike. While value stocks had a positive one-year return, they trailed the broad market and growth stocks. It was two years after the first rate hike when value stocks started showing the strongest returns. The same thing can be seen for two years from the first rate hike where Financials, Real Estate stocks, and Utilities have tended to be strong relative performers.
Looking out more than one to two years from the first rate hike, little changes as Energy, Financials, and Utilities posted the strongest returns while Communication Services, Consumer Discretionary, and Consumer Staples were still the worst performing sectors. Markets were still positive two years out with small caps continuing to beat large caps, while value outperformed growth by a small margin.
History teaches us that stocks generally continue to perform well two years out from the first rate hike yet leadership shifts as the length of time extends. When the Fed starts hiking rates, it is normally good for equity investors for the next 12-24 months before economic conditions start to slow enough to increase the probability of a recession. Investors in the stock market should have some degree of confidence that markets don’t fall apart just because the Fed starts hiking rates, and the negative impact is normally smaller than what one might think.
Read the full
Investment Strategy Quarterly
All expressions of opinion reflect the judgment the author, the Investment Strategy Committee, or the Chief Investment Office and are subject to change. Past performance may not be indicative of future results. There is no assurance any of the trends mentioned will continue or forecasts will occur. The performance mentioned does not include fees and charges which would reduce an investor’s return. Dividends are not guaranteed and will fluctuate. Investing involves risk including the possible loss of capital. Asset allocation and diversification do not guarantee a profit nor protect against loss. Investing in certain sectors may involve additional risks and may not be appropriate for all investors. The indexes mentioned are unmanaged and an investment cannot be made directly into them. The S&P 500 is an unmanaged index of 500 widely held securities.
© Raymond James
Read more commentaries by Raymond James