Chief Economist Scott Brown discusses the latest market data.
Tensions in Ukraine remained at the forefront for investors
The Consumer Price Index rose 0.8% in February (+7.9% y/y), up 0.5% (+6.4% y/y) ex-food and energy. The Bureau of Labor Statistics noted that “virtually all” of the core CPI component indexes rose over the last year. The price index for shelter rose 4.7% y/y, its largest 12-month increase since May 1991. Several transportation indexes showed large increases over the past year, including used cars and trucks (+41.2%), new vehicles (+12.4%), and airline fares (+12.7%).
The U.S. trade deficit rose to a record $89.7 billion in January, with merchandise imports up 20.0% y/y. Jobless claims rose by 11,000, to 227,000, in the week ending March 5 – still a very low trend. The Job Opening and Labor Turnover Survey (JOLTS) data showed job openings little changed at 11.3 million in January. Quits were 4.3 million, totaling 48.8 million over the last 12 months.
Next week: The Federal Open Market Committee is widely expected to raise the target range for the federal funds rate by 25 basis points (to 0.25%-0.50%) and to signal that further rate increases are likely on their way. We’ll get revised economic projections from the senior Fed officials, including a new dot plot, and Chair Powell will expound on the Fed’s outlook in his press conference. On the data front, one should generally take February figures with a grain of salt (due to weather and seasonal adjustment issues), but the details should remain consistent with strong growth in the near term.
Indices
| |
Last |
Last Week |
YTD return % |
| DJIA |
33,174.07 |
33,794.66 |
-8.71% |
| NASDAQ |
13,129.96 |
13,537.94 |
-16.08% |
| S&P 500 |
4,259.52 |
4,363.49 |
-10.63% |
| MSCI EAFE |
2,053.78 |
2,107.87 |
-12.08% |
| Russell 2000 |
2,011.67 |
2,032.41 |
-10.41% |
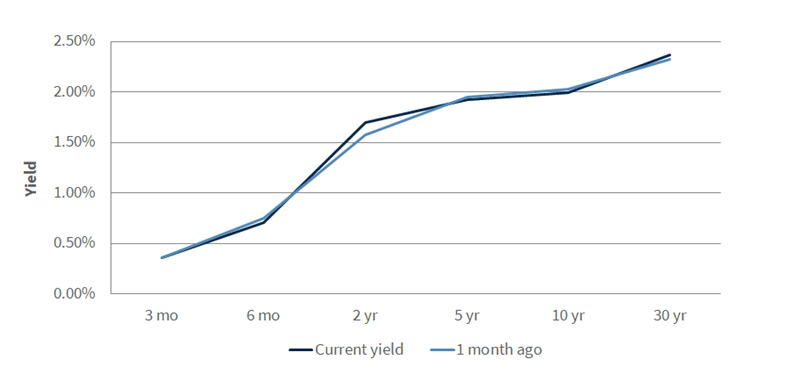
Treasury Yield Curve – 3/11/2022

As of close of business 3/10/2022
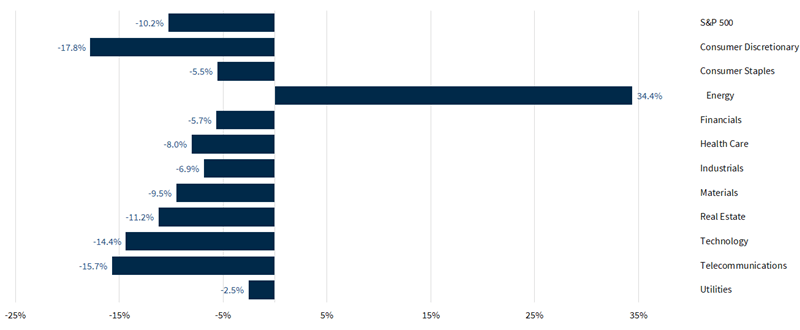
S&P Sector Performance (YTD) – 3/11/2022
Economic Calendar
| March 15 |
— |
Producer Price Index (February) |
| March 16 |
— |
Retail Sales (February) |
| |
— |
Industrial Production (February) |
| |
— |
FOMC Policy Decision |
| |
— |
Fed Summary of Economic Projections |
| |
— |
Powell Press Conference |
| March 17 |
— |
Jobless Claims (week ending March 12) |
| |
— |
Building Permits, Housing Starts (February) |
| |
— |
Industrial Production (February) |
| March 18 |
— |
Existing Home Sales |
| |
— |
Leading Economic Indicators (February) |
| April 1 |
— |
Employment Report (March) |
| May 4 |
— |
FOMC policy decision |
All expressions of opinion reflect the judgment of the author and are subject to change. There is no assurance any of the forecasts mentioned will occur or that any trends mentioned will continue in the future. Investing involves risks including the possible loss of capital. Past performance is not a guarantee of future results. International investing is subject to additional risks such as currency fluctuations, different financial accounting standards by country, and possible political and economic risks, which may be greater in emerging markets. While interest on municipal bonds is generally exempt from federal income tax, it may be subject to the federal alternative minimum tax, and state or local taxes. In addition, certain municipal bonds (such as Build America Bonds) are issued without a federal tax exemption, which subjects the related interest income to federal income tax. Municipal bonds may be subject to capital gains taxes if sold or redeemed at a profit. Taxable Equivalent Yield (TEY) assumes a 35% tax rate.
The Dow Jones Industrial Average is an unmanaged index of 30 widely held stocks. The NASDAQ Composite Index is an unmanaged index of all common stocks listed on the NASDAQ National Stock Market. The S&P 500 is an unmanaged index of 500 widely held stocks. The MSCI EAFE (Europe, Australia, Far East) index is an unmanaged index that is generally considered representative of the international stock market. The Russell 2000 index is an unmanaged index of small cap securities which generally involve greater risks. An investment cannot be made directly in these indexes. The performance noted does not include fees or charges, which would reduce an investor's returns. U.S. government bonds and treasury bills are guaranteed by the US government and, if held to maturity, offer a fixed rate of return and guaranteed principal value. U.S. government bonds are issued and guaranteed as to the timely payment of principal and interest by the federal government. Treasury bills are certificates reflecting short-term (less than one year) obligations of the U.S. government.
Commodities trading is generally considered speculative because of the significant potential for investment loss. Markets for commodities are likely to be volatile and there may be sharp price fluctuations even during periods when prices overall are rising. Specific sector investing can be subject to different and greater risks than more diversified investments. Gross Domestic Product (GDP) is the annual total market value of all final goods and services produced domestically by the U.S. The federal funds rate (“Fed Funds”) is the interest rate at which banks and credit unions lend reserve balances to other depository institutions overnight. The prime rate is the underlying index for most credit cards, home equity loans and lines of credit, auto loans, and personal loans. Material prepared by Raymond James for use by financial advisors. Data source: Bloomberg, as of close of business March 10, 2022.
© Raymond James
Read more commentaries by Raymond James