“Tonight, old man, you did it!
You did it! You did it! You said that you would do it,
And indeed you did. I thought that you would rue it;
I doubted you’d do it. But now I must admit it
That succeed you did.”
. . . My Fair Lady (You Did It)
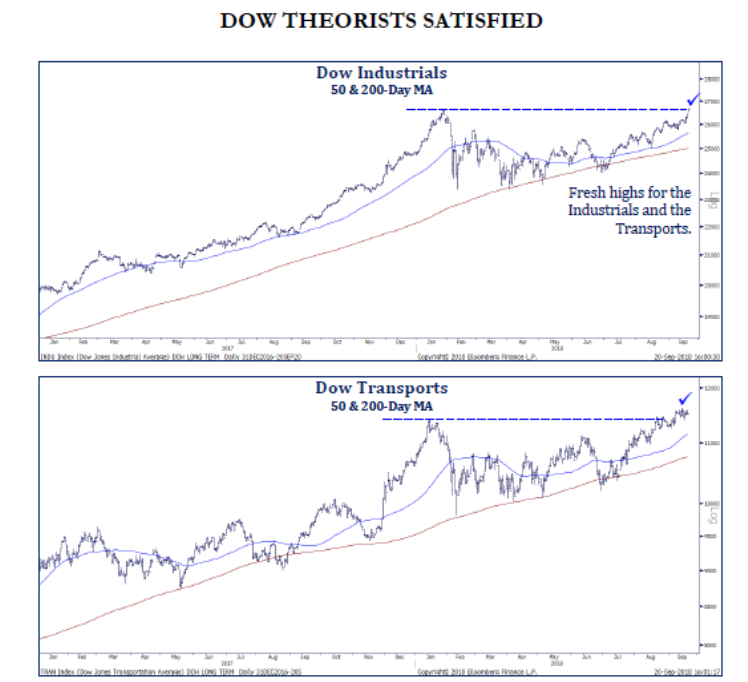
Well, “you did it,” as the senior index followed most of the other indices to new all-time highs. We have repeatedly written that this was going to happen given the Advance-Decline Line’s continuing new highs, as well as the stock market’s strong breadth. As often stated in these missives, with many of the indices trading to new all-time highs over the past few months it was just a matter of time until the D-J Industrial Average (INDU/26,743.50) would play catch-up, and catch up it did last week. In that upside breakout the DOW confirmed the D-J Transport’s (TRAN/11,532.56) new highs that have occurred over the past number of weeks, thus registering a Dow Theory “buy signal” (see chart on page 2). All of this was foretold by the January – February “set up,” which we wrote about back then.
To repeat ourselves, our models said to raise some cash in late January. Those signals were followed by an 11.8% pullback in the S&P 500 (SPX/2,929.67) culminating with the “selling climax” low of February 6, 2018. Then we got a failed “throwback” rally leading to another selloff into the undercut low of February 9, 2018. For those that do not know what an undercut low is, it is when the index/stock trades slightly below a previous significant low. In this case it was the selling climax low of February 6 followed by the February 9 slightly lower low (read: undercut low). Folks, a tradeable bottom does not get any better than that; it was one of the most classic bottoms there is! Such chart patterns typically cause technical analysts to warn that another whole new “leg” to the downside is coming. However, over the years we have observed numerous major lows have been made this way, which is why we recommended buying the February 9 undercut low looking for new all-time highs in the months ahead. While many pundits thought us to be crazy, truly believing another downside leg was in store, or at best the market was going to be range-bound, we thought otherwise. Since that undercut low the SPX is better by nearly 16% and has left the doubters scratching their collective heads. More importantly, the equity markets have left many of the “pros” scrambling to play catch-up and now that the averages have tagged new all-time highs there should be a rush to commit more cash. While this may not lead to a vault to the upside (more likely a grind higher) it certainly should contain any downside, provided there is not a “black swan” news event.
We have been bullish since October 2008, when most stocks bottomed, and we are on record back then suggesting the bottoming process had begun. Then on March 2, 2009, on Bloomberg TV, we stated that, “The bottoming process that began in October last year is complete this week and we are “all in.” Have we rebalanced portfolios, raised cash from time to time, layered in some downside hedges; yes we have, but it has always been within the construct of a secular bull market. Ladies and gentlemen, secular bull markets last 16, 17, 18+ years! So depending on where you want to count your “count” (October 2008, March 2009, or April 2013) this bull should have years left to run. So what’s driving it?
Well, back in 2014 we wrote about a book titled Unleashing the Second American Century: Four Forces for Economic Dominance by Joel Kurtzman. In the book, Kurtzman, a senior fellow at the Milken Institute, focused on “Four Forces”: soaring levels of creativity, massive new energy reserves, gigantic amounts of capital, and unrivaled manufacturing depth. Each of these transformative themes is outlined below:
Soaring levels of creativity- No other country in the world, in such a short time, has created so many scientific, technological, industrial, commercial, financial, and artistic innovations. Not only has America’s creativity changed science and business, it has changed world culture.
According to Kurtzman, “Creativity is important. If it wasn’t, no one would marvel at Apple, or be impressed with innovations from Pfizer, IBM, Tesla, or Boeing. No one would listen to our rock ‘n’ roll, rap, and country and western songs; watch our movies and TV shows; or come to America to study or work. I doubt creativity is in our genes, but creativity is in our culture. Let me explain a little more about the forces I am referring to by taking a visit to ‘innovation corridor.’”
The author continues, “America’s research centers are scattered around the country. There are impressive concentrations of talent, knowledge, and resources everywhere. While biotech and pharma are vibrant growth areas, computer hardware and software, telecom, tech, advanced manufacturing, materials science, chemistry, aeronautical and space engineering, electrical engineering, artificial intelligence, ‘big data,’ analysis, and many other fields - all have their own centers of expertise scattered around the country.’”
Massive new energy reserves- America is headed for energy independence around the year 2020, and it is on track to be a net energy-exporting nation by 2025. These new sources of energy can be used as fuels or turned into products. Imagine a future in which oil and natural gas wealth flows to our shores and not to the Middle East, Russia, or Venezuela.
Gigantic amounts of capital- As a result of the Great Recession, business has renegotiated its debt, and businesses and individuals have become ultraconservative with capital. Trillions of dollars of investment funds are in private hands, waiting for the go-ahead to be deployed.
Kurtzman writes, “When you have access to capital, the result can be magical. The Milken Institute studies show that when capital is plentiful, and prudently lent, and borrowers can obtain it in transparent ways and under good terms, economies grow.”
Unrivaled manufacturing depth- America makes a myriad of things, and now it will make more as businesses move to the United States to take advantage of abundant energy and capital and to tap into our vast reserves of intelligence and creativity.
According to Kurtzman, “Americans produce about 20% of all the stuff in the world. Given that we are just 4.5% of the world’s population, and China is 19%, that’s quite an achievement. America’s productivity, measured on a per capita basis, remains the world standard. America works smart and our factories are top-tier, second to none.”
Most of Joel’s predictions have come to pass and participants should reread the aforementioned paragraph about China given the burgeoning trade war.
The call for this week: We have been told there will no longer be a 9:00 a.m. “verbal call” due to technical difficulties with the “hoot” system. Therefore, you will have to either dial the TIPs line, warp into the RJ Net on your computers, or go to the Raymond James public website (Link). As for the stock market, our models suggest a grind higher for the SPX with a near-term trading target of 2980 – 3000, which should be followed by a shallow pullback say to 2930. This morning, however, the preopening futures are off marginally as the new trade tariffs kick in.
Chart 1

Click here to enlarge
View as PDF
Additional information is available on request. This document may not be reprinted without permission.
Raymond James & Associates may make a market in stocks mentioned in this report and may have managed/co-managed a public/follow-on offering of these shares or otherwise provided investment banking services to companies mentioned in this report in the past three years.
RJ&A or its officers, employees, or affiliates may 1) currently own shares, options, rights or warrants and/or 2) execute transactions in the securities mentioned in this report that may or may not be consistent with this report’s conclusions.
The opinions offered by Mr. Saut should be considered a part of your overall decision-making process. For more information about this report – to discuss how this outlook may affect your personal situation and/or to learn how this insight may be incorporated into your investment strategy – please contact your Raymond James Financial Advisor.
All expressions of opinion reflect the judgment of the Equity Research Department of Raymond James & Associates at this time and are subject to change. Information has been obtained from sources considered reliable, but we do not guarantee that the material presented is accurate or that it provides a complete description of the securities, markets or developments mentioned. Other Raymond James departments may have information that is not available to the Equity Research Department about companies mentioned. We may, from time to time, have a position in the securities mentioned and may execute transactions that may not be consistent with this presentation’s conclusions. We may perform investment banking or other services for, or solicit investment banking business from, any company mentioned. Investments mentioned are subject to availability and market conditions. All yields represent past performance and may not be indicative of future results. Raymond James & Associates, Raymond James Financial Services and Raymond James Ltd. are wholly-owned subsidiaries of Raymond James Financial.
International securities involve additional risks such as currency fluctuations, differing financial accounting standards, and possible political and economic instability. These risks are greater in emerging markets.
Investors should consider the investment objectives, risks, and charges and expenses of mutual funds carefully before investing. The prospectus contains this and other information about mutual funds. The prospectus is available from your financial advisor and should be read carefully before investing.
© Raymond James
© Raymond James
Read more commentaries by Raymond James