At a time when a handful of mega-cap stocks have come to dominate U.S. indexes, is home-country bias causing investors to miss out on opportunities? In this Q&A, Research Affiliates’ Chairman Robert Arnott and CIO Christopher Brightman, portfolio managers of the PIMCO RAE strategies, provide their views on how widening price gaps between growth and value stocks and among equity sectors are creating value opportunities in emerging markets – and why long-horizon U.S. investors should consider systematic value strategies that look beyond the border.
Q: In what regions are you finding the most appealing opportunities for the RAE portfolios today?
Arnott: U.S.-based investors have a natural tendency to focus on the U.S. markets. Stories about domestic companies tend to resonate with us more than those about foreign firms, while foreign investments can feel riskier and, well, foreign. In finance, this is called home-country bias. As a result, U.S. investors often miss opportunities outside of the U.S.
We believe now is not the time to succumb to such home-country bias. Not only do foreign equities have far cheaper valuations than U.S. stocks, but the valuation dispersion between cheap and rich firms is also more pronounced outside of the U.S. than it is domestically, particularly in emerging markets. RAE has a strong value bias, and we designed the RAE strategies to seek to outperform by taking advantage of mean reversion. Because non-U.S. stock markets are generally cheaper than our own, and because value today is cheaper relative to growth outside the U.S. than within the U.S., we estimate the RAE portfolios will offer attractive performance potential outside of the U.S.
Research Affiliates creates 10-year real return estimates for asset classes using a “building block” approach. If we know the yield, growth in income and changes in valuation multiples on any investment, we can gauge the potential total return. This is a powerful tool both for attribution of historical returns, and in seeking to forecast future returns.
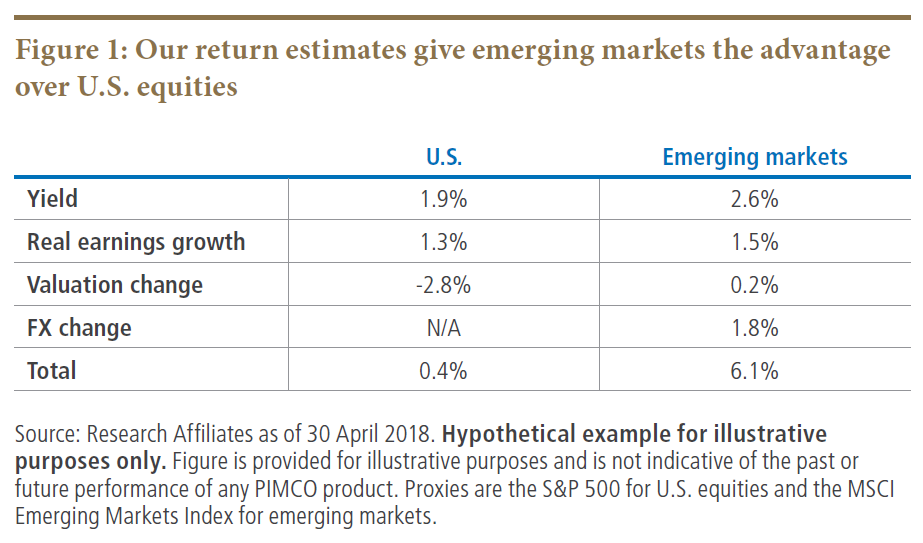
We calculate point estimates for equity returns by combining observed dividend yield, historical real earnings growth, mean reversion in valuation and mean reversion in foreign currencies. It’s important to note that for both valuations and currencies, we do not assume full mean reversion back to historical norms. Perhaps there’s a new regime and there will be no mean reversion, or perhaps the markets are stretched and full mean reversion will occur. Recognizing that either may be possible, we assume mean reversion halfway toward historical norms over the coming 10 years. This simple and intuitive model currently suggests a significant advantage for equities in emerging markets relative to the U.S. (see Figure 1).

Current valuations suggest U.S. equities will generate negligible real returns over the next 10 years (full mean reversion would take us to a −3% real return, roughly matching the 2000–2009 experience). Valuations outside of the U.S., where we find equities to be far more attractive, paint a far less dire picture. And note that this does not account for any potential alpha generated from value beating growth or from mean reversion in RAE strategies relative to conventional value strategies. Critics might say, “But foreign stocks are riskier, so of course they’re cheaper.” If so, why did they command large premiums to the already lofty U.S. valuations at the end of 2007, just before the global financial crisis?
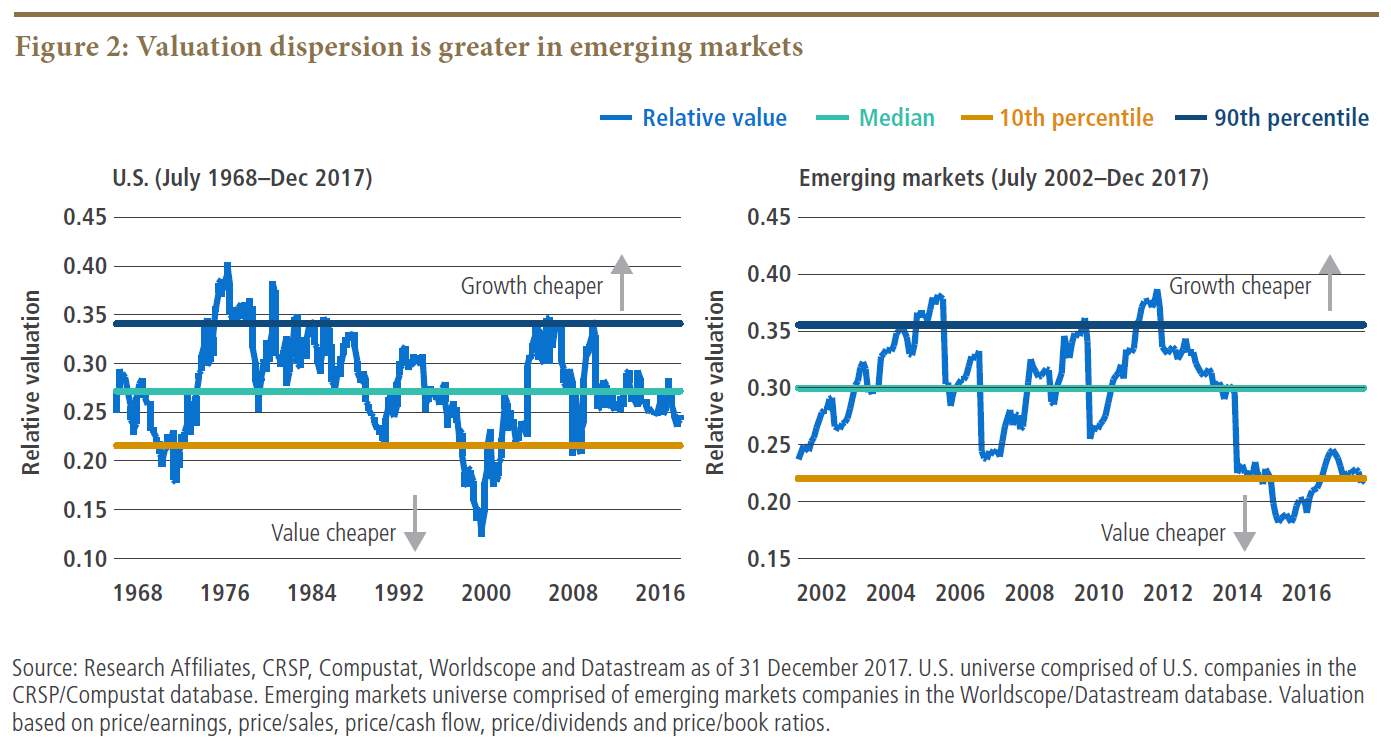
Not only are equities cheaper outside of the U.S., but the dispersion between value and growth is greater outside of the U.S. as well. Many of us are familiar with the expensive mega-cap stocks that have come to dominate U.S. indexes. As companies such as the “FANGs” – Facebook, Amazon, Netflix and Google (now Alphabet) – soared, their impact on market benchmarks grew. Simultaneously, inexpensive commodity-related stocks have lagged the market, creating a widening spread between the most and least expensive companies. With home-country bias, many investors may miss the fact that this spread is even more pronounced outside of the U.S., particularly in emerging markets (see Figure 2).
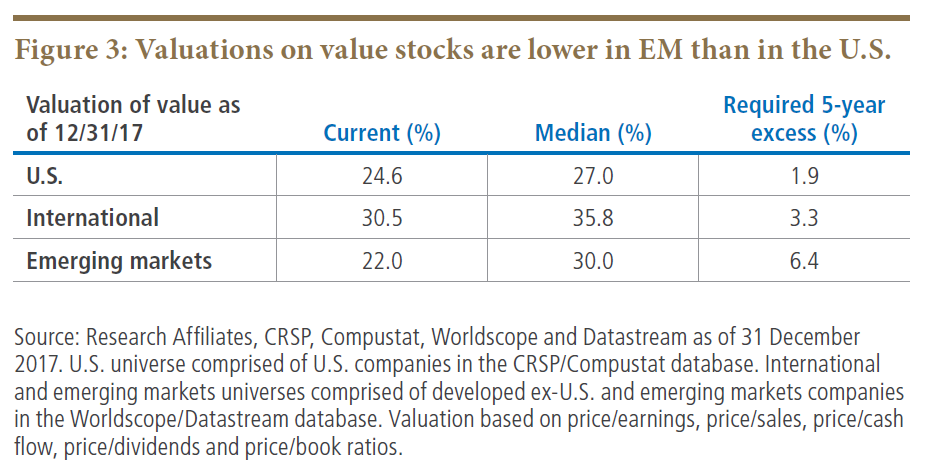
Note that value stocks are priced at 24.6% of growth stocks in the U.S., compared with 22.0% in emerging markets (see Figure 3). Valuation dispersion outside of the U.S. creates a tremendous opportunity for a contrarian rebalancing strategy such as RAE. Value stocks in the U.S. would need to outperform growth stocks by 1.9% annualized over the next five years in order to return to their median valuation. While this would represent healthy excess returns for value, it pales in comparison to the 6.4% annualized excess return value stocks would need to post in emerging markets in order to return to their median valuation levels.
We know … value has hurt investors for the past decade, and U.S. stocks have trounced non-U.S. stocks over the past decade. It’s difficult for investors to want to buy what has inflicted losses and pain, but anything that’s newly cheap will likely have inflicted losses and pain. Past is not prologue. Chasing U.S. growth stocks may be comfortable and fun – but watch out below!
RAE Fundamental Emerging Markets Fund no longer offers the extreme bargains of January 2016, when the price/earnings ratio was at 6.3 times (close to the Depression-era lows reached in May 1932!) and the price/sales ratio was at 0.48 times; however, those valuations were lower than any seen in the U.S. in the past quarter century, after trading 40% rich relative to U.S. valuations 10 years ago. No wonder EM value stocks hurt investors so badly from 2007 to 2015, as they went from extreme high multiples to extreme lows.
In our view, emerging markets value stocks are a bargain. The five-year cyclically adjusted price/earnings (CAPE) ratio (or Shiller P/E) for the Russell 1000 Growth is now 51 times; the five-year CAPE ratio for RAE Fundamental Emerging Markets is now 8.1 times. U.S. growth is at 3.0 times sales, while RAE Fundamental Emerging Markets is at 0.6 times sales.
We explicitly designed the models that inform the RAE strategy to take advantage of mean reversion. The potential for mean reversion is greatest when valuation dispersion is also greatest. We believe that long-horizon investors would be well-served by favoring non-U.S. equities over domestic markets. We further believe that long-horizon investors should consider a contrarian strategy such as RAE, given how wide the gap between growth and value stocks has become outside of the U.S.
Q: What created this opportunity for value in emerging markets?
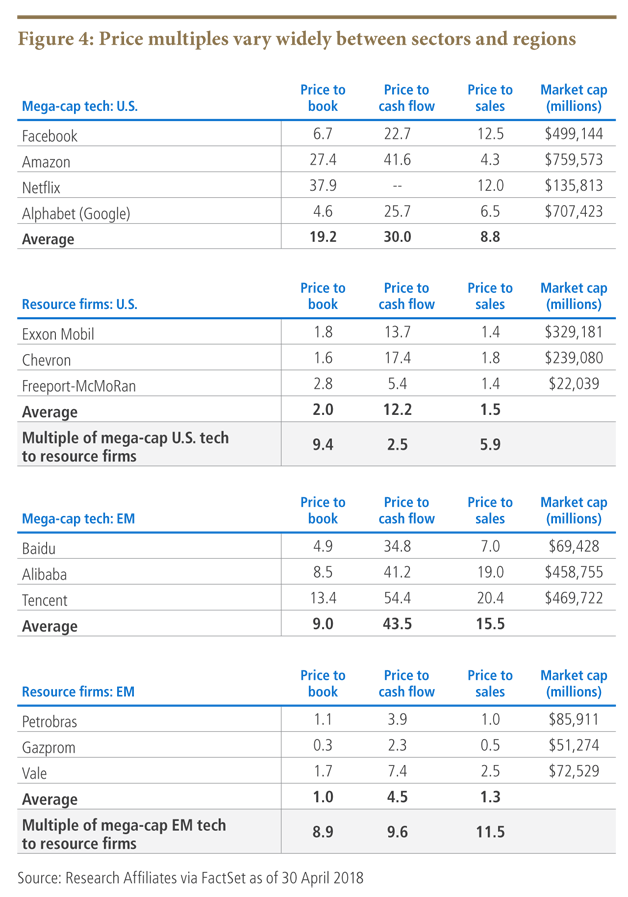
Brightman: Today’s opportunity starts with a vast pricing disparity between different industry sectors. Markets have long forgotten peak oil and the rise of China as a growth story. As in the late 1990s, attention has shifted to network effects and the potential “winner takes most” monopoly pricing power of mega-cap tech companies. In the U.S., the glamorous FANG tech stocks trade at four times higher price/sales multiples and double the price/cash flow multiples of mega-cap global resource stocks (see Figure 4).
This disparity between the market prices for different industries is magnified in the less mature and more volatile emerging markets. Like the FANG stocks in the U.S., their “BAT” counterparts in China (Baidu, Alibaba and Tencent) sport bubble-level valuations. The BATs trade at an average sales multiple of 15.5 times and a cash flow multiple of 43.5 times! At the same time, EM resource stocks trade at sales and cash flow multiples of 1.3 times and 4.5 times, respectively. In EM, glamorous tech stocks trade at sales and cash flow multiples 10 times higher than resource stocks.
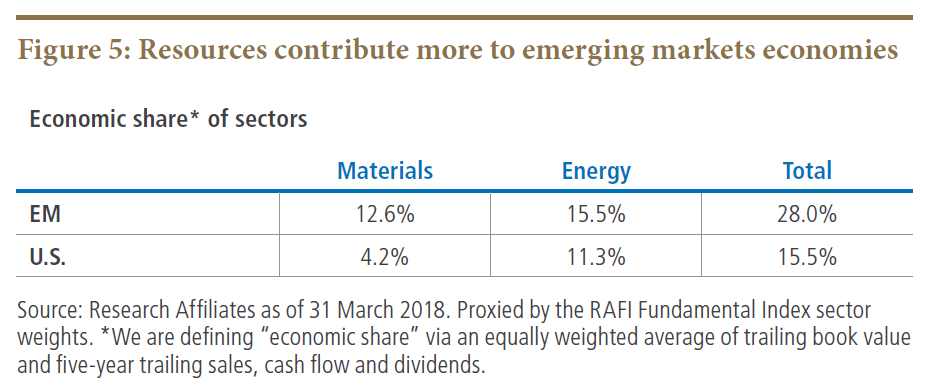
Finally, this disparity in sector pricing is more important in the relatively more resource-heavy emerging markets (see Figure 5).
As I’ve written many times, we are firm believers that the price you pay for the cash flows you buy determines the return you may expect. The growth prospects of the FANG stocks in the U.S. may or may not justify paying double the multiple of cash flow of out-of-favor resource stocks. But we believe it defies common sense to think the growth prospects of the BAT stocks in China justify paying 10 times the cash flow multiple of EM resource stocks.
DISCLOSURES
Investors should consider the investment objectives, risks, charges and expenses of the funds carefully before investing. This and other information are contained in the fund’s prospectus and summary prospectus, if available, which may be obtained by contacting your investment professional or PIMCO representative or by visiting www.pimco.com. Please read them carefully before you invest or send money.
The terms “cheap” and “rich” as used herein generally refer to a security or asset class that is deemed to be substantially under- or overpriced compared to both its historical average as well as to the investment manager’s future expectations. There is no guarantee of future results or that a security’s valuation will ensure a profit or protect against a loss.
Past performance is not a guarantee or a reliable indicator of future results.
Return estimates are based on Research Affiliates LLC proprietary research and are for illustrative purposes only and are not a prediction or a projection of return. Return estimates are an estimate of what an asset class may return on average over the specified time period based on a set of assumptions that may or may not be realized. Actual returns may be higher or lower than those shown and may vary substantially over shorter time periods. Hypothetical and simulated examples have many inherent limitations and are generally prepared with the benefit of hindsight. There are frequently sharp differences between simulated results and the actual results. There are numerous factors related to the markets in general or the implementation of any specific investment strategy, which cannot be fully accounted for in the preparation of simulated results and all of which can adversely affect actual results. No guarantee is being made that the stated results will be achieved. Return estimates may vary from PIMCO capital market assumptions.
References to specific securities and their issuers are not intended and should not be interpreted as recommendations to purchase, sell or hold such securities. PIMCO products and strategies may or may not include the securities referenced and, if such securities are included, no representation is being made that such securities will continue to be included.
PIMCO does not provide legal or tax advice. Please consult your tax and/or legal counsel for specific tax or legal questions and concerns.
A word about risk:
Equities may decline in value due to both real and perceived general market, economic and industry conditions. Investments in value securities involve the risk the market’s value assessment may differ from the manager and the performance of the securities may decline. Investing in foreign-denominated and/or -domiciled securities may involve heightened risk due to currency fluctuations, and economic and political risks, which may be enhanced in emerging markets. Currency rates may fluctuate significantly over short periods of time and may reduce the returns of a portfolio. REITs are subject to risk, such as poor performance by the manager, adverse changes to tax laws or failure to qualify for tax-free pass-through of income. Model Risk is the risk that the Fund’s investment models used in making investment allocation decisions may not adequately take into account certain factors and may result in a decline in the value of an investment in the Fund. Derivatives may involve certain costs and risks, such as liquidity, interest rate, market, credit, management and the risk that a position could not be closed when most advantageous. Investing in derivatives could lose more than the amount invested. The Fund is non-diversified, which means that it may invest its assets in a smaller number of issuers than a diversified fund.
There is no guarantee that these investment strategies will work under all market conditions or are suitable for all investors and each investor should evaluate their ability to invest long-term, especially during periods of downturn in the market. Investors should consult their investment professional prior to making an investment decision.
The MSCI Emerging Markets Index is a free float-adjusted market capitalization index that is designed to measure equity market performance of emerging markets. The MSCI Emerging Markets Index consists of the following 21 emerging market country indices: Brazil, Chile, China, Colombia, Czech Republic, Egypt, Hungary, India, Indonesia, Korea, Malaysia, Mexico, Morocco, Peru, Philippines, Poland, Russia, South Africa, Taiwan, Thailand, and Turkey. The MSCI ACWI Value Index captures large and mid-cap securities exhibiting overall value style characteristics across 23 Developed Markets countries* and 23 Emerging Markets (EM) countries*. The value investment style characteristics for index construction are defined using three variables: book value to price, 12-month forward earnings to price and dividend yield. With 1,313 constituents, the index targets 50% coverage of the free float-adjusted market capitalization of the MSCI ACWI Index. The S&P 500 Index is an unmanaged market index generally considered representative of the stock market as a whole. The index focuses on the Large-Cap segment of the U.S. equities market. It is not possible to invest directly in an unmanaged index.
This material contains the opinions of the manager and such opinions are subject to change without notice. This material has been distributed for informational purposes only and should not be considered as investment advice or a recommendation of any particular security, strategy or investment product. Information contained herein has been obtained from sources believed to be reliable, but not guaranteed. No part of this material may be reproduced in any form, or referred to in any other publication, without express written permission. PIMCO is a trademark of Allianz Asset Management of America L.P. in the United States and throughout the world.
© 2018, PIMCO.
© PIMCO
Read more commentaries by PIMCO