The Seven-Per-Cent Solution: Being a Reprint from the Reminiscences of John H. Watson, M.D. is a 1974 novel by American writer Nicholas Meyer. It is written as a pastiche of Sherlock Holmes, and was made into a film of the same name in 1976. Published as a "lost manuscript" [about] the late Dr. John H. Watson, the book recounts Holmes' recovery from cocaine addiction (with the help of Sigmund Freud) and his subsequent prevention of a European war through the unravelling of a sinister kidnapping plot.
... Wikipedia
We have long been big fans of the books about Sherlock Holmes ever since our misbegotten youth. Strangely enough, being a strategist/analyst is much like being a detective. One has to gather the evidence, pour through it, decipher it, eliminate the “noise,” and come to a conclusion that tips the odds of making money in our favor. We have been doing that professionally for 47 years and investing with our father for over 54 years. We have made a number of bad “calls,” yet in this business when you take a stand and make a “call,” you are going to make mistakes. As often stated, “When you are wrong you say you are wrong and you say it quickly for a de minimis loss of capital,” a trait not many have in this business. That said, our correct “calls” have vastly outweighed our bad “calls.” Most recently, we noted that our short/intermediate proprietary models, after being constructive for a REALLY long time, were targeting early to mid-February as a point of downside vulnerability (bear in mind that our models have a plus/minus three-session variability). Accordingly, the Dow Dive began last Monday (1-29-18) exactly three sessions before the beginning of February. Subsequently, the senior index has surrendered over 3% from the recent all-time highs. Yet as one of our financial advisors emailed me last Friday, “You didn’t tell us it was going to be this bad!” “Really,” 3.9% off of the highs and we get bombarded with comments like that.
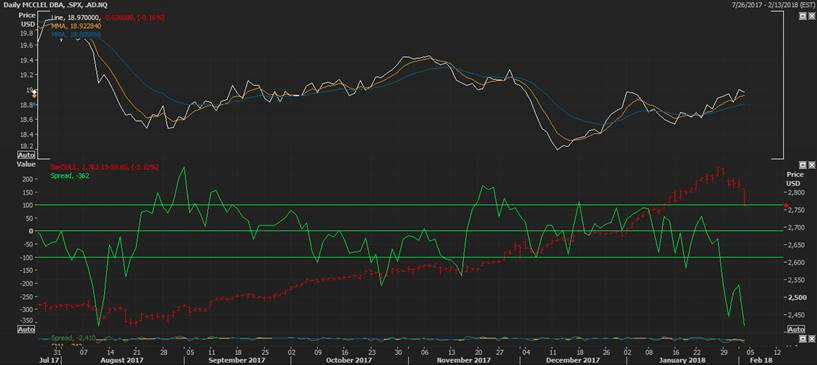
Another question was, “How far can this decline go?” Such questions caused us to pull up a chart of the S&P 500 (SPX/2762.13) to look for what would seem to be a reasonable support level for the SPX. Before we forget, remember, our models do not tell us how far a decline, or rally, will go. All they tell us is the equity markets are nearing either a point of vulnerability, or a point for a decent rally. Nevertheless, studying the chart reveals there are a number of support levels. There is a gap in the SPX chart at 2767, 2750, 2736, 2723, and 2714, which could represent support. However, 2672 would be a 7% pullback from the peak that should find major support at the mid-December 2017 lows, aka “The 7% Solution.” To be sure, that would be enough to spook the majority of participants and represent a decent point of entry. That said, there could be some kind of throwback attempt this week since the McClellan Oscillator is extremely oversold (Chart 1), but we would not trust it.
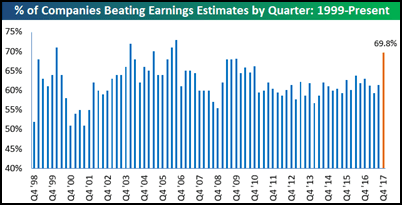
Moving on to earnings, since in the long run it is all about earnings, earnings and revenues remain pretty good. Recall, we suggested the equity markets had transitioned from an interest rate driven market to an earnings driven bull market in the back-half of 2016 (Chart 2). BINGO that is exactly what happened. Therefore we were quite interested in these comments from our friend, CNBC’s Bob Pisani last Friday:
Half of the S&P will have reported by the end of the day today, and it is turning into an extraordinary quarter. Earnings are up nearly 15% from the same period a year ago, and keep rising, according to Thomson Reuters. That is a blended estimate, and includes companies that have not reported yet. If you just count the companies that have already reported, the actual earnings are up 17.3%. That would be the highest growth since the third quarter of 2011. Far more are beating estimates (nearly 80%) than the average (64%), and they are beating by a wider margin.
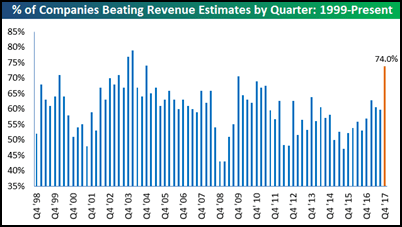
Most importantly, revenue growth has returned. The earnings gains are no longer coming primarily from cost cutting: revenue growth, at 8.0 percent, is the highest since the third quarter of 2011, and 82% are beating the revenue estimates (also far higher than the 60% average). As with earnings, they are beating by a wider margin (6.1 percent), more than twice the average of 3.1 percent.
After last Friday’s Flop the sagacious Bob Pisani wrote this:
The selloff: is there a catalyst for a deeper correction? The S&P is only 3.9% from its historic high, but traders are already debating whether there could be a deeper correction coming. For the moment, the bears have the upper hand. They cite: 1) the surge in wages (up 2.9% year-over-year, highest since 2009), 2) a sudden acceleration in bond yields (from 2.5% to over 2.8% in three weeks), that is already affecting key areas of the market (the Homebuilding ETF (XHB) is down 10 percent in the past week and a half) 3) a dollar that has stabilized and showing signs of strengthening, and 4)investor sentiment that is at multiyear extremes (the BofA Merrill Lynch Bull & Bear indicator is at the highest level since March 2013; the Goldman Bull/Bear Market Indicator is at the highest level in 10 years)
The bulls argue this is no time to panic, that the macro environment is still nearly perfect, and that a "tradeable correction" (market down 5%) will bring out plenty of buyers. Joe Zicherman of Stadium Capitaltold me that a good placemark is the 50-day moving average in the S&P 500, currently around 2,716, about 50 points below where market is now. Hitting that would be a decline of about 6% from the historic high of 2,872 we hit on January 26th. For everyone who keeps saying they would love to buy the markets 5 percent lower, that’s a good number to keep in mind.
The call for this week: “Never on a Friday” is a mantra we came up with years ago meaning that once the equity markets get into one of these downside skeins they typically do not bottom on a Friday. It gives participants time over the weekend to brood about their losses and then they “show up” in sell-mode on Monday/Tuesday leading to Turning Tuesday. With the McClellan Oscillator EXTREMELY oversold we would look for some kind of throwback rally attempt early this week. Regrettably, we do not think it will stick. And, then there was this from the eagle-eyed Jason Goepfert of SentimenTrader fame:
- 4 standard deviations. Friday’s decline was 4 standard deviations from the average move over the past year. We don’t often see a move that extreme so close to what had been a new high in the indexes, the last one occurring in February 2007.
- Worst week in years. The S&P’s week was the worst in well more than a year, following a week when it had been at a new high. Other times it reversed like this, it rebounded every time over the medium term, with extremely positive risk/reward ratios.
- Another streak gone. The drop was enough to end the S&P’s longest-ever stretch without a 3% pullback from a high.
- Finally, a little fear. The VIX jumped more than 25% while the S&P managed to hold above its 50- and 200-day averages, and there was also record high volume in inverse ETFs.
- The latest Commitments of Traders report was released, covering positions through Tuesday.
PS – The worst set of TV Super Bowl commercials of my life!
Chart 1: McCellan Oscillator (green line)

Click here to enlarge
Chart 2:
Click here to enlarge
Click here to enlarge
Additional information is available on request. This document may not be reprinted without permission.
Raymond James & Associates may make a market in stocks mentioned in this report and may have managed/co-managed a public/follow-on offering of these shares or otherwise provided investment banking services to companies mentioned in this report in the past three years.
RJ&A or its officers, employees, or affiliates may 1) currently own shares, options, rights or warrants and/or 2) execute transactions in the securities mentioned in this report that may or may not be consistent with this report’s conclusions.
The opinions offered by Mr. Saut should be considered a part of your overall decision-making process. For more information about this report – to discuss how this outlook may affect your personal situation and/or to learn how this insight may be incorporated into your investment strategy – please contact your Raymond James Financial Advisor.
All expressions of opinion reflect the judgment of the Equity Research Department of Raymond James & Associates at this time and are subject to change. Information has been obtained from sources considered reliable, but we do not guarantee that the material presented is accurate or that it provides a complete description of the securities, markets or developments mentioned. Other Raymond James departments may have information that is not available to the Equity Research Department about companies mentioned. We may, from time to time, have a position in the securities mentioned and may execute transactions that may not be consistent with this presentation’s conclusions. We may perform investment banking or other services for, or solicit investment banking business from, any company mentioned. Investments mentioned are subject to availability and market conditions. All yields represent past performance and may not be indicative of future results. Raymond James & Associates, Raymond James Financial Services and Raymond James Ltd. are wholly-owned subsidiaries of Raymond James Financial.
International securities involve additional risks such as currency fluctuations, differing financial accounting standards, and possible political and economic instability. These risks are greater in emerging markets.
Investors should consider the investment objectives, risks, and charges and expenses of mutual funds carefully before investing. The prospectus contains this and other information about mutual funds. The prospectus is available from your financial advisor and should be read carefully before investing.
© Raymond James
© Raymond James
Read more commentaries by Raymond James