ETFs continue to play a highly disruptive role in money management. RBA has embraced this trend by employing what we refer to as Pactive™ Management, which is the active allocation, whether strategic or tactical, of passive investment instruments such as ETFs, stock baskets, and index funds. These Pactive™ portfolios have quickly become the fastest growing part of our business.
We have refuted the concerns of some critics of ETFs, however, we join some of the naysayers when it comes to “Factor ETFs.” Our research suggests that Factor ETFs’ actual sources of returns often have little, if anything, to do with the factor* included in the ETF name (i.e., value, growth, or size).
* Factor as defined by a leading risk model provider
X-Raying ETFs
RBA’s approach to ETF management is quite different from that of most ETF managers. Our clients’ portfolios typically contain
10-20 ETFs, but internally at RBA we manage the portfolio using the underlying holdings of the ETFs, i.e., as though our portfolio had hundreds or even thousands of securities. When searching for a new ETF, RBA looks beyond basic characteristics like management fees, liquidity, etc., and searches for ETFs that best fit with the existing ETFs in the portfolio while aiming for certain overall portfolio-level exposures. Those exposure goals might relate to size, style, sector, geography, quality, yield, etc.
We call this process of managing ETF portfolios via the underlying holdings “X-Raying” the ETFs, and our x-ray analyses have become increasingly important as the number of ETFs has multiplied. Because there are now so many ETFs from which to choose, our analyses have had to become more sophisticated to ensure that our clients’ portfolios are structured as closely as possible to the desired targeted exposures.
Issue #1: The Cyclicality of Factors
While at Merrill Lynch in 1991, we began publishing Quantitative Profiles. The “QP,” as it was known, was ground breaking at the time because it was the first widely published research that examined the cyclicality and efficacy of various stock selection strategies and factors. This research led to a book called “Style Investing – Unique Insights into Equity Management” (John Wiley & Sons, 1995), which was the seminal book regarding the timing of styles and factors.
Our research clearly determined that styles and factors were highly cyclical, and that one’s portfolio could have significant periods of underperformance if one naively invested in one side of a style decision (e.g., small versus large capitalization stocks).
Investors in today’s Factor ETFs must be cognizant of the potential cyclicality of factor performance, and need to fully understand how the macroeconomy can influence a particular factor’s performance and for how long.
Issue #2: Are the potential returns of Factor ETFs driven by the named factor?
One would think that a Factor ETF’s performance would be driven by the factor advertised in its name. Our proprietary research shows that most factor ETFs are hardly pure investments in the named factor. Worse yet, the specific named factor often had little influence on a Factor ETF’s sources of potential return.
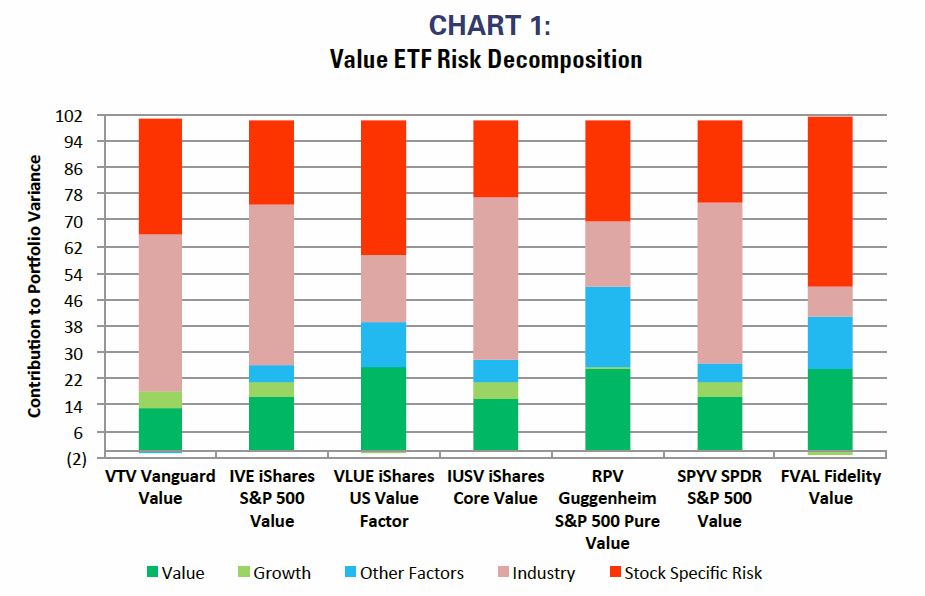
Chart 1 shows the risk decomposition of some of the most popular “value” factor ETFs. The bars in the chart highlight that the proportion of the underlying value portfolios’ risk (i.e., a source of potential return) has been attributable to value, growth, other possible factors (such as size, momentum, exchange rate sensitivity, liquidity, etc.), industry concentration, and stock specific risk. The dark green portion in each bar is the value contribution. In no case was value the primary contributor to portfolio risk in any of the value ETFs. The largest contribution was about 25%. In nearly every case, industry exposure was a larger determinant of risk than was value. In fairness, some of these value factor ETFs include a negative bet on growth. However, even the contribution of value and negative-growth rarely outweighs the industry and stock specific risks.

Source: Richard Bernstein Advisors, Axioma Inc.
Some ETFs may show values below 0% or above 100% due to diversification benefits of certain factors which detract from portfolio variance.
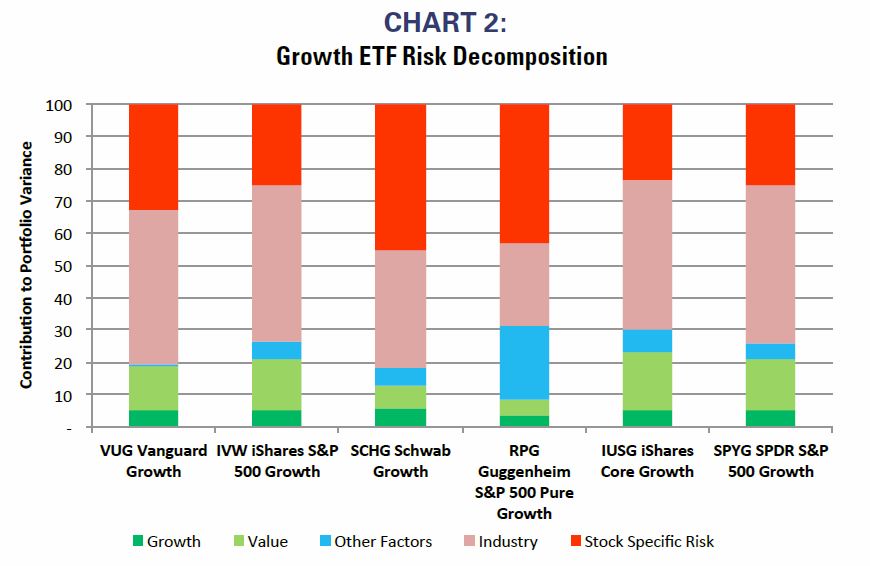
We found similar issues with growth factor ETFs. Chart 2 shows the risk decomposition of some popular growth ETFs. Most of these ETFs derive their growth exposure by taking a negative bet on value. However, it is clear in the chart that industry and stock specific risk overwhelm the growth and value factor exposures.
Source: Richard Bernstein Advisors, Axioma Inc.
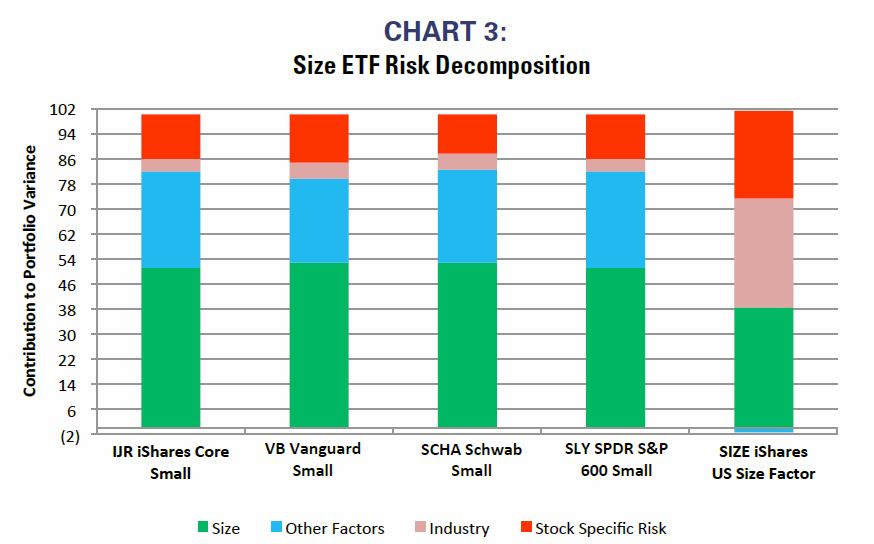
The risk related to size-related ETFs seems to be more associated with size. As Chart 3 highlights, size contributes roughly 35-55% to the total risk of the major size ETFs. In one case, however, the combination of industry and stock specific risks is considerably larger than is the size risk.
Source: Richard Bernstein Advisors, Axioma Inc.
Some ETFs may show values below 0% or above 100% due to diversification benefits of certain factors which detract from portfolio variance.
What’s in your ETF portfolio?
RBA’s proprietary research examines both the timing of factor cyclicality and the factor risk decomposition of ETFs. We think both are critically important to successful ETF portfolio investing.
Our analyses of some of the most popular factor ETFs suggest that the factor advertised in the ETF’s name is rarely the primary source of a factor ETF’s potential returns. One might think one has a portfolio allocated to value within one’s portfolio only to find that the true allocation is to a particular industry.
Our research over the past 25 years definitively shows that factor performance is highly cyclical. The annual Dalbar studies of mutual fund flows suggest that investors have been very poor timers of these factor cycles. We strongly doubt that investors will be any more successful in their timing of growth and value ETFs than they were in their timing of growth and value mutual funds.
So, with apologies to the credit card company, what’s in your ETF portfolio?
Special thanks to Stacy Hendler for her ETF analysis.
|
|
© Copyright 2017 Richard Bernstein Advisors LLC. All rights reserved. PAST PERFORMANCE IS NO GUARANTEE OF FUTURE RESULTS
Nothing contained herein constitutes tax, legal, insurance or investment advice, or the recommendation of or an offer to sell, or the solicitation of an offer to buy or invest in any investment product, vehicle, service or instrument. Such an offer or solicitation may only be made by delivery to a prospective investor of formal offering materials, including subscription or account documents or forms, which include detailed discussions of the terms of the respective product, vehicle, service or instrument, including the principal risk factors that might impact such a purchase or investment, and which should be reviewed carefully by any such investor before making the decision to invest. Links to appearances and articles by Richard Bernstein, whether in the press, on television or otherwise, are provided for informational purposes only and in no way should be considered a recommendation of any particular investment product, vehicle, service or instrument or the rendering of investment advice, which must always be evaluated by
a prospective investor in consultation with his or her own financial adviser and in light of his or her own circumstances, including the investor’s investment horizon, appetite for risk, and ability to withstand a potential loss of some or all of an investment’s value. Investing is subject to market risks. Investors acknowledge and accept the potential loss of some or all of an investment’s value. Past performance is, of course, no guarantee of future results. Views represented are subject to change at the sole discretion of Richard Bernstein Advisors LLC. Richard Bernstein Advisors LLC does not undertake to advise you of any changes in the views expressed herein.
© Richard Bernstein Advisors LLC
© Richard Bernstein Advisors
Read more commentaries by Richard Bernstein Advisors