Problems The Media Ignored In The April Jobs Report
|
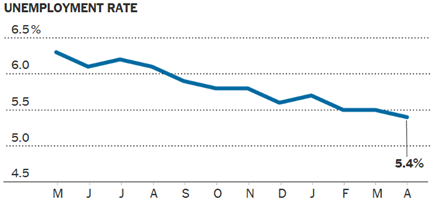
Overview Today we’ll start with a look at last Friday’s unemployment report for April. If you read the mainstream media accounts, it was fantastic – the official unemployment rate fell to 5.4%, the lowest level since 2007. But as usual, if we dig into the internals of the report, we find that the results were much less than desired. One of those findings was the fact that the percentage of adult women in the workforce has fallen to the lowest level in 27 years, but you had to look deep into the report to discover that data. The reasons for this phenomenon are not entirely clear, but I will offer some suggestions, in what is a rapidly growing debate. Following that discussion, we take a look at the exploding growth in “margin debt” on the New York Stock Exchange. In March, margin debt soared to a new record high of $476.3 billion. Some analysts believe this is a major problem for the equity markets, while others think it’s a positive development. But what we do know is that margin debt peaks at major market tops. With the major market indexes at or near their all-time highs, the next few weeks should be very interesting! April Unemployment Report – Not All Good News If you only read the mainstream media coverage of last Friday’s unemployment report for April, you would think it was the best economic news in eight years. And that was true for the headline unemployment rate which fell from 5.5% to 5.4%, the lowest since May 2007. However, as is often the case, some of the internals of the report were disappointing. Let’s take a look.
The economy added 223,000 net new jobs in April, largely in-line with pre-report forecasts, according to the Bureau of Labor Statistics (BLS). You may recall that in early April, the BLS reported that only 126,000 new jobs were created in March, less than half of the pre-report consensus. Well guess what? The BLS revised the March jobs number all the way down to only 85,000 in the latest report. March was a disaster! Wage growth, which has been sluggish throughout the recovery, ticked up only modestly in April. Average hourly earnings increased 3 cents to $24.87 an hour. Over the past year, pay is up only 2.2%, which is well below the average of post-war economic recoveries. At 5.4%, the headline unemployment rate is down sharply from nearly 8% two years ago, and forecasters say it could fall below 5% by the end of this year if hiring continues to gain steam. But the broadest measure of unemployment, which includes people forced to take part-time positions because they cannot find full-time work, remains high for non-recessionary times at 10.8%.
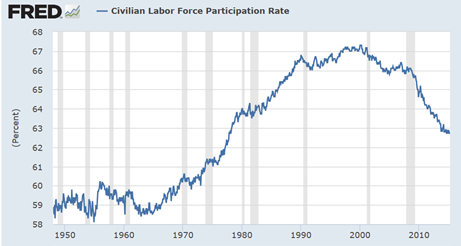
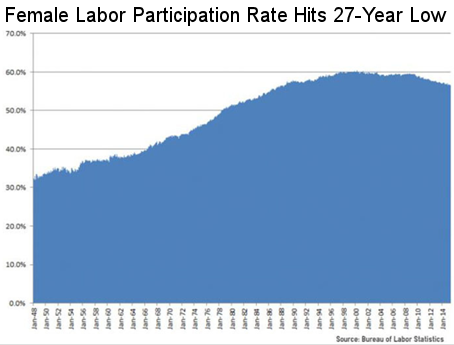
At the same time, millions of workers have given up the search for jobs entirely and dropped out of the workforce since the late 1990s. The Labor Force Participation Rate ticked higher to 62.8% last month but remains at the lowest level since 1978. To put this in perspective, there are93.2 million working-age Americanswho are not in the workforce. That is a new all-time record! The question is why? The answer, of course, is complicated but the fact is that more and more Americans are choosing not to work and many are living off of government benefit programs. And there was more ugly data in the jobs report. Specifically, the number of full-time jobs dropped by 252,000 in April – the media rarely if ever mentions this. When it comes to full- time jobs there are still 1.1 million fewer now than at the pre-crisis peak in 4Q 2007. Since April 2000, the BLS’ full-time job count has grown at only 0.35% annually. During the 15 years prior to 2000, full-time jobs grew by 1.8% annually – that’s five times as fast! But it gets worse. Between 1985 and 2000, the adult civilian population (16 years +) grew by 34 million and the number of full time jobs increased by 26 million, or by fully 76% of the population gain. By contrast, during the 15 years since the turn of the century, the adult population grew by 38 million, but the number of full-time jobs rose by only 6.2 million. In short, since 2000 the nation gained 38 million more adult consumers, but new jobs have been created for only 15% of them. And that dismal trend is guaranteed to get worse because it’s baked into the demographic cake. Today we have apprx. 45 million retirees, but that number will grow to 75 million less than two decades down the road. Another 30 million Americans will be out of the workforce in 2025. As you can see, these monthly jobs reports are about so much more than the headline unemployment rate and how many new jobs are created each month. Percent of Women in the Workforce Hits 27-Year Low The number and percentage of working-age women in the workforce have increased consistently since the 1940s, that is until the year 2000 when the percent of women in the labor force peaked at just over 60%. Since then, however, the percent of women in the workforce has declined significantly Last Friday’s unemployment report revealed that the participation of women in the US workforce hit a 27-year low in April, with a record 56.2 million working-age women not registered as working. This lowered the women’s participation rate to 56.6%, according to the BLS, the lowest percentage since 1988, since 36,000 more women dropped out of employment in April alone. The official unemployment rate among women also increased slightly, from 5.3% in March to 5.4% in April, according to data released Friday.
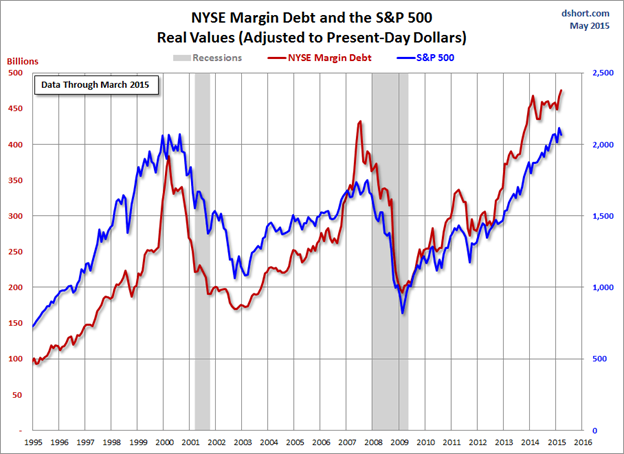
The question is, of course, why are women leaving the workforce after over 50 years of increasing their numbers? Here are some of the usual answers. Many supposed experts on this subject point to the fact that we had two serious recessions since 2000 that punished many of the fields dominated by women. They point out that women account for nearly 60% of state and local government jobs and 70% of educators. Next, they point to the fact that more women are leaving the workforce to care for children or elderly parents. Given the significant increase in the cost of child-care in recent years, more women are deciding to stay at home. Along this line, they also point to the so-called “income gap” in which women make considerably less in many cases than men in a similar position. When a woman’s pay is below a certain level, she may well decide it isn’t worth keeping her job, especially if the family has another breadwinner. Additionally, some polls have found that the experience of not working is also considerably more positive for women than men, which means that women are often not desperate to work or as inclined to return to the workforce. While the reasons cited above play a role, there are other factors at work. For example, late last year a NY Times/CBS News/Kaiser Family Foundation poll found that the steepest declines in workforce participation were among unmarried, childless women. That just doesn’t make sense – those women should be the most likely to be working. And there’s no mention of the growing number of Baby Boomer women who are returning to work to help boost their family retirement savings. For most of these women, their children are out of the house and they are free to take a job to help build their underfunded retirement nestegg. Yet another reason is a Harvard study late last year which found that most women who are leaving the workforce are not doing so because of the need to care for children or the elderly. Instead, this study concluded that women are leaving because they were not satisfied with their careers. Only 41% of women said they were satisfied with their opportunities for career growth. The bottom line is: A growing percentage of women are leaving the workforce for a variety of reasons. While some of the reasons are admirable, others are troubling. In any event, the shrinking percentage of women in the workforce is not good for the economy. Margin Debt on New York Stock Exchange Hits Record High I suspect that relatively few retail investors pay much, if any, attention to the level of “margin debt” that is outstanding at any given time. Margin debt is the money that stock market participants borrow against the value of their investment portfolios, and it is now flashing red for some. Margin debt is created when investors borrow money in order to buy stocks. If an investor buys $100 worth of stocks with $50 in capital, that individual has $50 of margin debt outstanding. Since margin debt provides leverage, it amplifies gains, but also increases the risk to an investor if the market goes down. The NYSE margin debt level for March, the latest reporting period, hit a record of $476.3 billion, up from $464.9 billion at the end of February. Let that soak in for a moment. That means margin debt grew by $11.4 billion in the month of March alone – a month in which the S&P 500 actually fell by 2%. By comparison, in March 2009, at the beginning of the current bull market, the level of margin debt was only $182 billion. Margin debt has long been viewed by many as a sentiment indicator of risk taking. So the thinking goes that higher levels of borrowing against portfolios can only mean that investors are getting too exuberant. One thing is for sure, though, margin debt peaks around major tops in the stock markets.
Margin debt tends to be highly correlated with the level of the market. Higher prices tend to spur more buying – and similarly, more buying on margin tends to spur higher prices – until it doesn’t! When the market does finally turn lower, margin debt can lead to margin calls much quicker for accounts with the added leverage. Notice in the chart above that in 2007 margin debt spiked sharply higher just before the market started to tank at the end of the year. Notice also that margin debt since late 2012 has been in a significantly steeper trajectory than the S&P itself – with margin debt up over 50% since then. So even though the market has struggled this year, margin debt has soared to a new record high. So should we be fearful? Well, we can certainly see what happened the last two times when margin debt hit a new record high in 2000 and late 2007. No one knows if we are at a major turning point in the market, but the steep rise in margin debt sure looks “frothy” to me. Some analysts see it differently and view rising margin debt as a good thing. Since most margin debt is used by institutions and professional traders, some analysts view the recent increase as a sign that these sophisticated players are even more confident that the market is headed higher. But as I said above, buying on margin tends to spur prices higher – until it doesn’t. Financial writer and hedge fund manager Jesse Felder quoted some interesting statistics in his blog last week: Over the past 20 years, the level of margin debt relative to the economy has had nearly an 80% negative correlation to future 3-year returns in the stock market. What this means is, the higher the level of margin debt relative to GDP, the lower the returns for the stock market over the coming 3 years and vice versa. [Emphasis mine.] Felder warns that with margin debt at a new all-time high, the next downward trend could be very severe. He goes on: In my view, margin debt is a very good way to “take the market’s temperature.” The extreme level of margin debt-to-GDP clearly shows investors have become “recklessly confident.” Prudent investors should react by becoming more cautious. And, from a contrarian standpoint, the fact that popular bloggers are dismissing this idea despite its mathematical validity adds an exclamation point to that idea. Most analysts agree that we are at a critical juncture, what with the major stock indexes trading at or near their all-time highs. So it may not be long before we know if the next move is a new leg on the upside or the beginning of a major correction. |
|
Forecasts & Trends E-Letter is published by ProFutures, Inc. Gary D. Halbert is the president and CEO of ProFutures, Inc. and is the editor of this publication. Information contained herein is taken from sources believed to be reliable but cannot be guaranteed as to its accuracy. Opinions and recommendations herein generally reflect the judgement of Gary D. Halbert (or another named author) and may change at any time without written notice. Market opinions contained herein are intended as general observations and are not intended as specific investment advice. Readers are urged to check with their investment counselors before making any investment decisions. This electronic newsletter does not constitute an offer of sale of any securities. Gary D. Halbert, ProFutures, Inc., and its affiliated companies, its officers, directors and/or employees may or may not have investments in markets or programs mentioned herein. Past results are not necessarily indicative of future results. Reprinting for family or friends is allowed with proper credit. However, republishing (written or electronically) in its entirety or through the use of extensive quotes is prohibited without prior written consent. |
| © Halbert Wealth Mangement |