“Even a return to median bull market valuations would be brutal for the most popular tech stocks. We’re not even talking about bear market valuations, and we’re making the leap of faith, contrary to the evidence, that the quality of current revenues is as high as those generated during the past decade. To illustrate the probable epilogue to the current bubble, we’ve calculated price targets for some of the glamour techs, based on current revenues per share, multiplied by the median price/revenue ratio over the bull market period 1991-1999.
Cisco Systems: $18 ¾ (52-week high: $82)
Sun Microsystems: $4 ½ (52-week high: $64)
EMC: $10 (52-week high: $105)
Oracle: $6 7/8 (52-week high: $46)
“Get used to those itty-bitty prices... And hey, we’re being optimistic.”
Hussman Investment Research & Insight, January 8, 2001
In the bear market that followed, those “four horsemen” of tech would fall about 50% below the price targets noted above, except for Oracle, which halted its decline about 3/8 of a point above that target.
We’ve taken a great deal of care in recent months to emphasize that price/earnings ratios are terribly unsuitable to gauge valuation (or estimate long-term prospective returns) unless the earnings figure being used isrepresentative and proportional to the very long-term, multi-decade stream of future cash flows that will be made available to investors over time. Unfortunately, profit margins vary dramatically over the course of the normal business cycle, which demands that investors normalize earnings by accounting for the profit margins that are embedded into them at any given time.
It turns out that every popular earnings-based measure (price to trailing earnings, price to forward earnings, Shiller’s cyclically adjusted P/E, market capitalization to corporate profits) can be made significantly more reliable by pairing the P/E multiple with a consideration of the profit margin embedded within. Indeed, if we statistically relate P/E ratios and profit margins (technically their logarithms) to actual subsequent 10-year market returns, we discover that both factors enter the regression with nearly identical coefficients, meaning thatthe two can be combined without any loss of information (see Margins, Multiples, and the Iron Law of Valuation). Of course, the product of the P/E and profit margin (or the sum of their logarithms) is simply the price/revenue ratio.
Let’s be very clear – earnings are absolutely essential to generate deliverable cash flows for investors. It’s just that profit margins vary too much to use year-to-year earnings (and to some extent, even smoothed 10-year earnings) as a sufficient statistic for those multi-decade cash flows. Revenues turn out to be much better sufficient statistics. When we look across different companies and industries, of course, price/revenue multiples should and do differ quite a bit. Low margin businesses (such as grocery chains) typically trade at very low price/revenue multiples, while high margin businesses can justify higher price/revenue multiples – provided that revenues can be expected to be maintained or expanded for decades, and the business has distinct competitive advantages that protect margins from much erosion or variation over the economic cycle. There are fewer of those latter companies in existence than people think – they’re the ones that Warren Buffett tends to gravitate toward.
The danger comes when investors drive price/revenue multiples to market-wide extremes, across all stocks and industries. At bull market peaks, investors typically fail to recognize cyclically elevated profit margins, assuming that those margins are permanent and that earnings can be taken at face value. If there is one thing that separates our views here from the bulk of Wall Street analysis, it is the historically-informed insistence that investors are mistakenly banking on record-high profit margins to be permanent. For more on this, including evidence that historical profit margin dynamics remain quite on track and have not changed a whit, see The Coming Retreat in Corporate Earnings, and An Open Letter to the FOMC: Recognizing the Valuation Bubble in Equities.
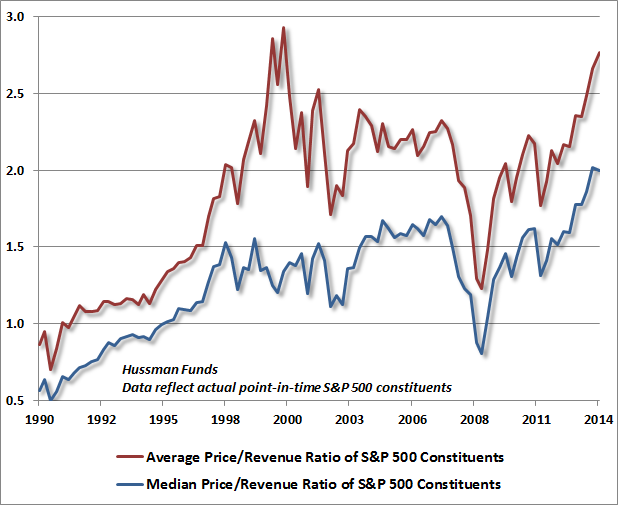
While the evidence may be alarming to some, make no mistake: The median price/revenue multiple for S&P 500 constituents is now significantly higher than at the 2000 market peak. The average price/revenue multiple across S&P 500 constituents is now above every point in that bubble except the first and third quarters of 2000. Only the capitalization-weighted price/revenue multiple – presently at about 1.7 – is materially below the price/revenue multiple of 2.2 reached at the 2000 peak. That’s largely because S&P 500 market capitalization was dominated by high price/revenue technology stocks in 2000. [Geek's Note: as a result, if one chooses a universe of stocks by first sorting by market capitalization, one will probably find that price/revenue multiples of those stocks are lower today than in 2000]. Regardless, the historical norm for the capitalization-weighted S&P 500 price/revenue ratio is only about 0.80, less than half of present levels. The fact is that unless current record-high profit margins turn out to be permanent, against all historical experience to the contrary, the overvaluation of the broad equity market is equal or more extreme today than it was at the 2000 bubble peak.
Bill Hester and Jeff Huber here at Hussman Strategic Advisors compiled the chart below using point-in-time constituents of the S&P 500 Index each quarter since 1990. Investors often forget that smaller stocks struggled during the final years of the bubble as investors clamored for glamour. Again, the broad stock market was much more reasonably valued in 2000 than it is today, as extreme valuations were skewed among the largest of the large caps. Not anymore. The Federal Reserve has stomped on the gas pedal for years, inadvertently taking price/earnings ratios at face value, while attending to “equity risk premium” models that have a demonstrablypoor relationship with subsequent returns. As a result, the Fed has produced what is now the most generalizedequity valuation bubble that investors are likely to observe in their lifetimes.
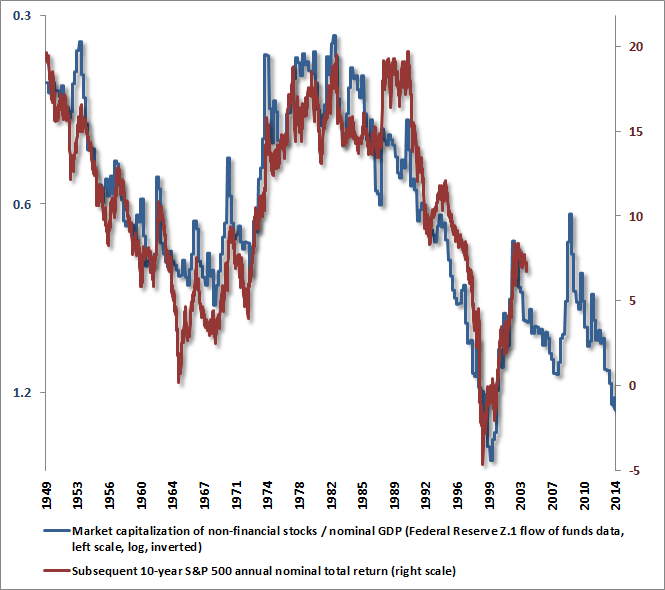
As a reminder of where capitalization-weighted valuations stand, the following chart shows the present ratio of market capitalization to GDP (shown on an inverted scale on the left, so richer valuations are lower on the chart). Actual subsequent 10-year S&P 500 total returns are plotted in red (right scale). Any belief that present levels represent a “zone of reasonableness” is detached from the historical evidence. The entire market does not deserve to be viewed as a wide-moat Buffett-type stock where earnings can be relied on as a sufficient statistic of value.
All of this said, I would be remiss if I did not emphasize that valuation is not a timing tool. We have a strong expectation that stocks will achieve weak total returns over the coming decade, and negative total returns over horizons shorter than about 7 years. But as the investment horizon shortens to less than a few years, other factors become more important in determining market returns.
For our part, the condition and uniformity of market internals across a wide range of stocks, industries, and security-types is an important consideration, as are extreme syndromes of overvalued, overbought, overbullish conditions. We’ve certainly observed overvalued, overbought, overbullish features for much longer than is historically typical, though we do believe that the consequences have been deferred rather than avoided. More importantly, the market has lost significant momentum, the stance of monetary policy is shifting to a less recklessly discretionary and more rules-based approach, and we’re observing increasing divergences in market internals. A loss of uniformity in market internals has historically been an important and subtle indication of rising risk aversion among investors.
The worst market outcomes, hands down, occur in those environments where rich valuations are coupled with deterioration in market internals and a shift toward increasing risk aversion. In contrast, the best market outcomes, hands down, occur in those environments where reasonable or depressed valuations are coupled with early improvement in market internals and a shift toward increasing risk tolerance. Though we fully anticipated the 2008 credit crisis and had no qualms about valuation after the market plunged (see Why Warren Buffett is Right and Why Nobody Cares), our greatest challenge in response to the policy errors that followed was the necessity of stress-testing against Depression-era outcomes. That prevented us from accepting opportunities in the recent half-cycle that both our pre-2009 methods and our present methods – had they been available at the time – would have captured (particularly in 2009 and early 2010). But our subjective “miss” should not be a reason for investors to ignore the objective risks over the completion of this cycle – from what is now the richestbroad market valuation that investors are likely to observe in their lifetimes, and that is increasingly coupled with divergent market action and deteriorating uniformity.
The likelihood is poor that from current price levels, broad equity investments – even held for nearly a decade – will generate any positive investment return at all. Among the saddest notes I received in the 2000-2002 and 2007-2009 bear markets were from people who had short investment horizons (and were therefore “forced” sellers) and lamented “I wish I had listened.” Whatever market returns we missed in the anticipation of those market declines were easily lost by the market anyway once the bears gained control. Recall that the 2000-2002 decline wiped out the entire total return of the S&P 500 – in excess of Treasury bill returns – all the way back to May 1996. The 2007-2009 decline wiped out the entire total return of the S&P 500 – again in excess of Treasury bill returns – all the way back to June 1995. I doubt that much of the market’s gain since 2009 will beretained by investors over the completion of this cycle. The run-of-the-mill bear market retraces more than halfof the preceding bull market gain. Those that begin from rich valuations wipe out far more.
I’ve historically encouraged buy-and-hold investors to maintain their own investment discipline, though with a realistic and historically-informed understanding of prospective return and risk. At present, my concern is that many buy-and-hold investors are unaware of how dismal prospective returns are likely to be from current prices, over every investment horizon of a decade or less. Given the duration of the equity market (which mathematically works out to be roughly the market price/dividend multiple), a passive 100% exposure to equities is appropriate only for investors with a horizon of about 50 years. Passive buy-and-hold investors would be well-advised to scale their equity exposures accordingly, based on their own actual investment horizons. Meanwhile, it seems clear that investors have mentally minimized their concept of potential downside, despite two 50% bear market losses in recent memory that were both accompanied by aggressive Fed easing all the way down.
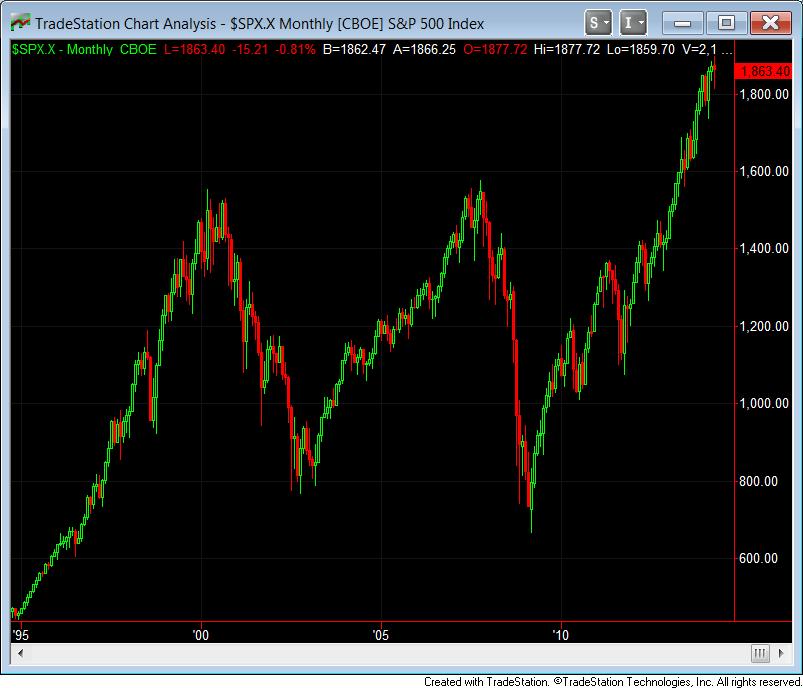
At present, the picture below is just a monthly chart of the S&P 500 since 1995. Not long from now, perhaps less than 2 or 3 years, many investors will look at the same chart with their head in their hands, asking “What was I thinking?” The central message to investors with unhedged equity positions and investment horizons shorter than about 7 years: Prospective returns have reached zero. The value you seek from selling in the future is already on the table today. The future is now.
Past performance does not ensure future results, and there is no assurance that the Hussman Funds will achieve their investment objectives. An investor's shares, when redeemed, may be worth more or less than their original cost. Current performance may be higher or lower than the performance quoted above. More current performance data through the most recent month-end is available at www.hussmanfunds.com. Investors should consider the investment objectives, risks, and charges and expenses of the Funds carefully before investing. For this and other information, please obtain a Prospectus and read it carefully.
(c) Hussman Funds