Over the long weekend I decided to type the words “buying stampede” into Google to see what popped up. To my surprise there were more than 2,000,000 “hits” on the phrase “buying stampede” and many of them were attributed to me. While that was a pretty humbling experience, it also was surprising because I would have thought more investors would have used that phrase in connection with the many upside rally skeins that have occurred over the past dozen years. The term “buying stampede” was first coined by me back in the 1970s when I observed that runaway rallies tended to have a rhythm to them. Indeed, a typical buying stampede lasts for 17 – 25 sessions with only one- to three-session pauses, or pullbacks, before continuing to trade higher. It just seems to be the rhythm of the “thing” in that it tends to take that long to get everyone bullish enough to throw in their “bear towels” and buy stocks just in time to make a trading top. While it’s true some stampedes have lasted for 25 – 30 sessions, it is rare to see one extend for more than 30 sessions. Prior to the past few years the longest buying stampede chronicled in my notes of some 50 years was the 38-session “march” into the August 1987 peak of 2722.42 by the D-J Industrial Average (INDU/15303.10), which set the stage for the Dow Theory “sell signal” of October 15, 1987 and subsequent stock market crash of October 19th. There is actually a plaque that resides in my office from a dear friend, and stock broker, titled “Runaway” with the record of Del Shannon’s hit tune “Runaway” attached. The second longest stampede occurred a few years ago and lasted for 53 sessions. However, the current buying stampede is nearly twice that long since today is session 102!
I revisit the “buying stampede” theme this morning because I have been deluged with emails about, “Is the current stampede over since the S&P 500 (SPX/1649.60) has closed down for three consecutive sessions?” First, my stampede sequence uses only the Dow Industrial, not the SPX. Second, it does not need any confirmation from the D-J Transportation Average (TRAN/6395.70), or any other index, like Dow Theory needs. Third, it does not measure the percentage gain that will be experienced by the Industrials during the stampede. Fourth, the buying stampede concept is based only on my own observations of investors’ emotions and the psychology I learned from the epic book “Extraordinary Popular Delusions and the Madness of Crowds” by Charles MacKay. Fifth, the reciprocal of a buying stampede is a “Selling Stampede,” which uses the same day-count sequence, except on the downside. Sixth, since the Industrials closed up 8.60 points last Friday the buying stampede is still in force with today being session 102.
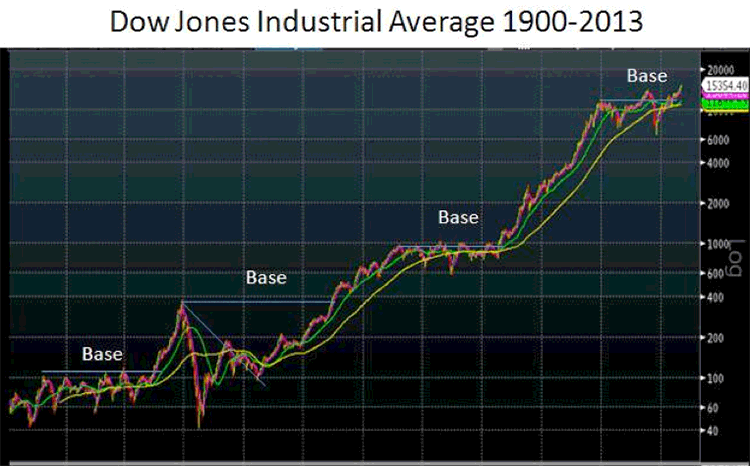
So the upside “Dream is Still Alive” (http://www.youtube.com/watch?v=KetnO1na-Jo), and I continue to believe the SPX is going to trade north of 1700 into the end of 2Q13 before becoming vulnerable to a more significant decline beginning in the July/August timeframe. Obviously I have never seen a buying stampede like this one, which has lifted the senior index above a basing formation in the charts that was 13 years in the making. I have commented on this upside breakout before having experienced the basing formation, and subsequent upside breakout, of the “big based” 1966 – 1982 market that launched the secular bull market of 1982 – 2000. I was reminded of the history of “big bases” in an excellent slide deck that was sent to me over the weekend, which was un-authored. The slides show that there have been four “big bases” since 1900 that have lasted for more than 12 years. The years in question are: 1906 – 1924 (18 years), 1929 – 1955 (26 years), 1966 – 1982 (16 years), and 2000 – 2013 (13 years), as can be seen in the attendant chart on page 3 from said slide deck. The author goes on to note, “The characteristics of the market when it breaks out of a base that exceeds 12 years in length is different. Investor behavior reflects an underlying distrust or disinterest and is characterized by underinvestment in equities. This results in a rebound that is relentless, providing little opportunity to buy on pullbacks.” If that prose sounds familiar, it should because it is very similar to the six stages of a bull market I wrote about on April 1st of this year. To wit:
“Following the end of a bear market, and the initial ‘lift off’ move of the beginning of a new bull market (Stage 1), there are tumultuous cries, ‘This is just a rally in an ongoing bear market,’ which brings us to Stage 2 (Guarded Optimism). E-v-e-r-y rally after a bear market bottom is encased with John Templeton’s pessimism/skepticism as represented by comments like, ‘This is the last chance to get out.’ Recall that was the media’s chant du jour after the March 2009 bottom as various pundits were trotted out to tell us how bad things were going to get. Yet, as participants realized their worst fears would not materialize, a ‘guarded optimism’ has set in whereby stocks are being bought because of their dividend yield. As things continue to get better, that ‘guarded optimism’ should give way to ‘enthusiasm,’ or Stage 3.”
Interestingly, in last Thursday’s conference call with Richard Bernstein, Rich spoke of the same stages. He reminded us of the selective memories investors have by stating that “uncertainty” spells opportunity. To be sure, “fear and uncertainty” are the hallmarks of the first seven innings of a secular bull market. When everyone is “certain” that typically means we are in the eighth inning of the “bull.” He went on to reflect about the beginning of the 1982 – 2000 secular bull market, opining that portfolio managers didn’t begin embracing stocks until 1985/1986, and that individual investors didn’t do so until the first quarter of 1987. Moreover, he noted that the same issues plaguing investors in 1982 and 1983 are the same issues currently plaguing investors (slow growth, budget deficits, entitlements, tax reform, etc.). Rich commented, “The equity markets don’t care about the ‘absolute’ of good or bad conditions, but about things being better or worse.” And, clearly the U.S. is getting better. He concluded with, “The rotation out of bonds into stocks is not the right question. The right question is about the great rotation out of non-U.S. equities into U.S. equities!”
Accordingly, it will be interesting to see if that rotation continues this week because last week was the first weekly loss in five weeks. The main culprit for the loss was Wednesday’s intraday 275-point downside reversal. Indeed, an early morning 154-point rally by the INDU gave way to a 122-point decline before firming into the close, leaving the senior index down roughly 80 points. By the close the INDU had traced out what a technical analyst would term an outside bearish reversal pattern, meaning Wednesday’s intraday high, and intraday low, were above and below the previous session’s high/low, suggesting the potential for further downside. And, that is what the equity markets attempted to build on the balance of last week without a whole lot of success. Nevertheless, the SPX has fallen below my 1660 “energy level” and as stated, “It is difficult for stocks to extend their rally with the daily internal energy level so low.” So, we enter this week with “guarded optimism,” waiting to see if the bears can press their advantage on last week’s stutter step.
The call for this week : While last Wednesday’s downside reversal raised a “red flag,” it was not a 90% Downside Day, meaning 90% of total volume, and total points, traded did not come on the downside. So, I agree with my unknown author, believing last week’s pause/pullback was for buying.
Click here to enlarge
© Raymond James