Global DC Plans: Similar Destinations, Distinctly Different Paths
- DC plans in in the U.S., Australia and the U.K. may benefit from better aligning asset allocation defaults to workers’ needed outcome: purchasing power in retirement.
- Focusing on needed outcomes would suggest a higher allocation to real assets, earlier de-risking and consideration of tail risk hedging.
As the shift away from traditional defined benefit pension plans continues globally, workers are increasingly reliant on defined contribution (DC) pension schemes to build their own retirement income. Australia, the U.S. and the U.K. lead in global DC development, with 81%, 58% and 26% of all pension assets, respectively, held in DC plans at the end of 2012, according to Towers Watson. DC plans will need to provide more than 60% of all retirement income for workers in these countries, according to the Organisation for Economic Co-operation and Development (OECD).
What’s interesting is that while the retirement-income reliance on DC plans is similar across these three countries, plan design and investment management differ dramatically. At PIMCO, we believe there are common principles that may improve success for DC plans globally. Of course, maximizing the amount contributed and retained is fundamental. Investment design, especially default strategies, is also vital to help build and preserve purchasing power and minimize volatility and market-shock risk.
What’s most critical is recognizing that workers have only one chance to get it right – they can work for only so many years and invest only so much of their income. Given this human-capital limitation, DC investment structures should operate within a worker’s loss capacity – never risking more than a participant could afford to lose.
Unfortunately, in evaluating the typical asset allocation designs in Australia, the U.S. and the U.K., we have found that workers in all three countries are exposed to risk beyond their capacity. We believe these plans would benefit from an analysis of the risk of loss in their investment defaults, as well as an analysis of the sources of risk. We encourage plan sponsors, trustees and providers to seek outcome-focused solutions that are consistent across global jurisdictions (while allowing for subtle nuances in local market requirements). They should embrace risk-capacity limits and offer strategies designed for risk diversification, inflation hedging and market-shock protection that may limit DC savers’ risks.
DC contributions … just do it!
American employers likely wasted well over a decade and many millions of dollars trying to persuade workers to contribute to their DC plans. Fortunately, with the enactment of the Pension Protection Act of 2006, more plan sponsors moved away from begging workers to opt in to their DC plans and now default workers into the plans (and require them to opt out if they prefer). This “just do it” auto-enrollment approach, now adopted by about half of U.S. employers, has leveraged human inertia to improve DC participation and contribution rates, with about 80% of participants making contributions, according to the Plan Sponsor Council of America. What’s more, auto-escalation of the contribution rate is helping to pump up the percentage of salary that Americans put away each year.
However, this is being offset by plan leakage. In the U.S., an estimated 10% of DC assets annually flow out of plans, primarily as workers move from employer to employer, thus reducing the buildup of retirement savings.
Australia and the U.K. have taken a more aggressive approach toward DC savings. Practically all employers in both Australia and the U.K. will have to offer a DC program by 2017. What’s more, Australia requires employers to contribute 9% of pay, rising to 12% by 2020, to a tax-advantaged retirement plan (overwhelmingly a “superannuation” DC program). Between 2012 and 2017, the U.K. is phasing in a requirement for employers to auto-enroll participants at a rate that will build to 8% of pay with at least 3% contributed by the employer (they may still opt out). In contrast to the U.S., once the money is in the Australian or U.K. programs, participants generally cannot withdraw funds until retirement age. Clearly, DC account values will build far more swiftly in the Australian and U.K. systems, given that they have plugged the drain on leakage. In the U.K., for instance, many companies report that more than 85% of members defaulted into plans do not opt out. American regulators are just beginning to study how to slow leakage from DC plans.
With the continued evolution toward DC in the U.S., and the increasingly disciplined approaches of Australian and U.K. contribution schemes, the case for ensuring that default strategies are robust and appropriate has never been stronger.
DC investment defaults … get the risk right
But where is all this auto-defaulted money going? The answer: into asset allocation strategies in one form or another. For instance, in the U.S. last year, 70% of DC plans defaulted to target-date strategies, 13% to a series of single balanced options and another 11% to a series of target-risk portfolios, according to a 2012 survey by the Plan Sponsor Council of America. In Australia, the default went to a single tactical balanced fund (which may be similar to the single balanced option in the U.S.). U.K. plans defaulted to a “lifestyle” allocation – an approach similar to a U.S. target date strategy, which shifts participants to a more conservative asset mix as they approach retirement.
There are stark differences among these defaults in asset and risk allocation, as well as in the implied risk of loss. This is bemusing, given that the ultimate challenge of DC contribution and investing – building retirement wealth sufficient to provide sustainable income from retirement until death – remains consistent in all three jurisdictions.
Let’s examine these plans from several perspectives: asset allocation, risk drivers, inflation hedging and probability of loss.
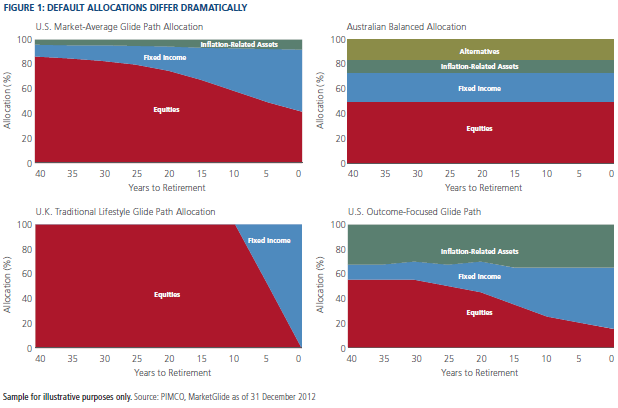
Asset allocation
As Figure 1 shows, typical default asset allocations in the U.S., the U.K. and Australia all have significant weights in equities and introduce nominal bond exposure at varying weights and times. The traditional U.K. approach encompasses a particularly aggressive allocation to equities up until close to retirement age. Although more modern approaches being advocated include a significant allocation to “diversified growth portfolios” (e.g., 30%) as an equity substitute, equity remains by far the dominant risk borne by U.K. participants for much of their savings journey. The U.S. and Australia include inflation-related assets, while the U.K. tends not to, although many of these diversified portfolios tend to reference “CPI-plus” as their objective. Australian balanced allocations stand out for including alternatives. By comparison, the outcome-focused glide path in the U.S. includes more inflation-hedging assets and de-risking relative to the other three asset allocation approaches.
Risk drivers
We believe it’s important to consider not only the asset allocation but also the overall volatility that a participant may face, as well as what may drive this volatility. Managing volatility in default strategies is important from a behavioral or risk tolerance standpoint. The U.S., U.K. and Australian DC plans all allow participants to change their asset allocations. Thus, while the retirement-income investment horizon may be decades long, a participant’s risk tolerance, that is, sensitivity to risk, may shorten the actual duration of their accumulation journey. Unfortunately, people may be most likely to move their allocations to lower-risk assets when markets decline and thus may lock in losses!

Unfortunately, when we consider asset allocation for participants at retirement, heavy equity risk remains in the U.S. and Australia, but a complete shift to fixed income risk occurs in the U.K. approach – a reflection of the common practice of U.K. participants to purchase an annuity immediately upon retirement (see Figure 3). We believe the heavy equity risk, particularly at retirement, may drive self-destructive behavior.


Finally, given these asset allocation structures, what is the probability of loss at different time frames prior to retirement? We believe this may be the most important question for plan sponsors to pose. Understanding and managing volatility is important from a risk tolerance perspective, while quantifying and limiting the risk of loss is vital from a risk capacity standpoint. If we consider the value at risk using a 95% confidence level, for the at-retirement allocation there is a potential 12-month mark-to-market loss of 26% for the U.K., 17% for Australia and 14% for the U.S. market-average asset allocation. By comparison, the outcome-focused glide path potentially reduces this risk to 9% (see Figure 5). Many plan sponsors may want to evaluate the risk of loss at a higher confidence level, such as 99%, to consider the possible market shocks, such as the 2008–2009 financial crisis.


In addition to capacity, we should also consider the behavioral aspects of incurring a significant loss. It may be all too easy to assume that DC investors are rational economic animals who recognize that bearing losses from time to time is an essential part of accumulating wealth for retirement. Unfortunately, the reverse often applies: Significant market downside events may trigger ill-advised changes in participants’ investment portfolios, or worse, a cessation in contributions altogether!
- World equity is a sensitivity of the portfolio to changes in the global equity markets.
- Equity industry includes exposure to 34 equity industries.
Duration (“interest rate” risk factor)
- Duration measures a bond’s sensitivity to a parallel shock of the par yield curve. PIMCO’s systems use a scenario-based duration calculation. Our algorithm first prices the security, and then shocks the interest rate to calculate the bond’s duration.
- Our systems generate several additional versions of interest rate duration, including proprietary duration measures such as:
– Bull duration: bond sensitivity to a fall in interest rates
– Bear duration: bond sensitivity to a rise in interest rates
– Forward secular duration: bond sensitivity to a forward-looking yield curve
shift scenario specified by PIMCO’s Investment Committee
- Interest rate duration assumes a parallel shift in the yield curve. But parallel shifts rarely occur because monetary policy acts mostly on the short end of the curve, while inflationary expectations are expressed in the longer end of the curve. Therefore, the yield curve typically steepens or flattens as interest rates move.
- Our systems define curve duration as the price sensitivity of a bond to a steepening of the yield curve. Every day, each bond is priced using our proprietary pricing models and then shocked to calculate its curve duration. Our algorithm uses the 10-year bond as an anchor point and measures steepening as the change in the two-to-10 year yield spread.
- Credit spread duration measures the sensitivity of the bond’s price to changes in the spread of a reference single-A-rated security. Our process to calculate credit spread duration follows two steps:
– First, the algorithm calculates the sensitivity of the bond price to its own
spread. This process occurs overnight and leverages our proprietary pricing
models.
– Second, the algorithm translates this own-security spread duration into a duration related to the reference single-A-rated security. This mapping relies on a proprietary model that takes into account the option-adjust spread (OAS)
of the bond under consideration and the OAS of the reference bond.
- EM Currency includes exposure to a basket of 30 emerging market currencies.
- Developed currency includes exposure to a basket of 11 developed market currencies.
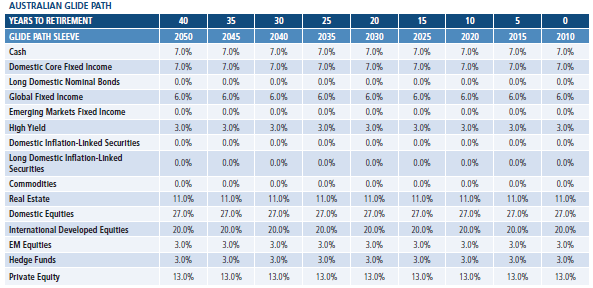
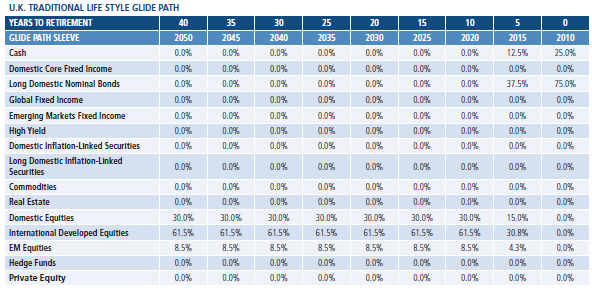
Glide path allocations
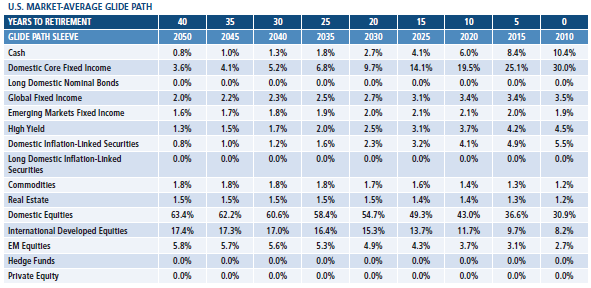
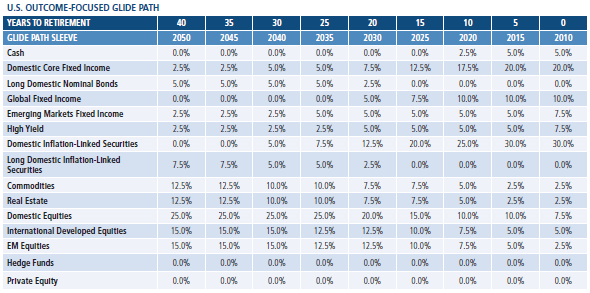
U.S. Outcome-based glide path is represented by the PIMCO glide path.
The glide path is intended to illustrate how allocations among asset classes change as a target-date approaches. The target asset allocation is based on a target date, which assumes a normal retirement age of 65, and time horizons based on current longevity of persons reaching retirement in average health. The glide path is designed to reduce risk as the target retirement date nears, but may also provide investors diversification across a variety of asset classes, with an emphasis on asset classes that may protect against inflation over time. The target allocations used in this presentation are for illustrative purposes only. They are based on quantitative and qualitative data relating to long-term market trends, risk metrics, correlation of asset types and actuarial assumptions of life expectancy and retirement.
The PIMCO glide path implements an optimal asset allocation mix that moves from higher risk to lower risk over time and is designed to manage the risk of an individual’s savings as they approach retirement. The glidepath acts as a “benchmark portfolio,” reflecting an allocation that is optimal with respect to our long-run, real return assumptions for each asset class (referred to above as “capital market assumptions”). The PIMCO glide path optimization takes into account the compounding of returns over the given investment horizon, unlike standard mean-variance analysis. PIMCO’s approach to developing a glide path incorporates liability-driven modeling in a “real return” framework, using a broad opportunity set of asset classes seeking to deliver meaningful improvements over traditional approaches. This approach may increase the median return and narrow the range of expected future outcomes when compared to the typical glidepath, while hedging the risk of future inflation and reducing the risk of a shortfall in future sustainable spending power. More income is likely to distribute near the median.
No representation is being made that any account, product, or strategy will or is likely to achieve profits, losses, or results similar to those shown. Hypothetical or simulated performance results have several inherent limitations. Unlike an actual performance record, simulated results do not represent actual performance and are generally prepared with the benefit of hindsight. There are frequently sharp differences between simulated performance results and the actual results subsequently achieved by any particular account, product, or strategy. In addition, since trades have not actually been executed, simulated results cannot account for the impact of certain market risks such as lack of liquidity. There are numerous other factors related to the markets in general or the implementation of any specific investment strategy, which cannot be fully accounted for in the preparation of simulated results and all of which can adversely affect actual results.
The portfolio analysis is based on the Market Average and PIMCO glide paths. No representation is being made that the structure of the average portfolio or any account will remain the same or that similar returns will be achieved. Results shown may not be attained and should not be construed as the only possibilities that exist. Different weightings in the asset allocation illustration will produce different results. Actual results will vary and are subject to change with market conditions. There is no guarantee that results will be achieved. No fees or expenses were included in the estimated results and distribution. The scenarios assume a set of assumptions that may, individually or collectively, not develop over time. The analysis reflected in this information is based upon data at time of analysis. Forecast, estimates, and certain information contained herein are based upon proprietary research and should not be considered as investment advice or a recommendation of any particular security, strategy or investment product.
PIMCO routinely reviews, modifies, and adds risk factors to its proprietary models. Due to the dynamic nature of factors affecting markets, there is no guarantee that simulations will capture all relevant risk factors or that the implementation of any resulting solutions will protect against loss. All investments contain risk and may lose value. Simulated risk analysis contains inherent limitations and is generally prepared with the benefit of hindsight. Realized losses may be larger than predicted by a given model due to additional factors that cannot be accurately forecasted or incorporated into a model based on historical or assumed data.
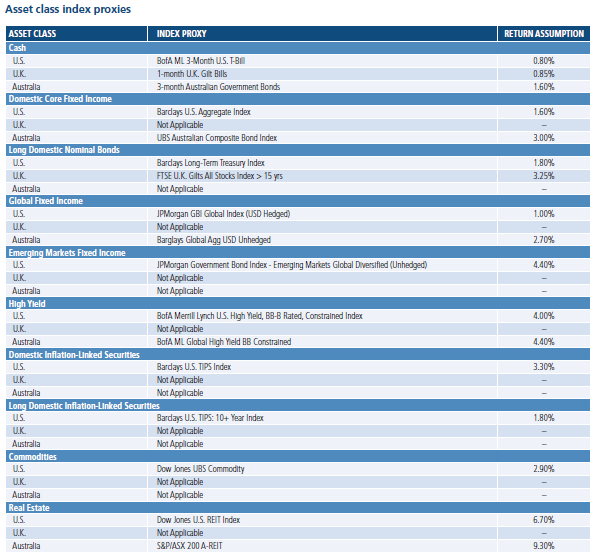
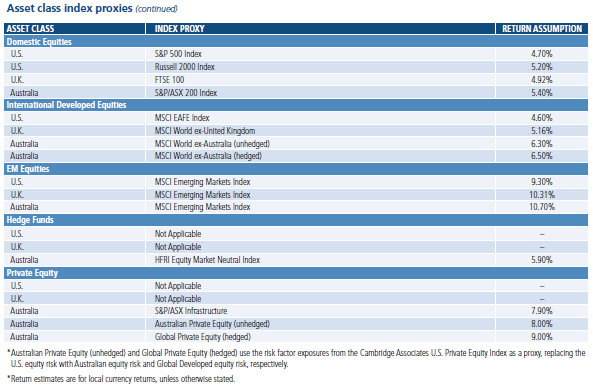
Return assumptions are derived from an internal process based on a combination of methods, pulling together historical data, valuation metrics and qualitative inputs based on PIMCO’s secular views. Return assumptions are for illustrative purposes only and are not a prediction or a projection of return. Return assumption is an estimate of what investments may earn on average over a ten year period. Actual returns may be higher or lower than those shown and may vary substantially over shorter time periods.
Value at Risk (VAR) estimates the risk of loss of an investment or portfolio over a given time period under normal market conditions in terms of a specific percentile threshold of loss (i.e., for a given threshold of X%, under the specific modeling assumptions used, the portfolio will incur a loss in excess of the VAR X percent of the time. Different VAR calculation methodologies may be used. VAR models can help understand what future return or loss profiles might be. However, the effectiveness of a VAR calculation is in fact constrained by its limited assumptions (for example, assumptions may involve, among other things, probability distributions, historical return modeling, factor selection, risk factor correlation, simulation methodologies). It is important that investors understand the nature of these limitations when relying upon VAR analyses.
Stress testing involves asset or portfolio modeling techniques that attempt to simulate possible performance outcomes using historical data and/or hypothetical performance modeling events. These methodologies can include among other things, use of historical data modeling, various factor or market change assumptions, different valuation models and subjective judgments.
Because of limitations of these modeling techniques, we make no representation that use of these models will actually reflect future results, or that any investment actually will achieve results similar to those shown. Hypothetical or simulated performance modeling techniques have inherent limitations. These techniques do not predict future actual performance and are limited by assumptions that future market events will behave similarly to historical time periods or theoretical models. Future events very often occur to causal relationships not anticipated by such models, and it should be expected that sharp differences will often occur between the results of these models and actual investment results.
Volatility We employed a block bootstrap methodology to calculate volatilities. We start by computing historical factor returns that underlie each asset class proxy from January 1997 through the present date. We then randomly draw a set of 12 monthly returns consisting of four three-month contiguous blocks, within the dataset to come up with an annual return number. This process is repeated 15,000 times to have a return series with 15,000 annualized returns. The standard deviation of these annual returns is used to model the volatility for each risk factor. We then use the same return series for each factor to compute covariance between factors. Finally, volatility of each asset class proxy is calculated as the sum of variances and covariance of factors that underlie each particular proxy. Refer to appendix for glide path allocations.
Past performance is not a guarantee or a reliable indicator of future results. Investing in the bond market is subject to certain risks including market, interest-rate, issuer, credit, and inflation risk. Investing in foreign denominated and/or domiciled securities may involve heightened risk due to currency fluctuations,and economic and political risks, which may be enhanced in emerging markets. Inflation-linked bonds (ILBs) issued by a government are fixed income securities whose principal value is periodically adjusted according to the rate of inflation; ILBs decline in value when real interest rates rise. Commodities contain heightened risk including market, political, regulatory, and natural conditions, and may not be suitable for all investors. Equities may decline in value due to both real and perceived general market, economic, and industry conditions. REITs are subject to risk, such as poor performance by the manager, adverse changes to tax laws or failure to qualify for tax-free pass-through of income. High-yield, lower-rated, securities involve greater risk than higher-rated securities; portfolios that invest in them may be subject to greater levels of credit and liquidity risk than portfolios that do not. Tail risk hedging may involve entering into financial derivatives that are expected to increase in value during the occurrence of tail events. Investing in a tail event instrument could lose all or a portion of its value even in a period of severe market stress. A tail event is unpredictable; therefore, investments in instruments tied to the occurrence of a tail event are speculative. Derivatives may involve certain costs and risks such as liquidity, interest rate, market, credit, management and the risk that a position could not be closed when most advantageous. Investing in derivatives could lose more than the amount invested. There is no guarantee that these investment strategies will work under all market conditions and each investor should evaluate their ability to invest for a long-term especially during periods of downturn in the market. No representation is being made that any account, product, or strategy will or is likely to achieve profits, losses, or results similar to those shown.
This material contains the opinions of the author but not necessarily those of PIMCO and such opinions are subject to change without notice. This material has been distributed for informational purposes only and should not be considered as investment advice or a recommendation of any particular security, strategy or investment product. Information contained herein has been obtained from sources believed to be reliable, but not guaranteed. No part of this material may be reproduced in any form, or referred to in any other publication, without express written permission. PIMCO and YOUR GLOBAL INVESTMENT AUTHORITY are trademarks or registered trademarks of Allianz Asset Management of America L.P. and Pacific Investment Management Company LLC, respectively, in the United States and throughout the world. © 2013, PIMCO.
© PIMCO
© PIMCO


