- New residential construction needs to double from 2012 levels to meet long-run stable demand, and the pace of that increase is critical.
- Consumer credit growth is hindered by strict lending standards, continued deleveraging and limits to mortgage equity withdrawal.
- As a result, the balance of mortgage debt is unlikely to meaningfully increase in the next 12-18 months, delaying a return of the virtuous consumer cycle.
In the wake of the financial crisis, the U.S. consumer has embarked on a necessary path of deleveraging. Now, more than five years into the deleveraging cycle, a recovery has begun, but will housing sector improvements lead to a broad, consumer-based economic recovery?
We believe that housing fundamentals remain strong, but that the impact on growth depends on the ability and willingness of consumers to gradually re-expand their balance sheets. The full benefits of the recovery will take years to realize, with only moderate upside over the coming 12-18 months.
Construction: positive fundamentals in the new home segment
New construction is the primary direct contribution from the housing market to economic growth. Even though residential fixed investment was only 2.4% of GDP in 2012 (down from its peak of 6.1% in 2005), it remains an important growth driver, both directly and indirectly: Homebuilders estimate that each additional new home they build creates three jobs, and new homebuyers also drive purchases of appliances, consumer goods and services.
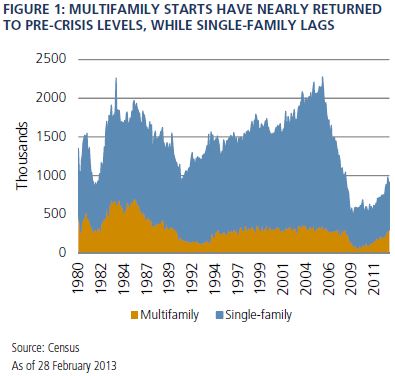
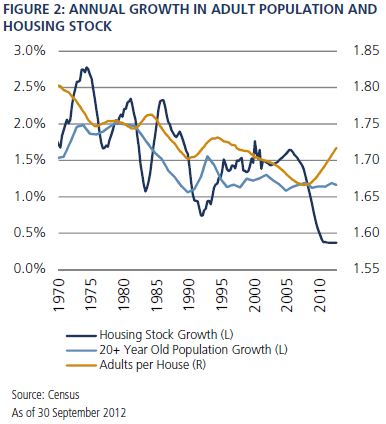
While home prices are leading the recovery, residential construction is still lagging. The 28% year-over-year increase in housing starts in 2012 may sound impressive, but the number of units started only increased from the record low of 609,000 to 780,000 (see Figure 1). To keep up with population and household growth, and the need to replace aging and damaged properties, 1.5 million residential units must be built annually, in our view, nearly twice the level in 2012 (see Figure 2). In other words, construction still needs to double from here.
When and how starts will reach this equilibrium is a crucial question. We believe they could increase to 1.1 million in 2013 and 1.5 million by 2015, in which case residential investment could contribute 0.5%-0.7% to GDP growth each year and create 1.5 million new jobs, helping to move the U.S. into a broad-based economic recovery.
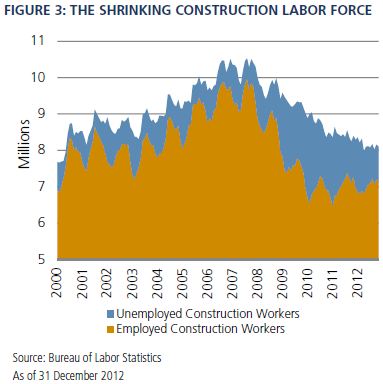
Survey data from homebuilders and the Conference Board indicate that demand for new homes is growing in line with the fundamentals, but even so, the construction industry faces capacity constraints: The crisis disrupted the process of entitlement and permitting of vacant land, while the construction labor pool shrank as unemployed workers left the labor force, re-trained into other industries or emigrated (see Figure 3). The construction labor force is now smaller than it has been at any time since 2000, and it is unclear whether large pools of skilled labor can be easily tapped to build 1.5 million units.

The pace of new construction depends on a balance between the growth of consumer demand for new homes and the industry’s ability to ramp up construction rapidly.
Credit availability and wealth effects: headwinds for the mortgage market
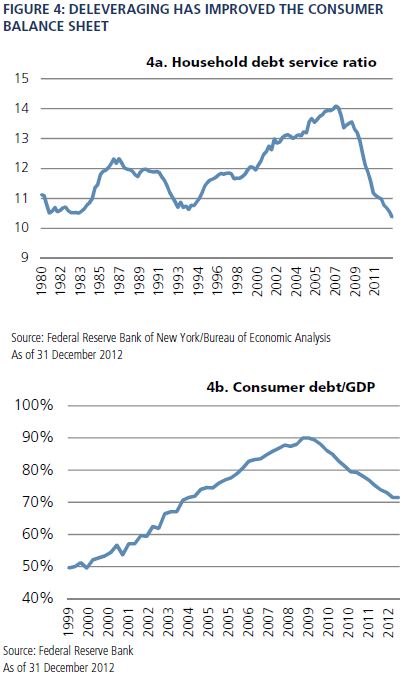
With the household debt service ratio at a 30-year low (see Figure 4a) and consumer debt down to 71% of GDP (see Figure 4b), the consumer’s balance sheet has markedly improved. Combined with rising house prices, the pieces are in place for a slowdown in deleveraging and perhaps even a return of the virtuous consumer cycle. However, we see challenges in the transmission mechanism.
Housing-related growth and wealth effects essentially derive from three key factors: (a) improvements in bank balance sheets resulting in an increased willingness to lend, (b) increased consumer confidence leading to a lower savings rate and © increased consumer spending due to mortgage equity withdrawals and gains from actual sales. These factors face headwinds that will hinder improving house prices from flowing through the broader economy.
Amid the prevailing low interest rates, bank earnings reflect compressing net interest margins (NIMs), and mortgage debt is a leading candidate for balance sheet growth. However, new regulation will keep lending limited to high-quality borrowers until there is more clarity and consistency regarding the interpretation of new lending standards and associated legal protections. Once the Home Affordable Refinance Program (HARP) and similar programs run their course, or rates begin to rise, banks may look to expand credit standards to remain profitable in a less benign mortgage banking environment. Paradoxically, higher rates could lead to more lending.
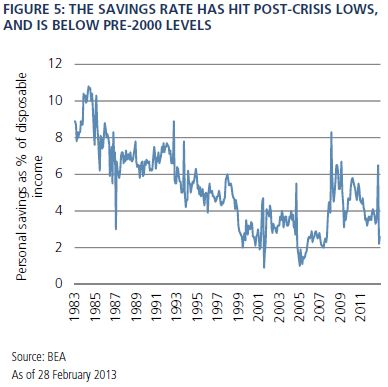
For consumers, the simplest method to spend more is to save less. But the starting point is already low: Savings rates for January and February 2013 were 2.2% and 2.6%, respectively, the lowest since 2007 (see Figure 5). Patchwork government austerity will hurt spending, especially for the already stretched lower- and middle-income consumers. Thus, any tangible impact from reduced savings will likely come from earners in the top 40%, who are also more likely to be homeowners and hold over 70% of consumer credit. To what extent can home price gains influence them to save less and spend more?
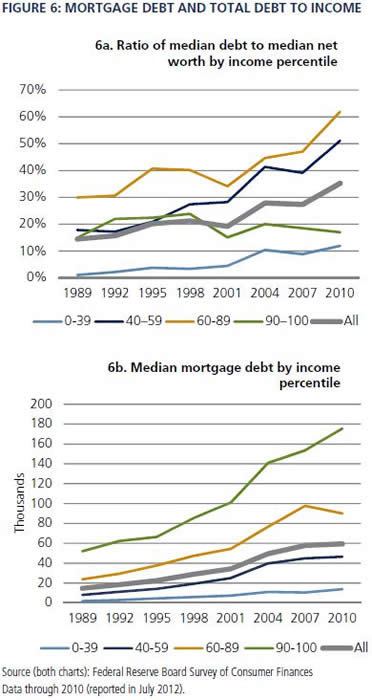
While net worth has suffered for most households, the top 10% have continued to enjoy real increases to net worth, in part because top-tier properties saw smaller price declines. The wealthy need to decide between increasing leverage at compelling low rates versus paying down existing liabilities with cash (see Figure 6a). With current leverage below 30%, there is little reason to expect a behavioral change as housing appreciates: As an investment, housing will compete against other, more liquid asset classes.
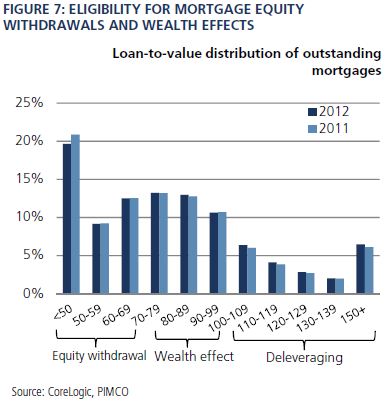
Meanwhile, consumers in the 60th-89th percentile reduced their mortgage debt the most (see Figure 6b), but largely through default. We believe that home price increases mainly spur spending by borrowers who already have substantial positive equity. Home price gains in 2012 increased the proportion of such borrowers only slightly (see Figure 7). The most substantial gains occurred in bubble areas like Phoenix and Las Vegas and merely reduced negative equity, rather than creating positive equity. Borrowers whose homes appreciate, but remain “underwater,” do not feel wealthier, and cannot monetize the appreciation. That said, borrowers in the 60th-89th income percentile with positive equity are more likely than their high-income counterparts to use available mortgage credit.
We believe that significant wealth effects from housing are likely to materialize further into the recovery cycle, once more of the negative equity has been erased and credit expansion becomes mainstream.
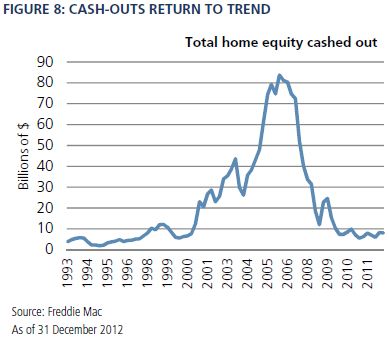
Our expectations for equity extractions are also muted. The large amount of mortgage credit extraction during the bubble was a sharp divergence historically (see Figure 8). We expect headwinds against further equity withdrawals from both the demand and supply sides. Home price growth in bubble areas creates relatively few new consumers eligible for equity withdrawals (see Figure 7), and many of those who are eligible may initially choose to be more prudent. Meanwhile, cash-out refinance loans will continue to be more heavily scrutinized than purchase mortgages. If mortgage debt increases faster than we expect, it will likely be because borrowers with existing equity were more willing and able to monetize it.
We believe spending growth from mortgage equity withdrawals will remain muted, and is unlikely to return to the levels of 2005-2007 anytime soon. In fact, the natural paydown of mortgages alone substantially exceeds equity extraction. In 2012, mortgage amortization was $175 billion and write-downs due to defaults and foreclosures were $34 billion in the fourth quarter, compared with approximately $65 billion for mortgage equity withdrawals.
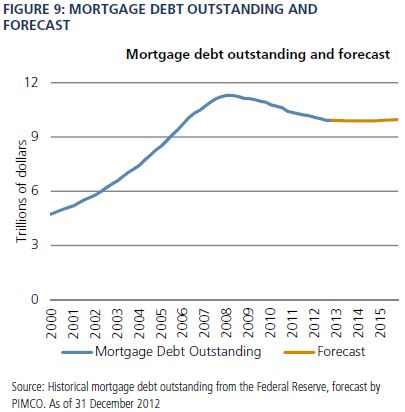
All these factors feed into PIMCO’s mortgage balance forecast, which is based on the key components of amortization, write-downs, new and existing home sales, and mortgage equity withdrawal.
We project that mortgage debt outstanding will decline from its current $9.92 trillion level, bottoming $30 billion lower in mid-2014, then gradually increase again throughout 2015 (see Figure 9). This moderate increase may sound lackluster, but it’s an important milestone after a four-year downward trend.
Investment implications: build now, lend later
While we remain optimistic about the housing recovery and its effects on the construction industry and GDP, market participants may have to wait longer than they’re expecting for the recovery’s effects to reach consumers. The transmission mechanism between home prices and spending depends on lending growth, which is likely to stay low for some time. As a result, in the new period of reduced government spending, the consumer’s ability to take the baton is delayed. We expect that wealthier consumer segments will lead into the next releveraging cycle.
The best opportunities are likely those that help push the housing recovery along each of its upcoming stages, and a construction recovery will likely precede a lending recovery. Careful asset selection and willingness to patiently participate in less-liquid or operationally intensive businesses will be rewarded.
Past performance is not a guarantee or a reliable indicator of future results. All investments contain risk and may lose value. The value of real estate and portfolios that invest in real estate may fluctuate due to: losses from casualty or condemnation, changes in local and general economic conditions, supply and demand, interest rates, property tax rates, regulatory limitations on rents, zoning laws, and operating expenses.
Statements concerning housing market trends are based on current market conditions, which will fluctuate. Outlook is subject to change without notice. Forecasts, estimates, and certain information contained herein are based upon proprietary research and should not be interpreted as investment advice, as an offer or solicitation, nor as the purchase or sale of any financial instrument.
This material contains the opinions of the author but not necessarily those of PIMCO and such opinions are subject to change without notice. This material has been distributed for informational purposes only and should not be considered as investment advice or a recommendation of any particular security, strategy or investment product. Information contained herein has been obtained from sources believed to be reliable, but not guaranteed. No part of this material may be reproduced in any form, or referred to in any other publication, without express written permission. PIMCO and YOUR GLOBAL INVESTMENT AUTHORITY are trademarks or registered trademarks of Allianz Asset Management of America L.P. and Pacific Investment Management Company LLC, respectively, in the United States and throughout the world. © 2013, PIMCO.
© PIMCO
www.pimco.com
© PIMCO
Read more commentaries by PIMCO