- The methods for monitoring investment managers are well established. But given the importance of getting portfolio allocation right in a low-growth, low-return world, it’s worth examining new ways to assess risk and value added.
- While tracking error has been held as a key measure for active risk, it may include elements that reflect market conditions rather than managers’ actual decisions on risk.
- We believe active share – simply defined as the percentage of a portfolio that is different than the benchmark – is perhaps the best additional objective measure of active risk.
The art of pension plan management consists of skillful plan design, asset allocation, investment selection, implementation and risk management. Most plans use multiple investment managers to attain a proper degree of diversification, and selecting those managers takes a lot of time and typically requires expert, external advice.
The process does not end with selection, however: Managers must be monitored on performance, risk, process and style in order to confirm that they are performing their role in the overall portfolio construction.
The methods employed to carry out that monitoring are well established. But given the importance of getting portfolio allocation right in a low-growth, low-return world, it’s worth examining whether there are new ways of thinking about and assessing whether and how a manager adds value beyond a passive benchmark.
Tracking error
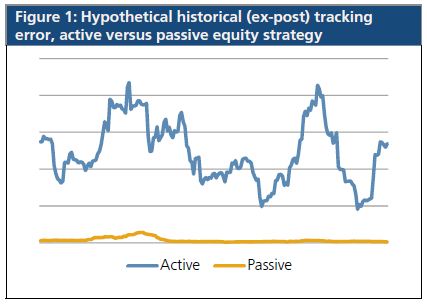
Traditionally, pension plan managers and consultants have used tracking error (TE) to monitor the active risk their appointed asset managers take. Tracking error is the standard deviation of periodic excess returns above or below a benchmark index, usually measured either daily or monthly (see Figure 1). The theory is that if a given manager usually posts a tracking error within a certain range – say 300 to 500 basis points – a deviation above or below this range may be a sign of change in the manager’s risk posture and potentially even its portfolio management style. (To be sure, there are a number of ways to measure how a manager stacks up to a benchmark, including the portfolio’s risk factor exposures. The analysis in this article focuses on historical tracking error as well as a complementary measure.)
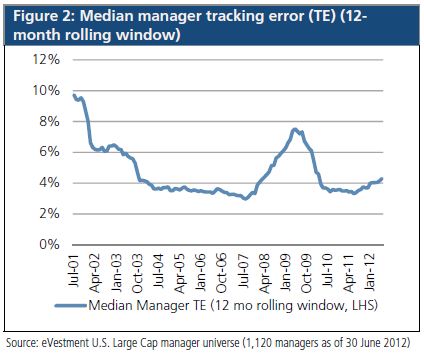
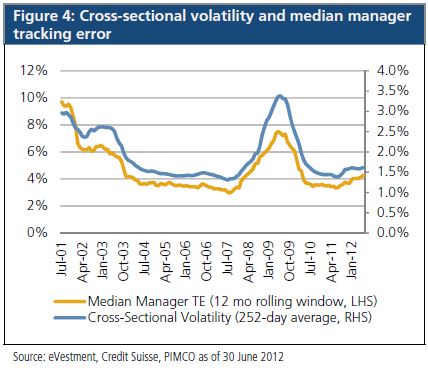
While it is true that some investment managers explicitly manage to a tracking error, more commonly managers think about active positions in terms of market value deviations from their benchmark, or sometimes even disregard the benchmark entirely in their portfolio construction, a so-called benchmark-agnostic style of management. One could argue that if managers actually managed to a target tracking error consistently, a median estimate of the historical tracking error of all equity managers should be relatively stable over time. Using data from the eVestment manager database, we did just such a calculation in Figure 2.
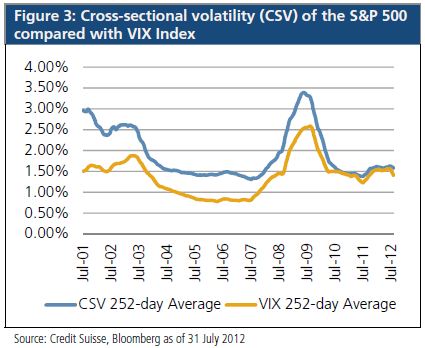
The missing piece in this calculation is a measure called cross-sectional volatility. Simply put, cross-sectional volatility measures the dispersion of stock returns in a given period. It is typically calculated as the standard deviation of returns for all stocks in the relevant investment universe during one day or month. If cross-sectional volatility were zero, and the market index were up 5%, this would indicate that every stock moved in parallel the same 5%. As a corollary, in a zero cross-sectional volatility environment, stock picking would add no value because all stocks would have the same performance.
Cross-sectional volatility is highly correlated with overall market volatility. If we use VIX, the index commonly followed in the market for S&P 500 Index stock options, as the proxy for a forward-looking estimate of volatility, we can see that cross-sectional volatility of the S&P 500 and overall market volatility are coincident indicators of risk (see Figure 3).
Cutting out the market noise: active share
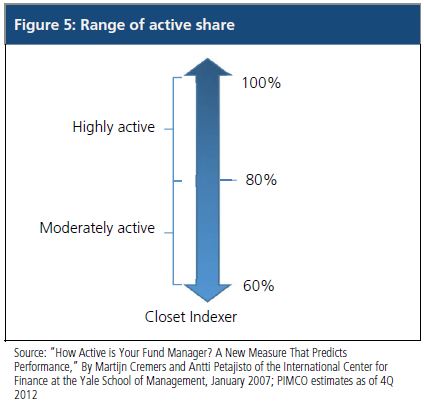
In 2006, Yale researchers Antti Petajisto and Martijn Cremers published an article on a new measure of active management called active share. Active share is based on the actual market value deviations from a manager’s benchmark and therefore is independent of the prevailing market volatility as measured by the benchmark index. Focusing on portfolio holdings and weightings rather than returns, active share can simply be defined as the percentage of a portfolio that is different than the benchmark. Active share measures range from 0% (entirely passive, with positions identical to the benchmark index) to 100% (highly active, with positions entirely different from the benchmark index).
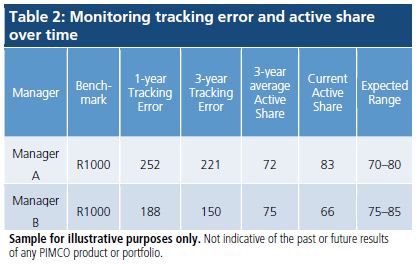
While the original paper discussed the use of active share for identifying managers that had the potential to outperform, active share can be used for monitoring the existing manager roster as well. In conjunction with tracking error, active share can help provide a more accurate picture on whether managers are conforming to their style and taking enough active risk to warrant keeping them as part of the overall portfolio construction.
Again, managing a portfolio of managers and investment strategies means understanding risk and the potential for return generation as well as unintended biases. While tracking error has been held as a key measure for active risk, it may include elements that reflect market conditions rather than managers’ actual decisions on risk. We believe active share, as perhaps the best additional objective measure of active risk, should be a critical part of this equity toolkit.
Past performance is not a guarantee or a reliable indicator of future results. All investments contain risk and may lose value. Equities may decline in value due to both real and perceived general market, economic and industry conditions. Investing in securities of smaller companies tends to be more volatile and less liquid than investing in securities of larger companies. Diversification does not ensure against loss.
Statements concerning financial market trends are based on current market conditions, which will fluctuate. There is no guarantee that these investment strategies will work under all market conditions or are suitable for all investors and each investor should evaluate their ability to invest long-term, especially during periods of downturn in the market. The correlation of various indices or securities against one another or against inflation is based upon data over a certain time period. These correlations may vary substantially in the future or over different time periods that can result in greater volatility.
The S&P 500 Index is an unmanaged market index generally considered representative of the stock market as a whole. The index focuses on the Large-Cap segment of the U.S. equities market. The CBOE Volatility Index® (VIX®) is a key measure of market expectations of near-term volatility conveyed by S&P 500 stock index option prices. It is not possible to invest directly in an unmanaged index.
This material contains the opinions of the authors but not necessarily those of PIMCO and such opinions are subject to change without notice. This material has been distributed for informational purposes only and should not be considered as investment advice or a recommendation of any particular security, strategy or investment product. Information contained herein has been obtained from sources believed to be reliable, but not guaranteed. No part of this material may be reproduced in any form, or referred to in any other publication, without express written permission. PIMCO and YOUR GLOBAL INVESTMENT AUTHORITY are trademarks or registered trademarks of Allianz Asset Management of America L.P. and Pacific Investment Management Company LLC, respectively, in the United States and throughout the world. © 2013, PIMCO.
© PIMCO


