Last week’s data reaffirmed that inflation pressures remain the defining narrative across the economic landscape.
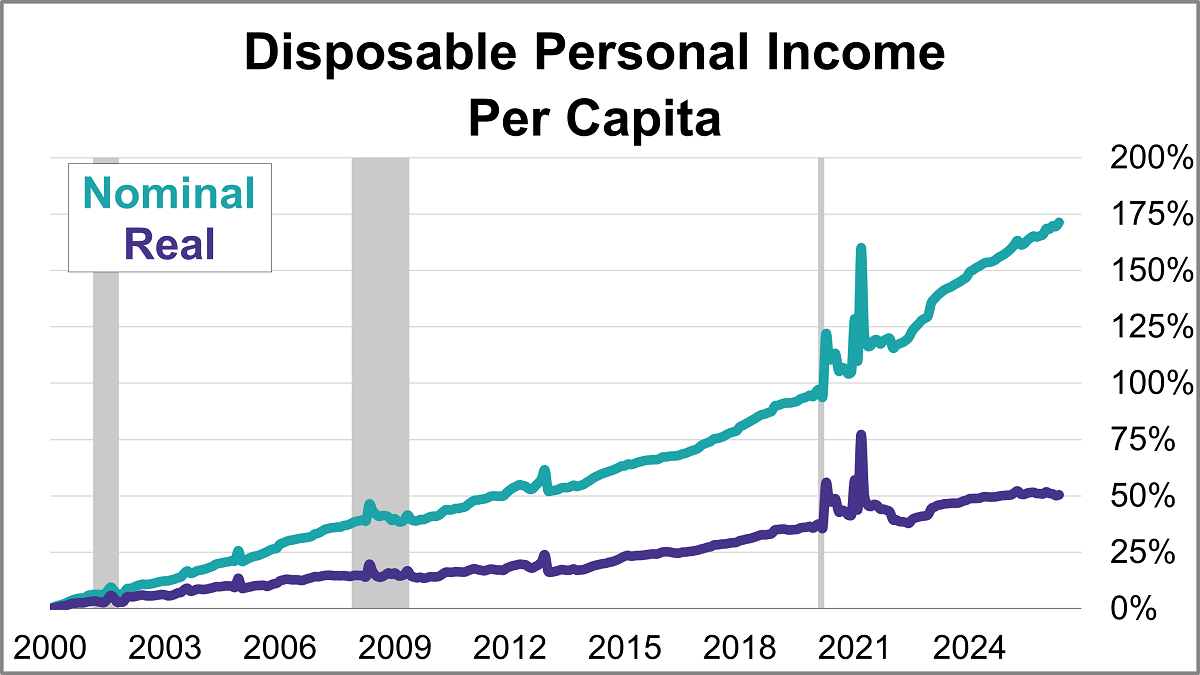
With the release of May's report on personal incomes and outlays, we can now take a closer look at "real" disposable personal income per capita. To two decimal places, disposable income per capita was up up 0.68% month-over-month. But when adjusted for inflation, real disposable income per capita was up 0.23%.
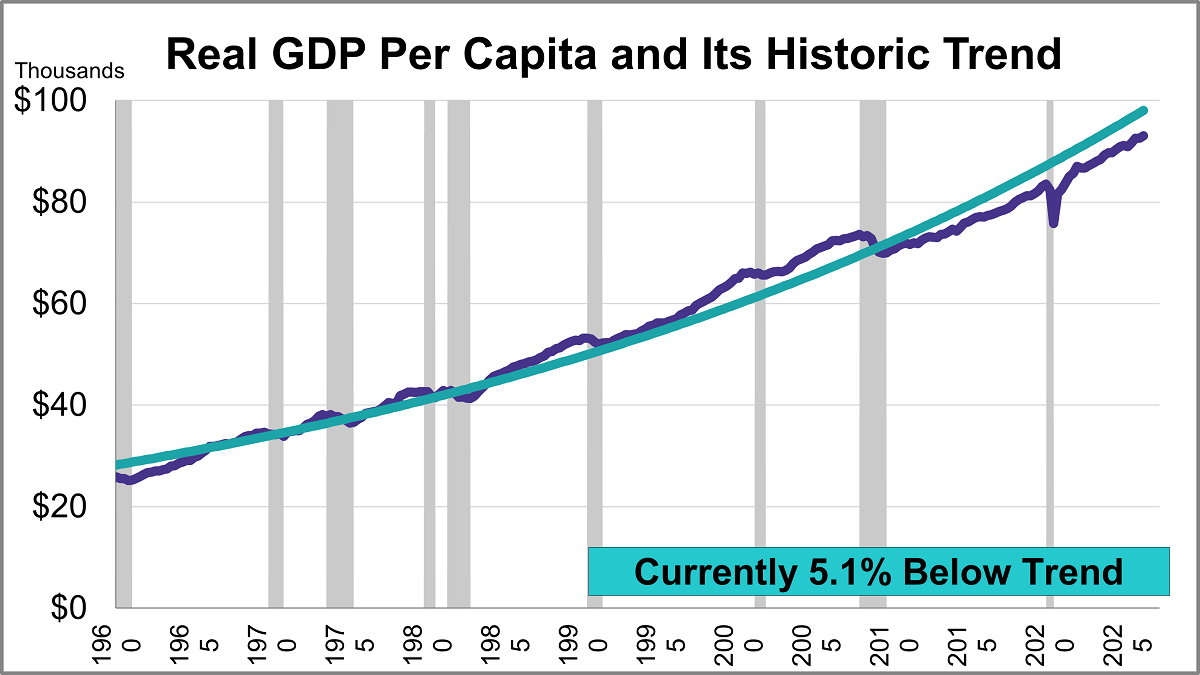
The third estimate for Q1 GDP came in at 2.09%, an acceleration from 0.48% for the Q4 final estimate. With a per-capita adjustment, the headline number is lower at 1.91%, a pickup from 0.18% for the Q4 headline number.
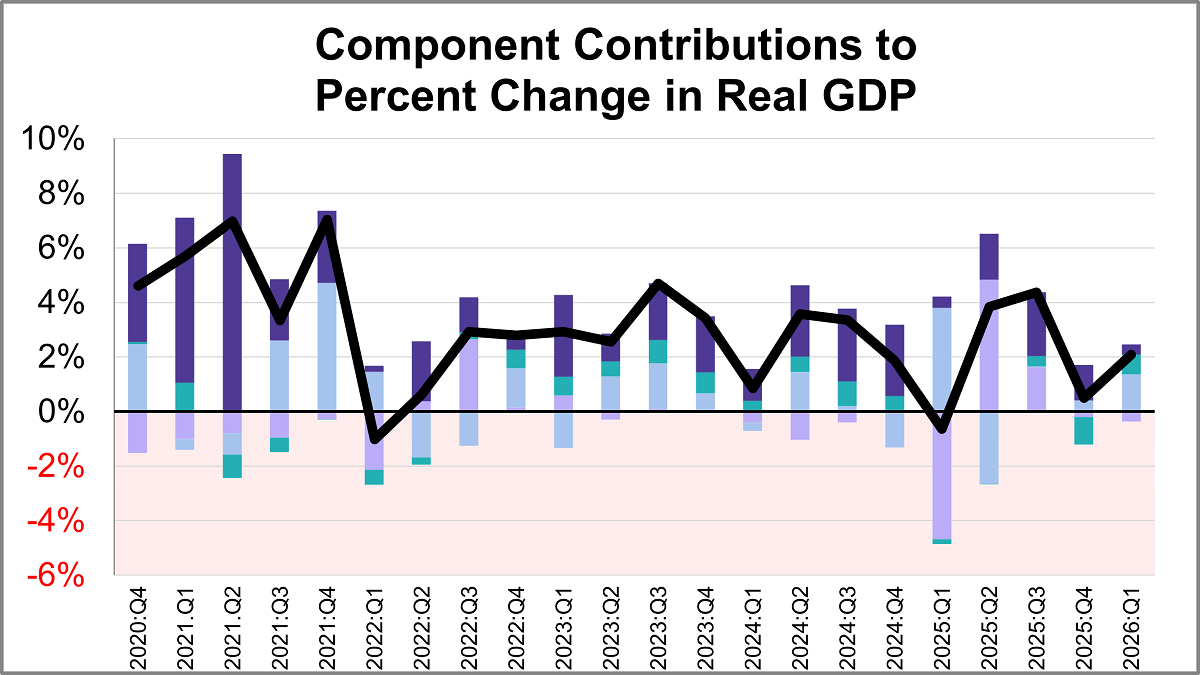
Real gross domestic product (GDP) is comprised of four major subcomponents. In the Q1 2026 GDP third estimate, three of the four components made positive contributions.
As the summer economic landscape takes shape, investors are navigating shifting monetary policy, stubborn inflation pressures, and unexpected market momentum. This week’s snapshot breaks down the most critical updates and data releases from the past week to give you a clear view of where the economy is heading.
In an effort to streamline retirement income planning, MassMutual Strategic Distributors has launched a behavioral framework.
A massive advisor retirement wave is reshaping wealth management. Discover how $2.5 trillion in assets may fuel industry transformation.
The U.S. economy faced intensifying headwinds in May as both consumer and wholesale inflation metrics surged to multi-year highs.
With the latest CPI report showing that inflation is likely here to stay, it could be time to pivot towards ETFs with downside protection.
Several articles enjoyed strong performance during the month of May, though there does not seem to have been a unifying theme, unless it is pointing out mistaken beliefs or unexamined conventions.
The U.S. labor market took center stage last week as three major labor market indicators outperformed forecasts. Robust payroll additions in both the public and private sectors, paired with a massive surge in job openings, point to a workforce on solid footing.
Ride the momentum wave. Discover how tech-fueled factors propelled momentum and high-beta ETFs to historic, benchmark-crushing gains.
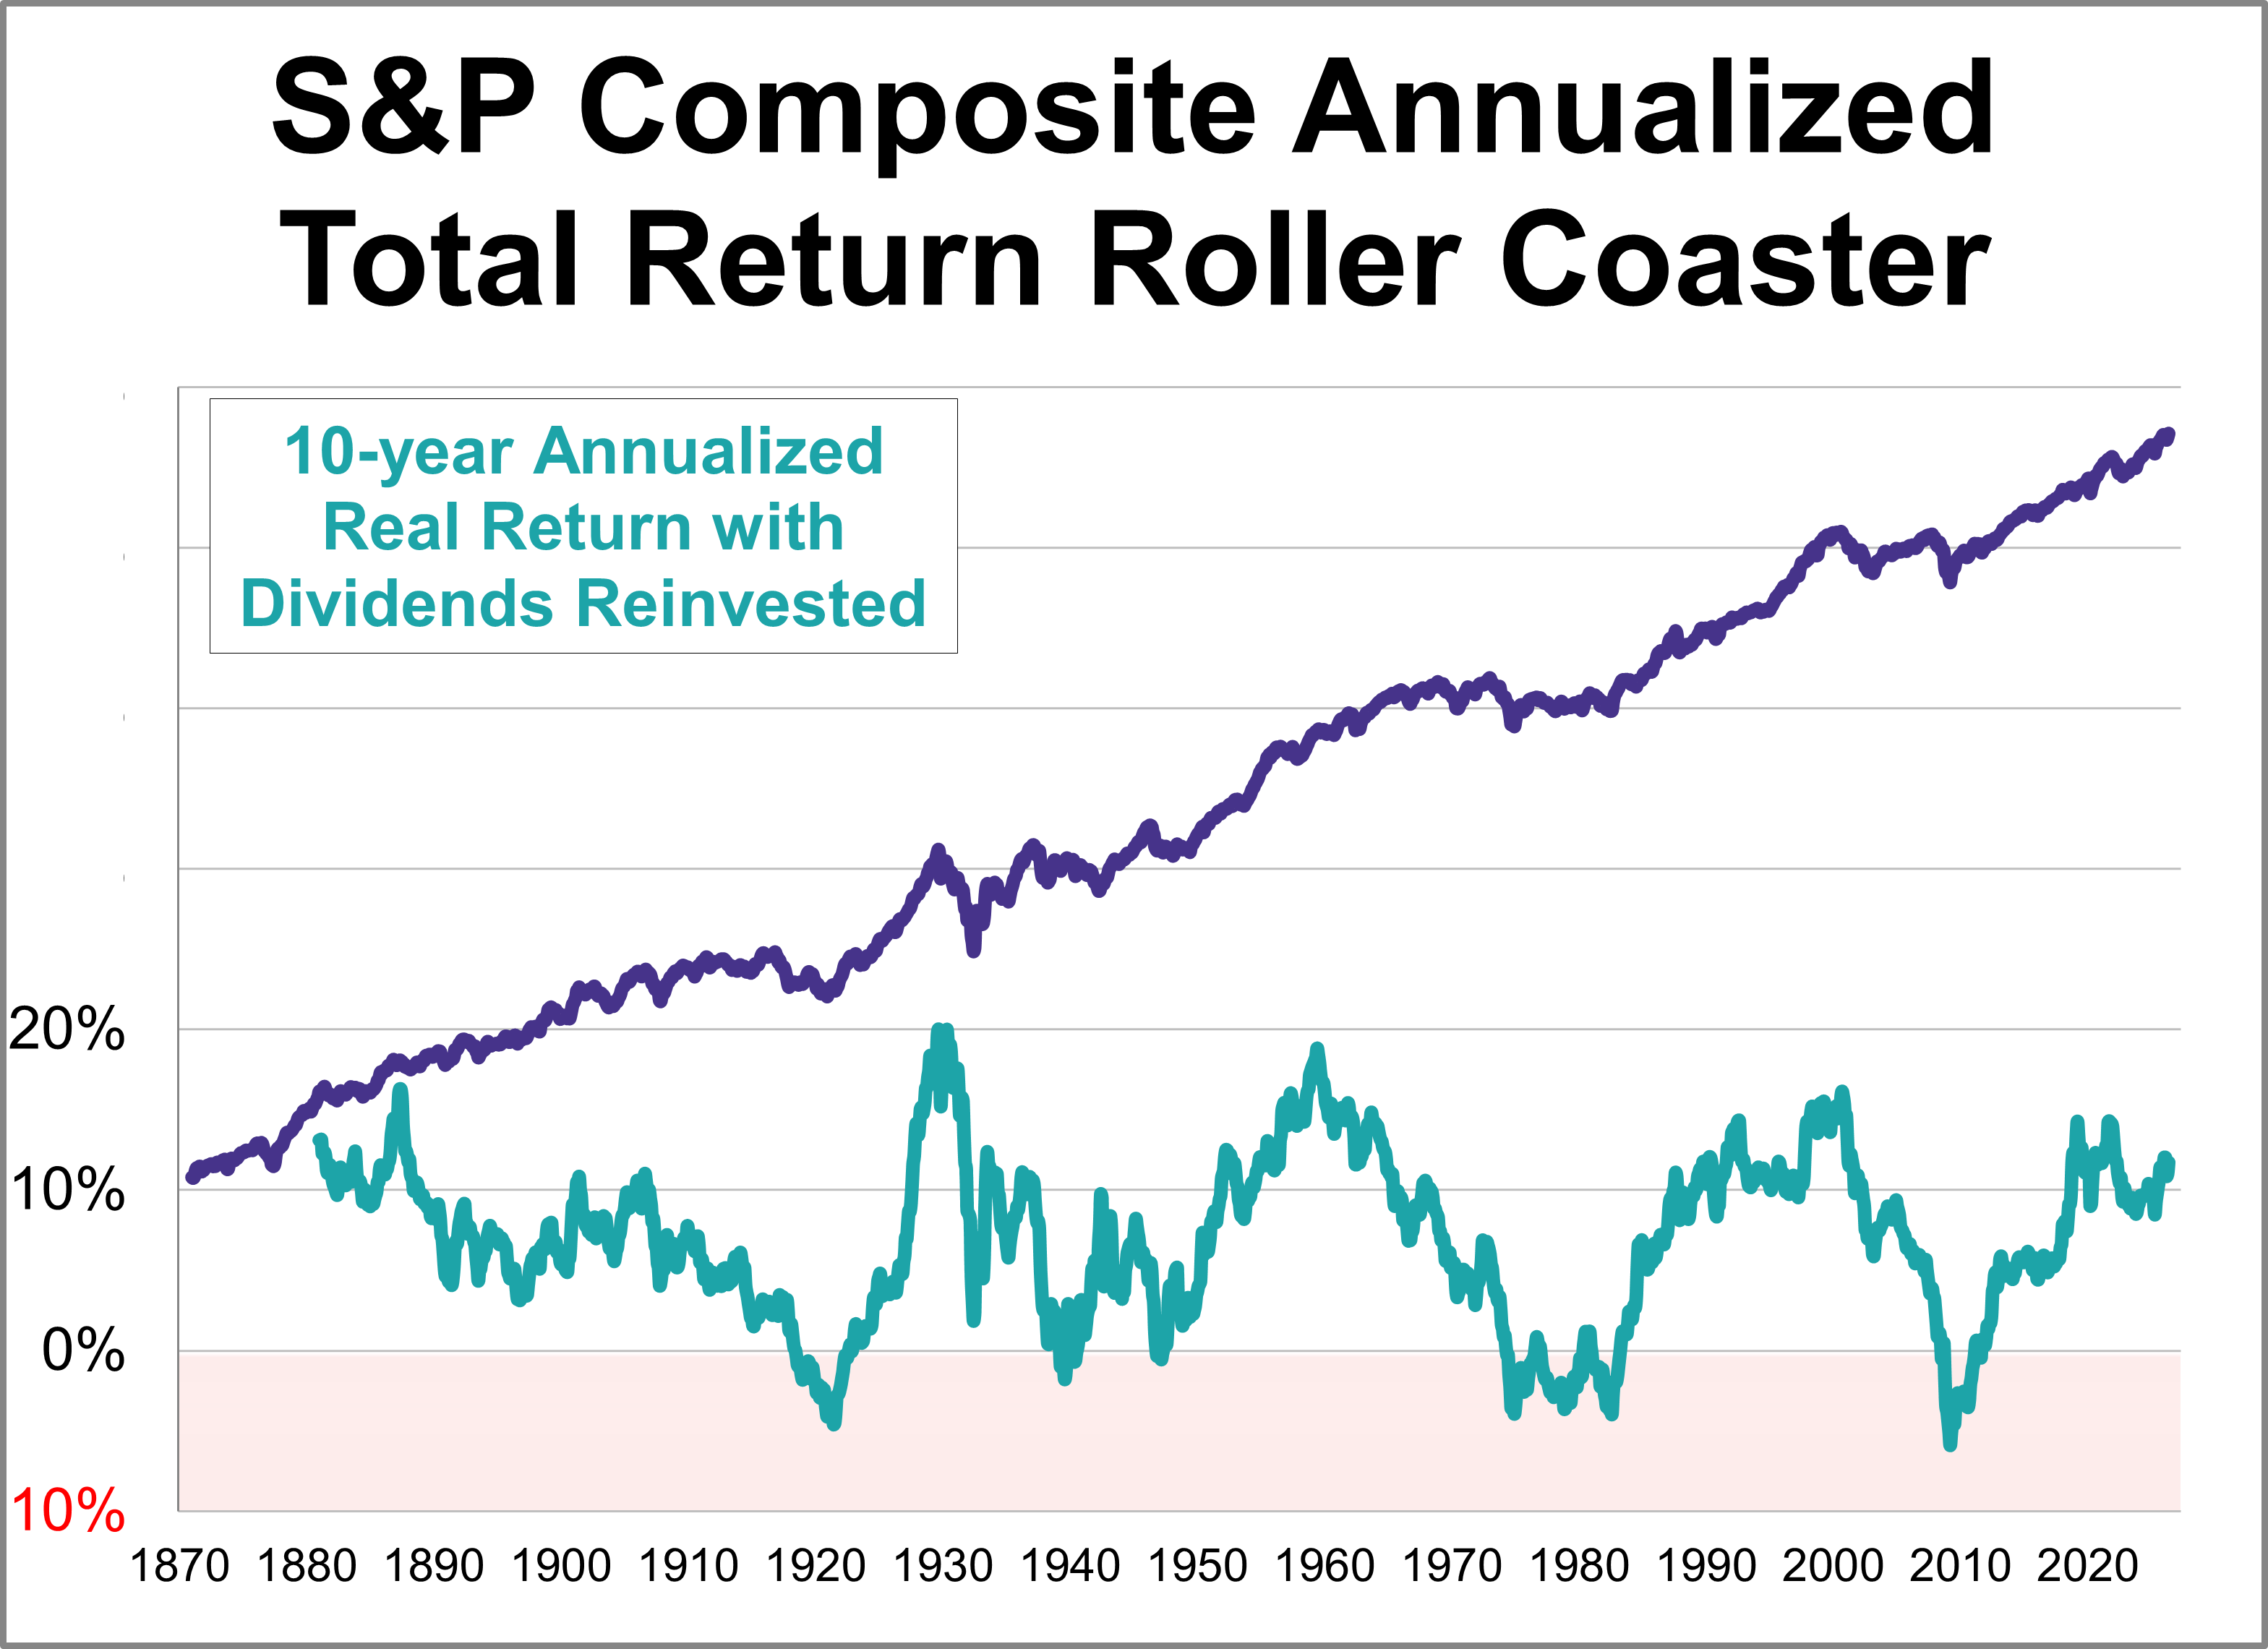
Here's an interesting set of charts that will especially resonate with those of us who follow economic and market cycles. Imagine that five years ago you invested $10,000 in the S&P 500. How much would it be worth today, with dividends reinvested but adjusted for inflation?
Closed-end funds may not be a hot topic right now, but they offer a highly compelling means to solve today's macroeconomic woes.
Last week’s data tracked a shifting economic trajectory over the last several months. While the latest reading on first-quarter GDP confirms the economy started the year with steady growth, subsequent inflation metrics moved higher and ultimately weighed on consumer confidence.
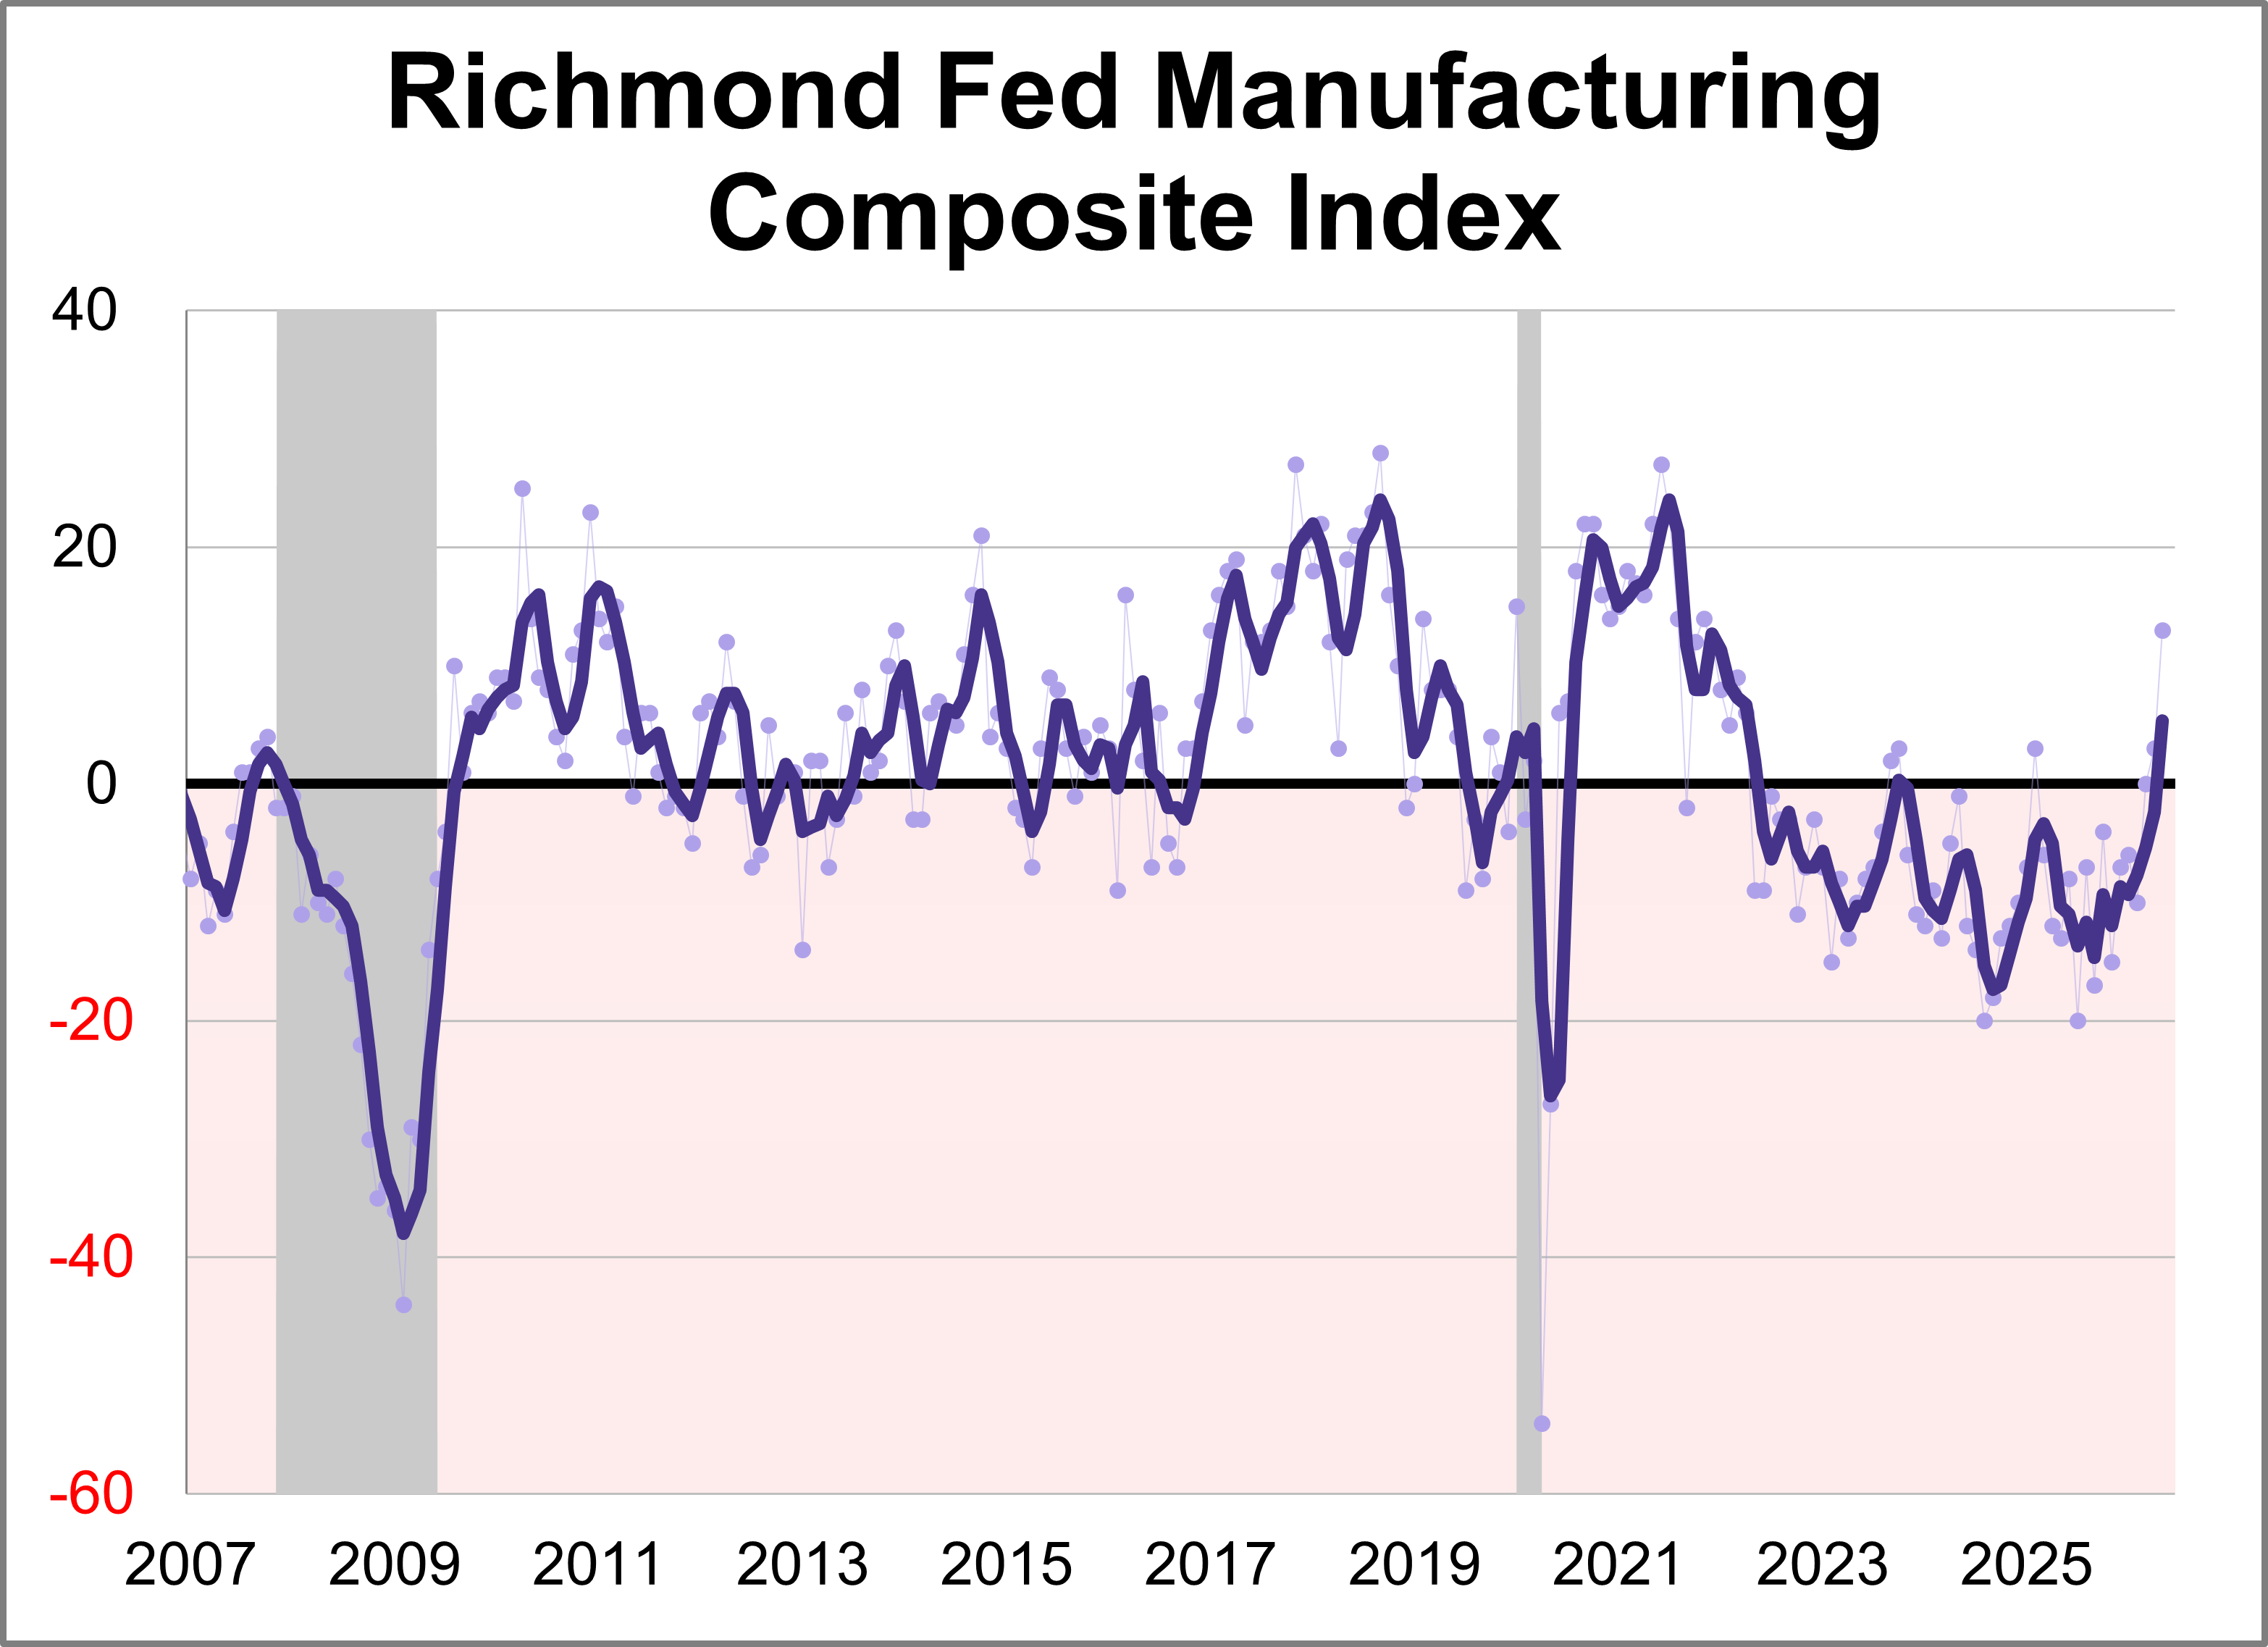
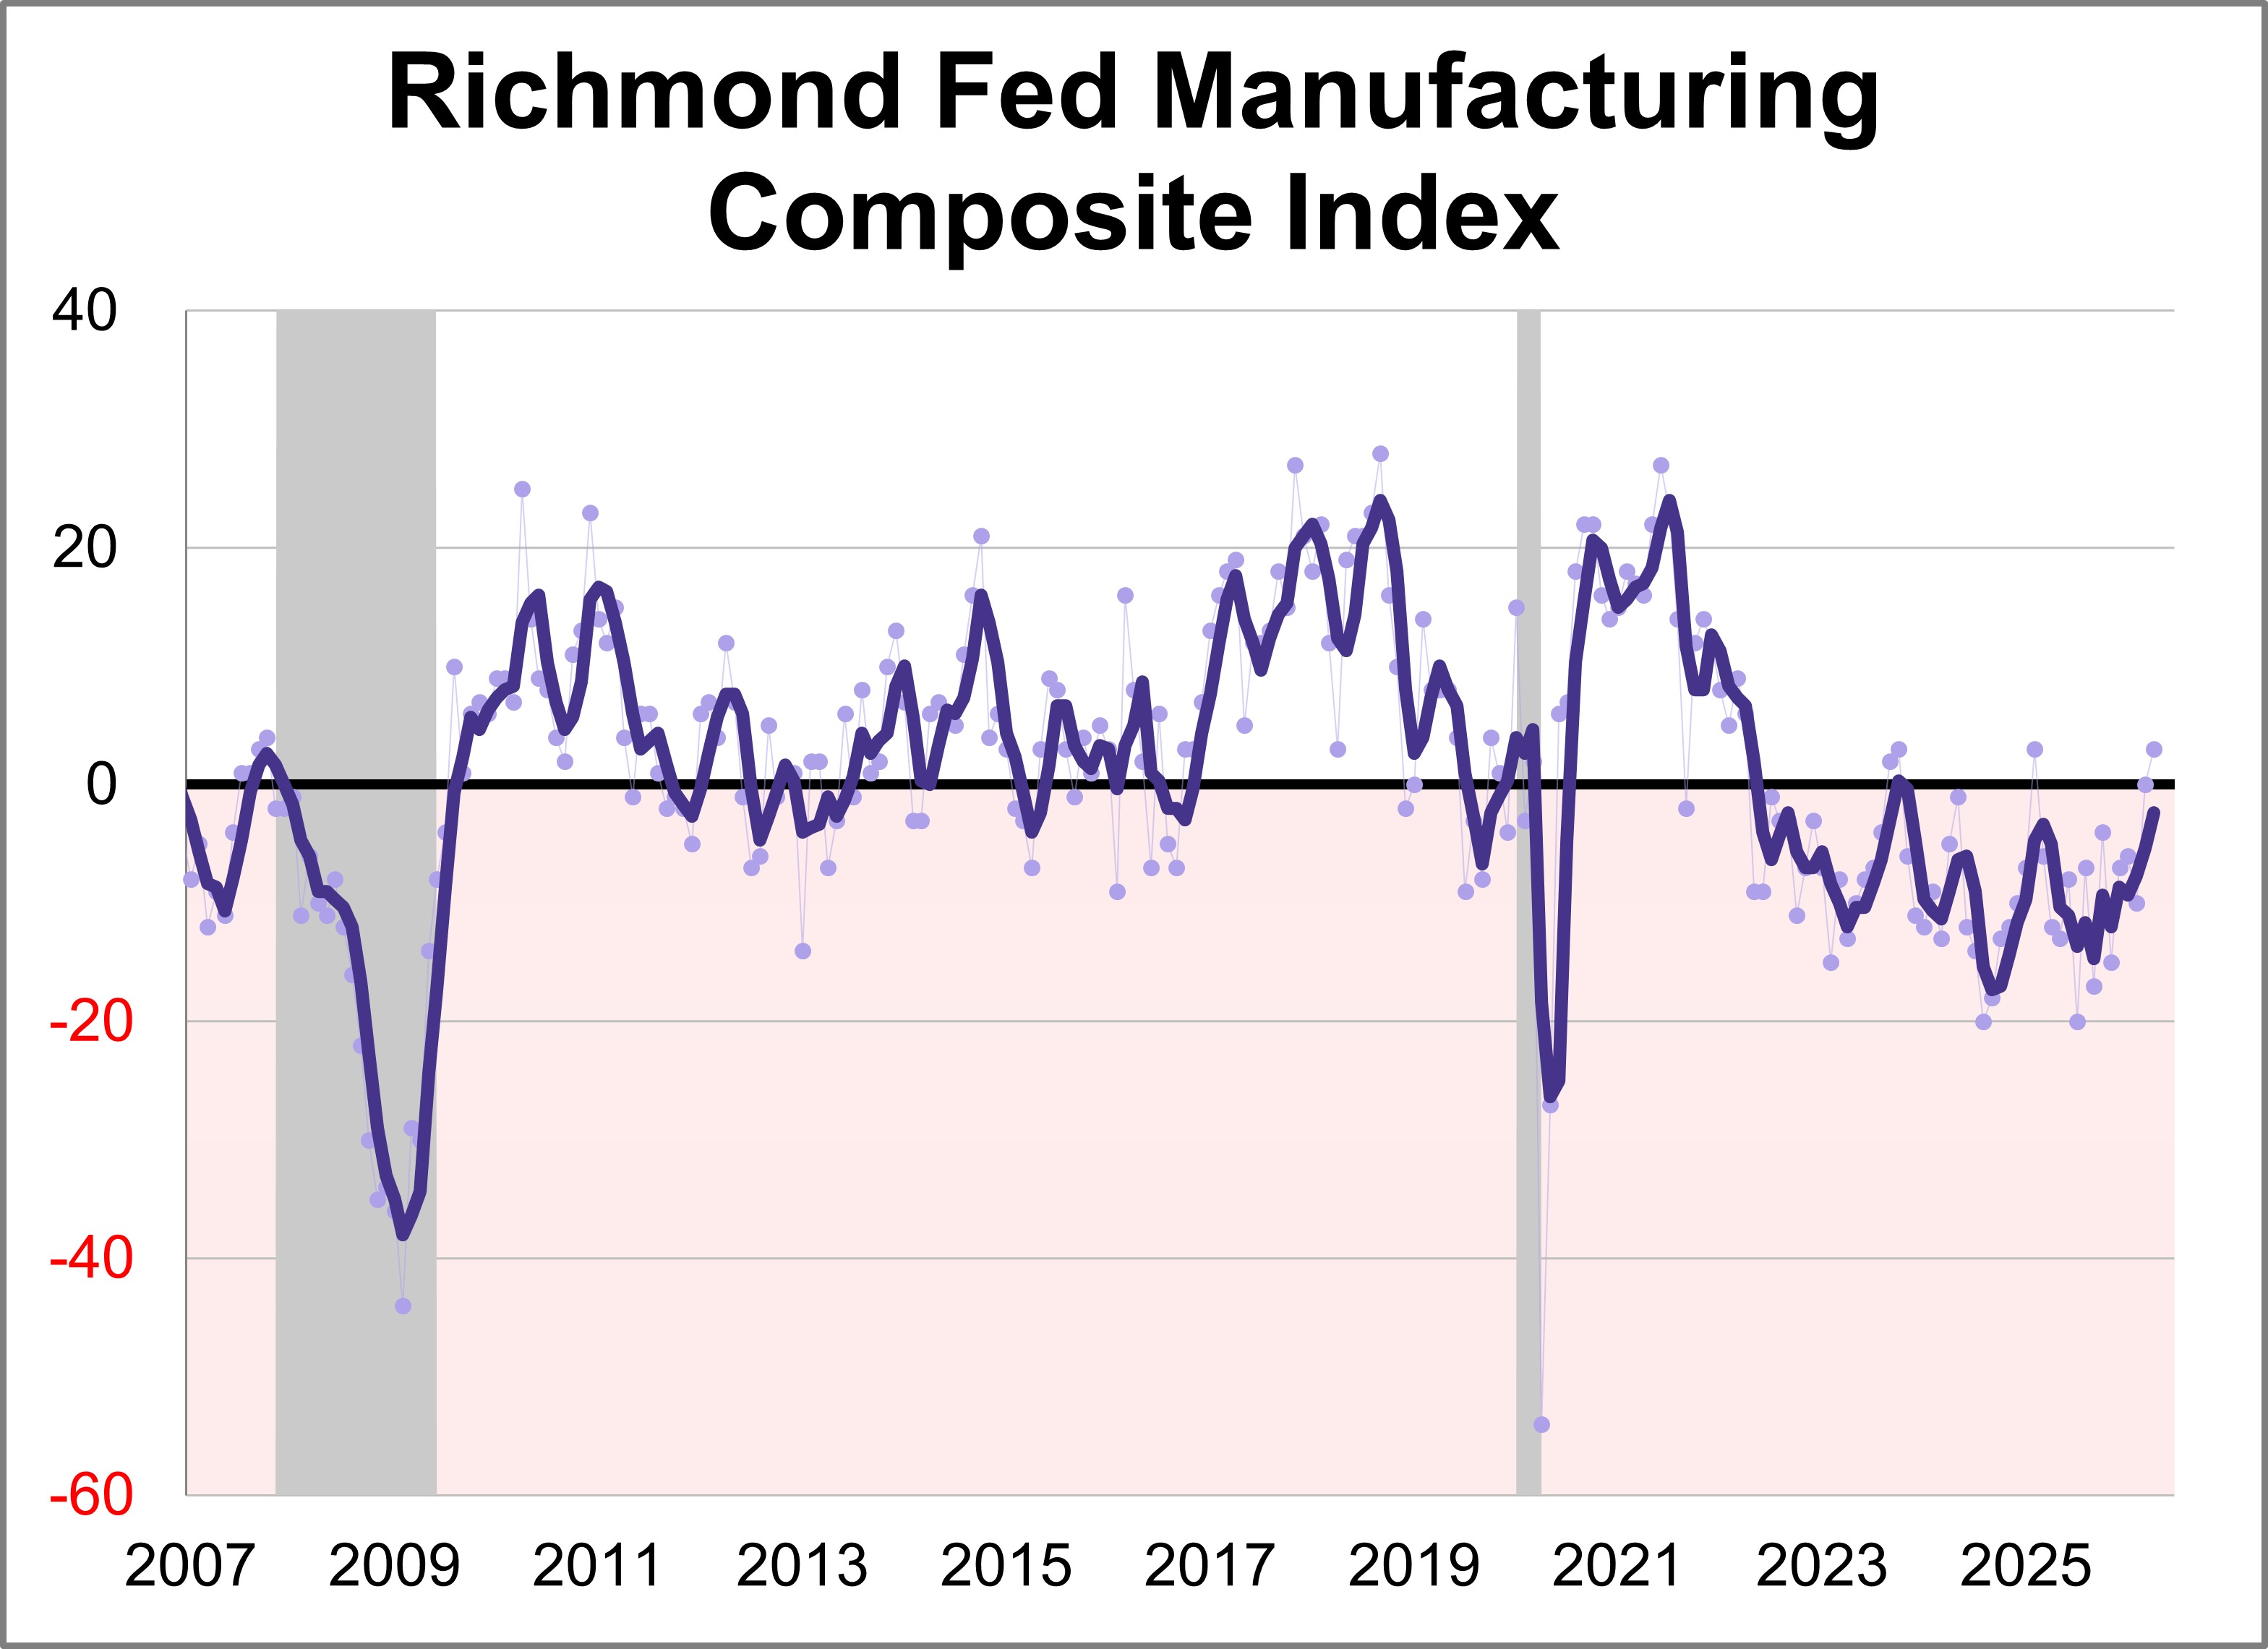
Fifth district manufacturing activity increased in May according to the most recent survey from the Federal Reserve Bank of Richmond. The composite manufacturing index rose ten points points to 13, marking the highest level in nearly five years. This month's reading was above the forecast of 4.
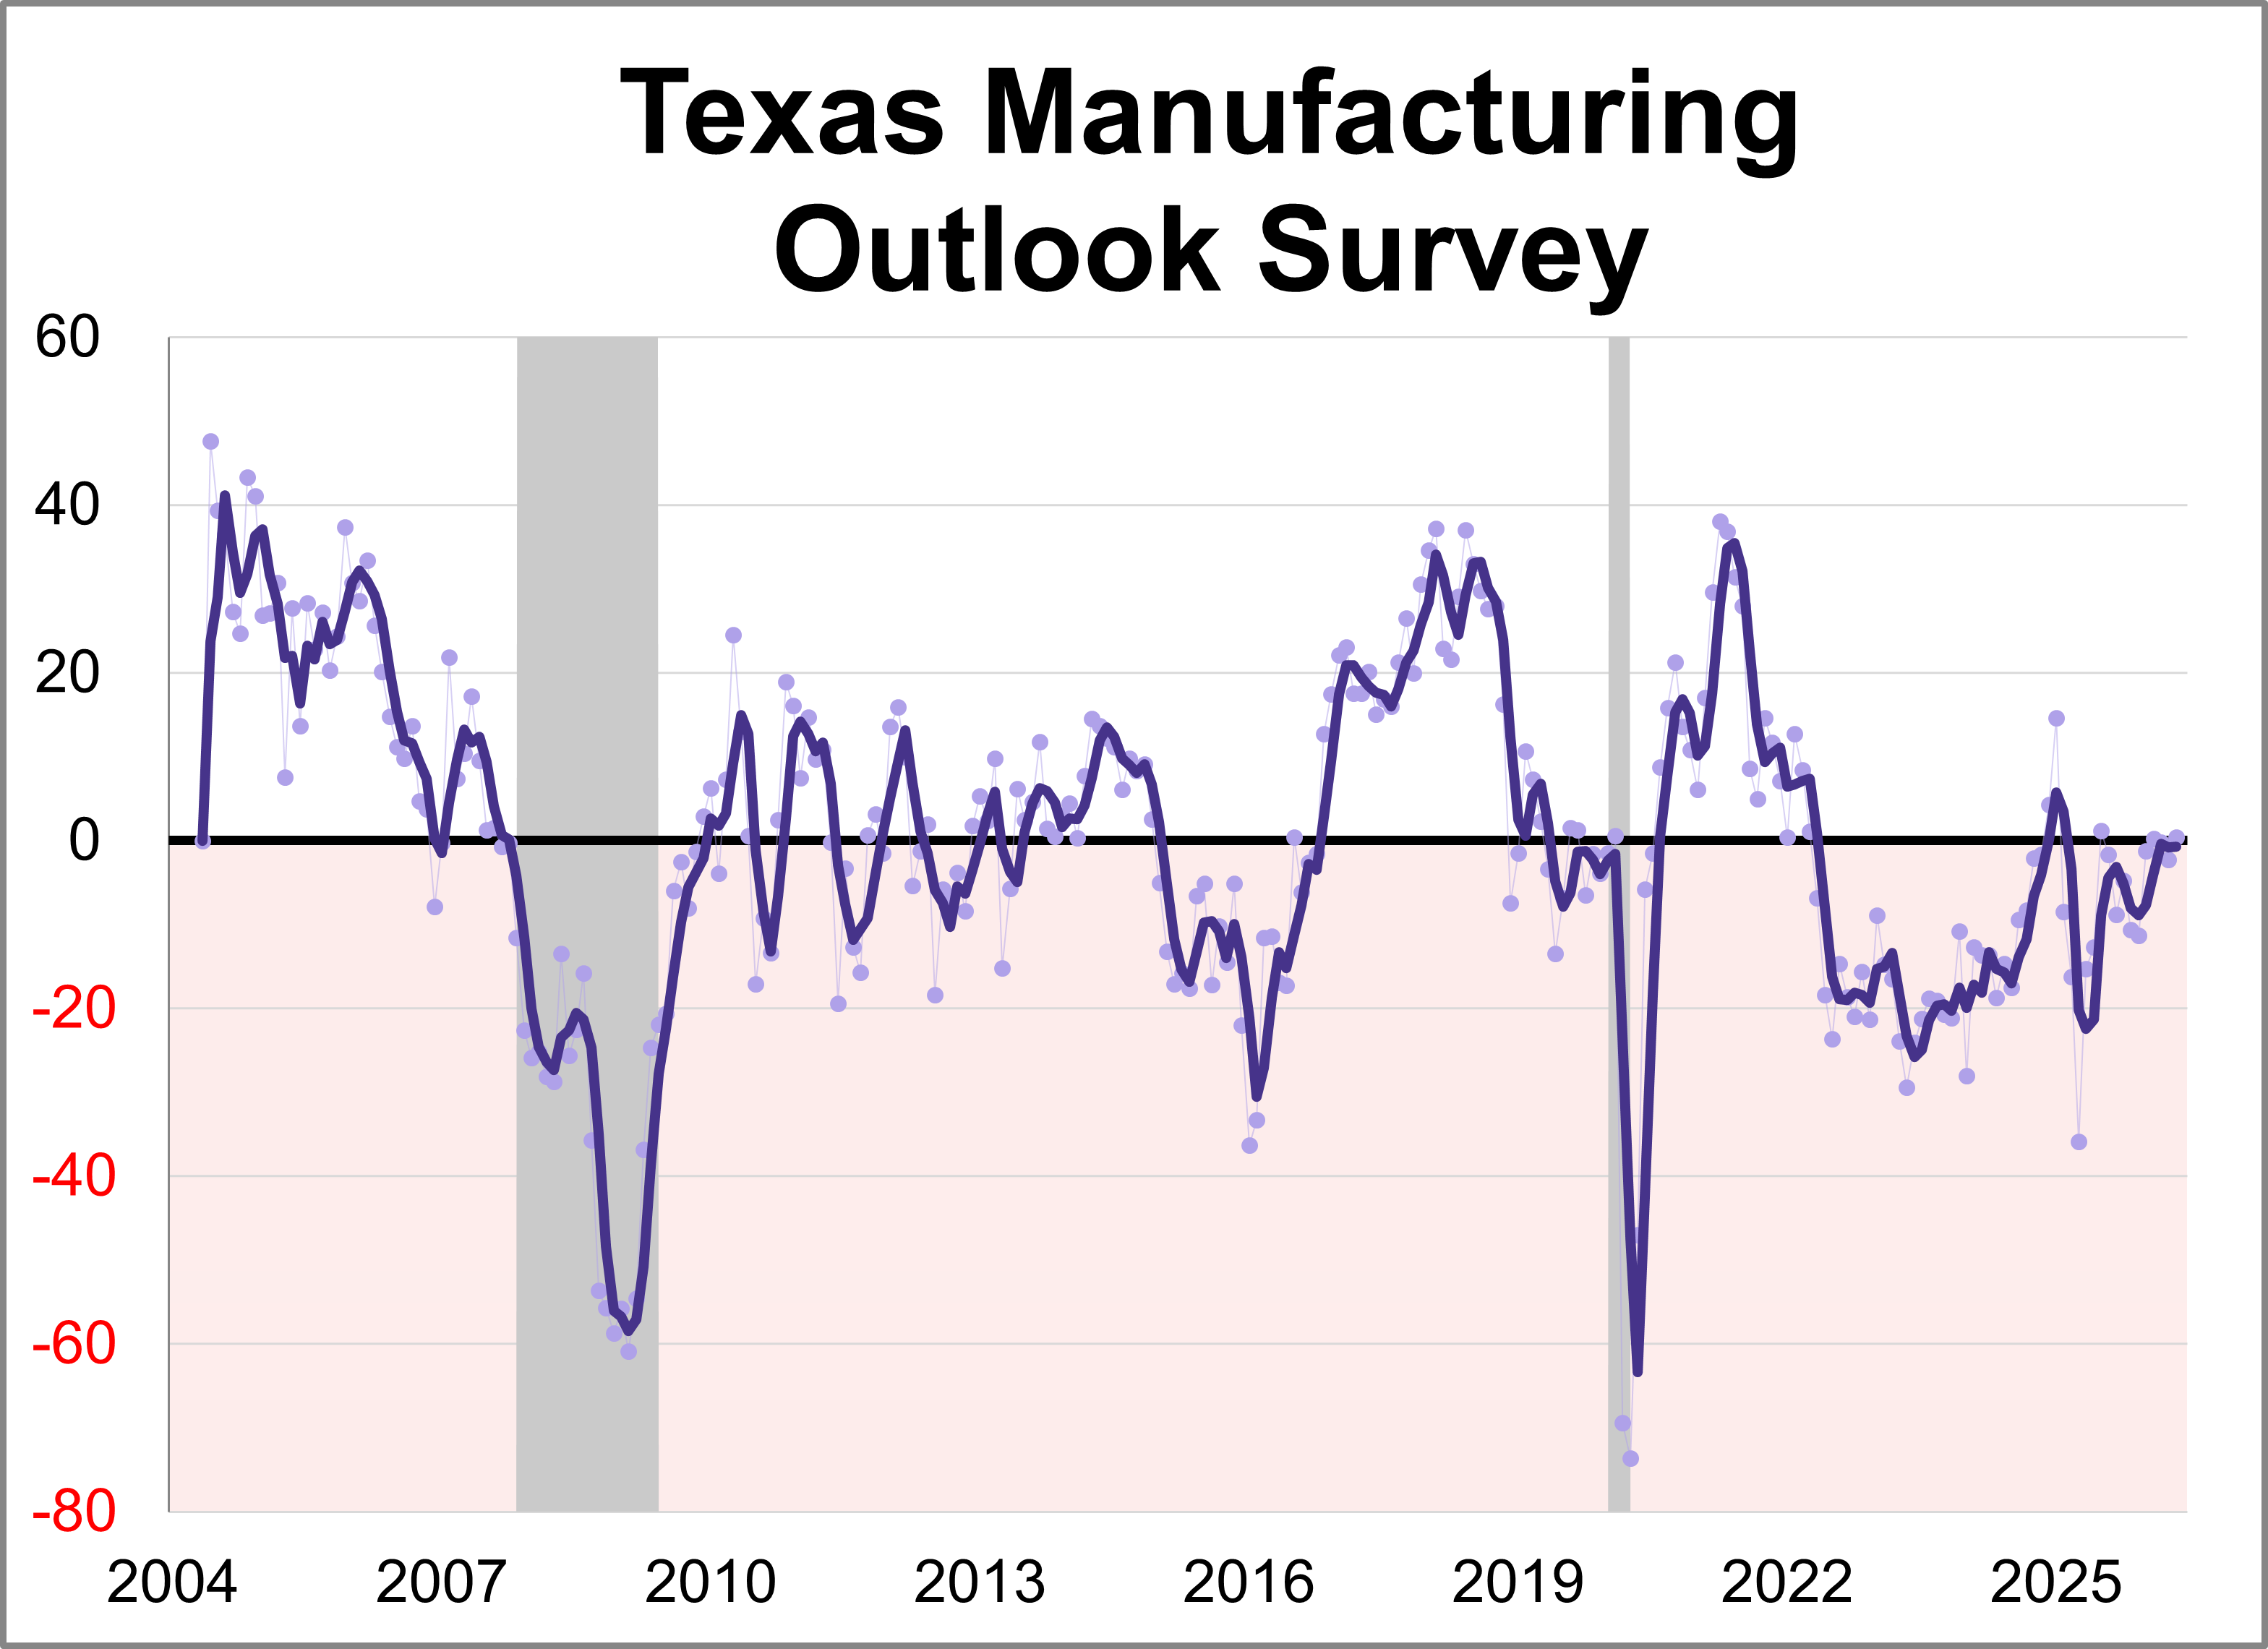
The Dallas Fed released its Texas Manufacturing Outlook Survey (TMOS) for May. The general business activity index rose 2.7 points to 0.4, indicating slower growth of manufacturing activity and stable business conditions perceptions.
There is currently a stark contrast between everyday consumer confidence and financial market behavior. On one hand, persistent inflation and elevated living costs have driven consumer sentiment to historic lows. On the other hand, financial market participants are exhibiting aggressive risk appetite, with margin debt surging to an all-time high record on the heels of major equity market gains.
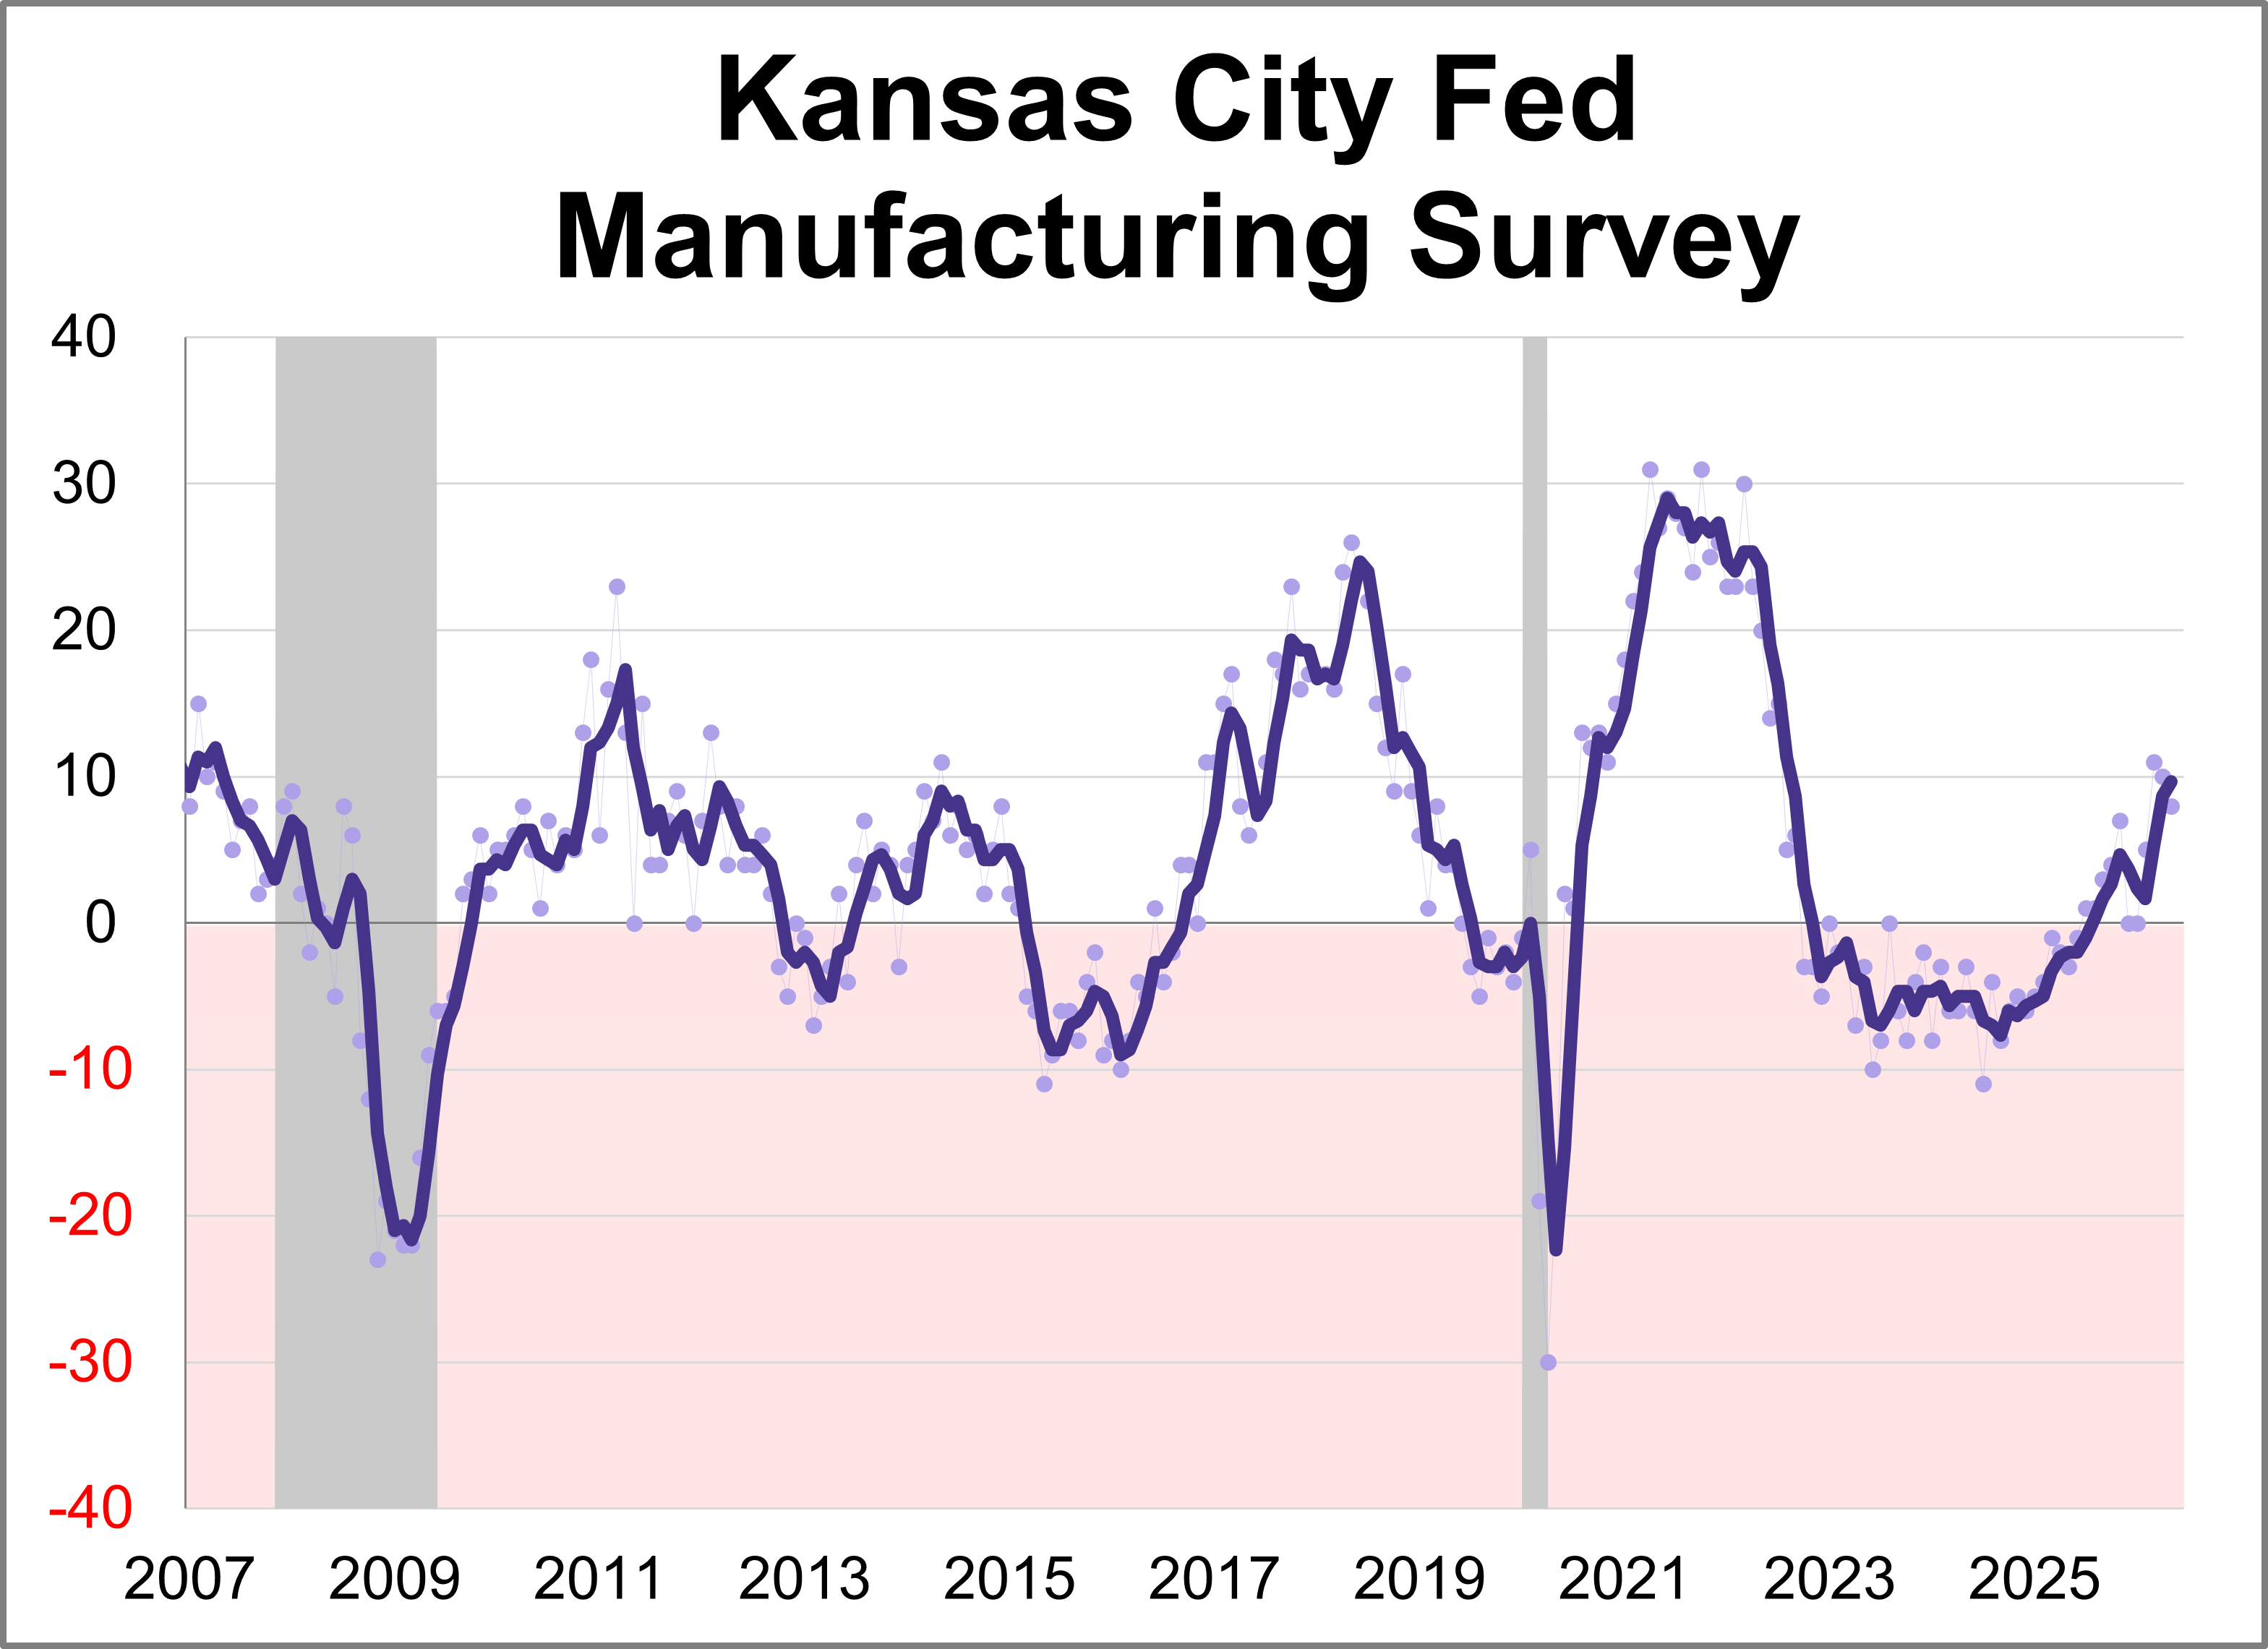
The Kansas City Fed Manufacturing Survey revealed regional activity continued to increase in May. The composite index came in at 8 this month, down slightly from 10 in April but still indicating continued expansion.
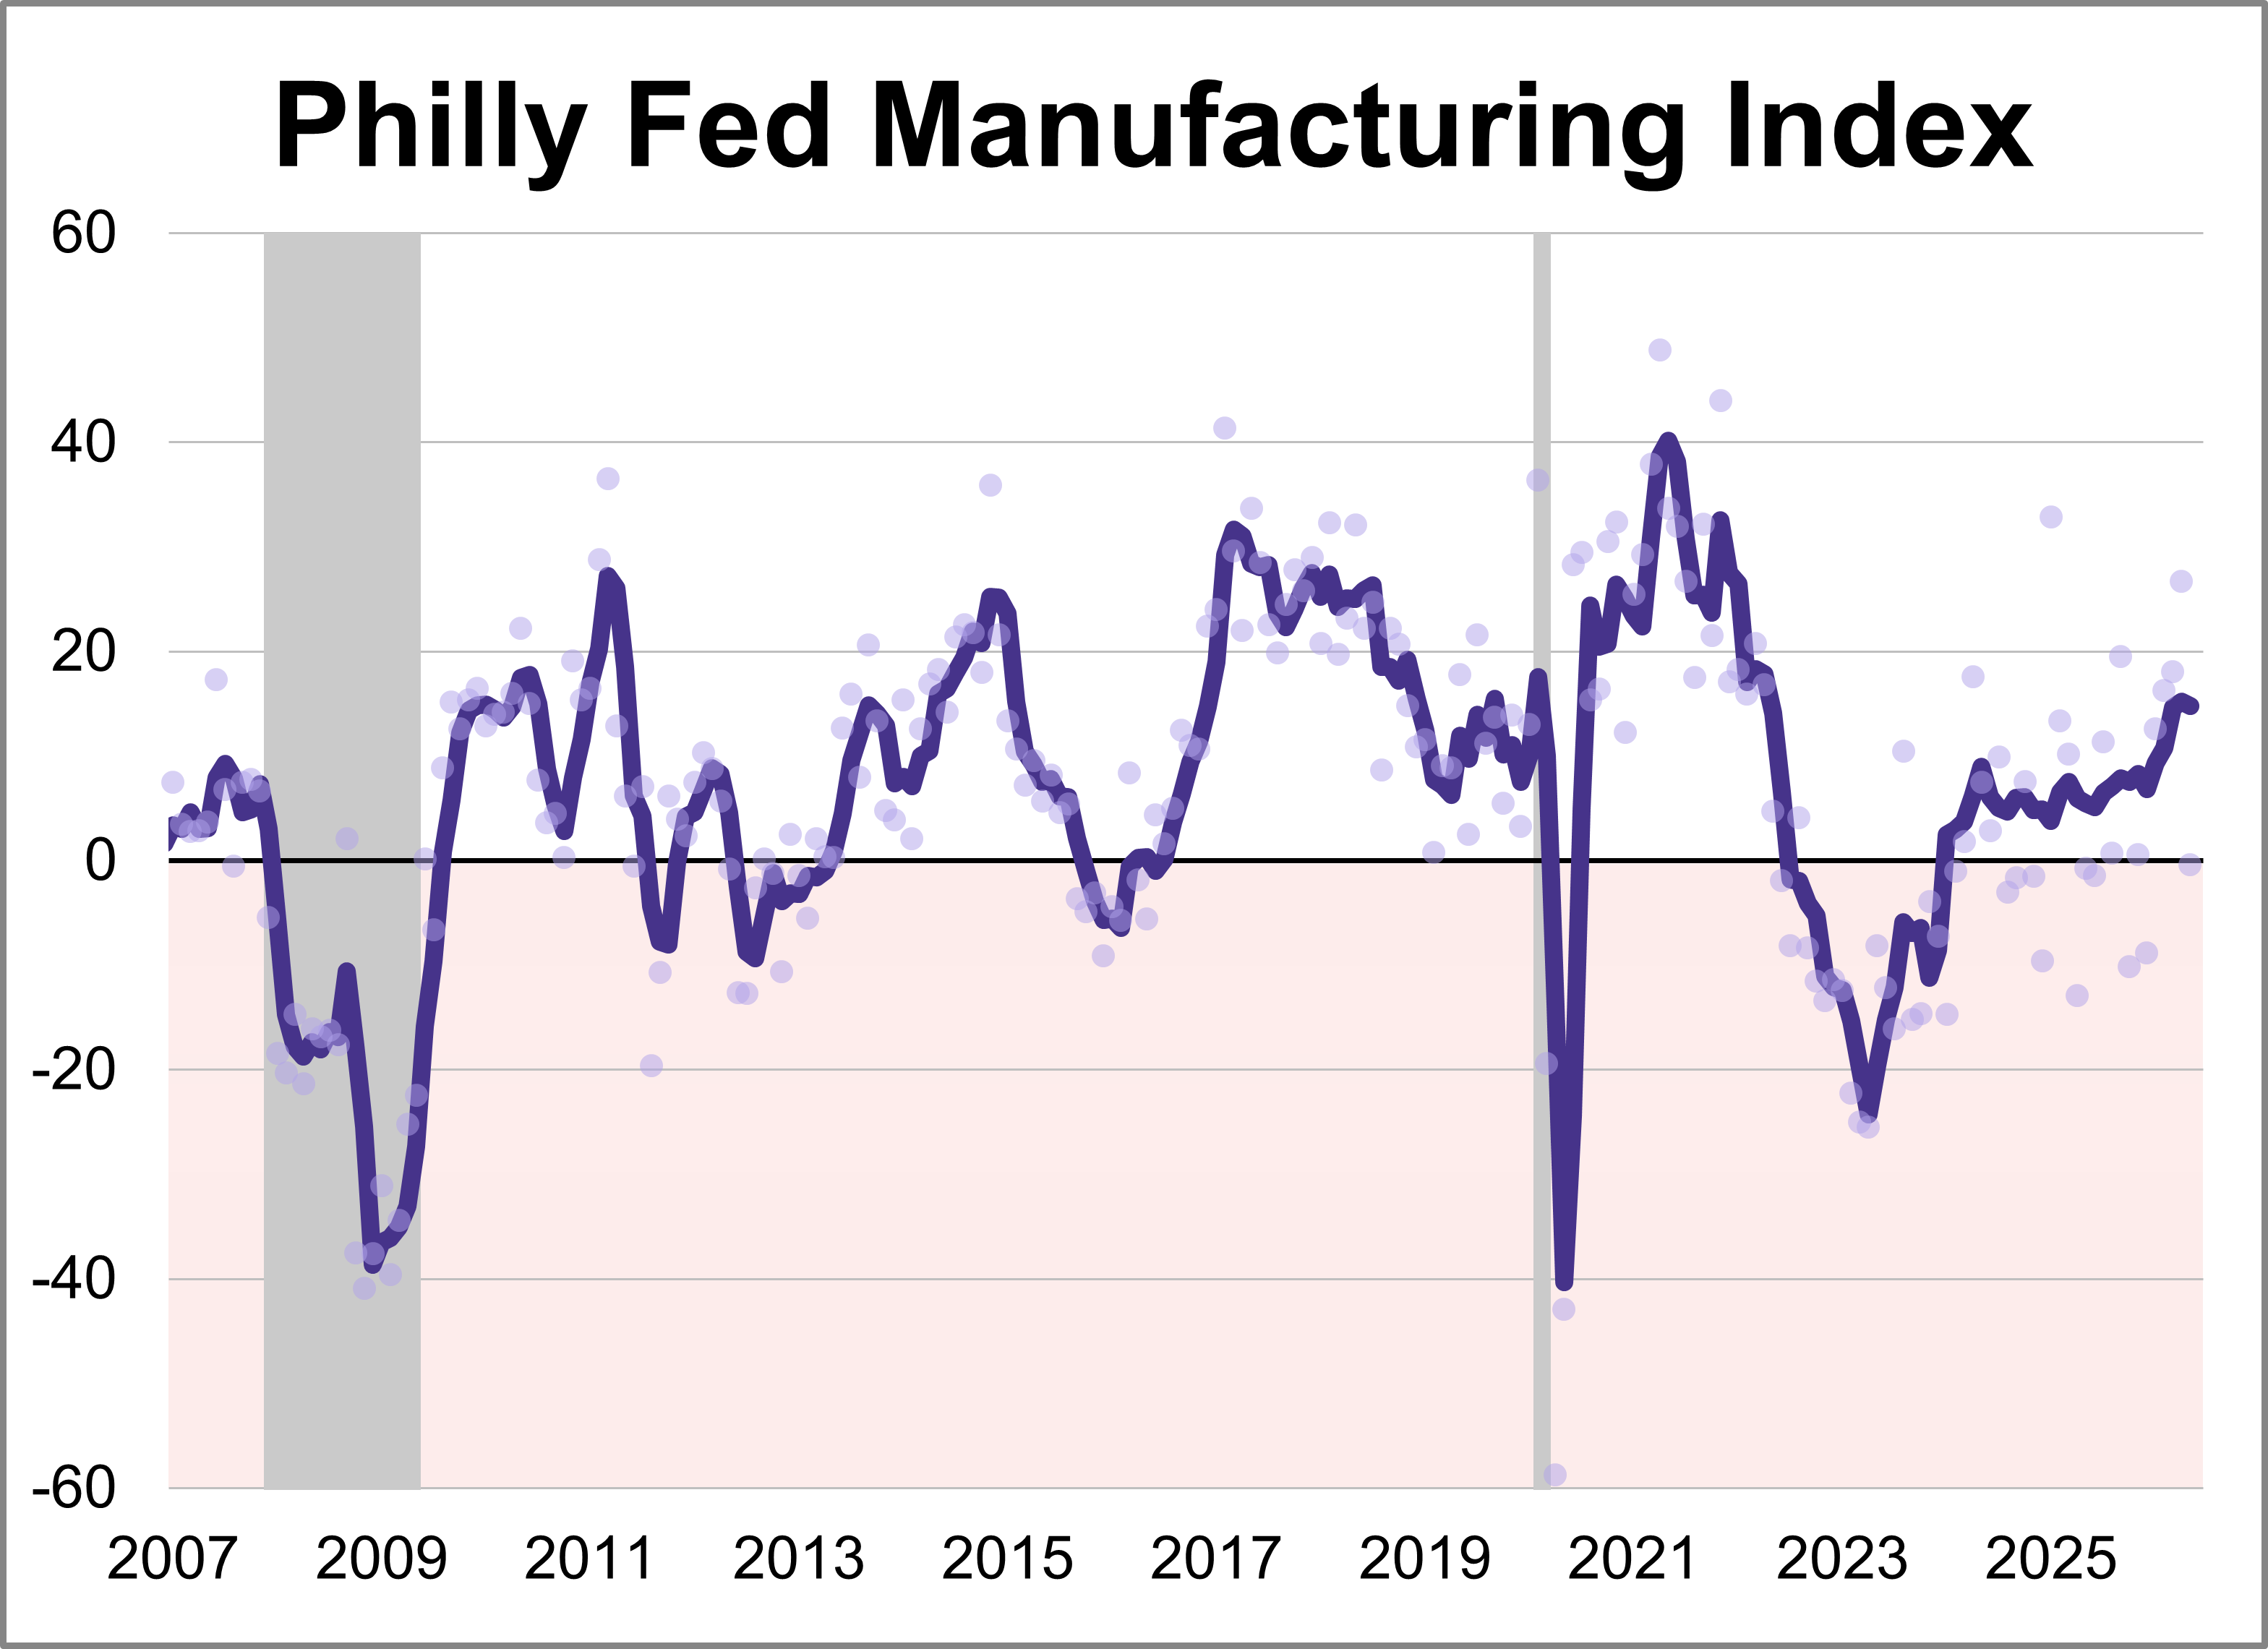
The latest Philadelphia Fed manufacturing index showed activity weakened in May, with the index sinking 27.1 points to -0.4. The latest reading marked the lowest level for the index this year and was worse than the forecast of 17.6.
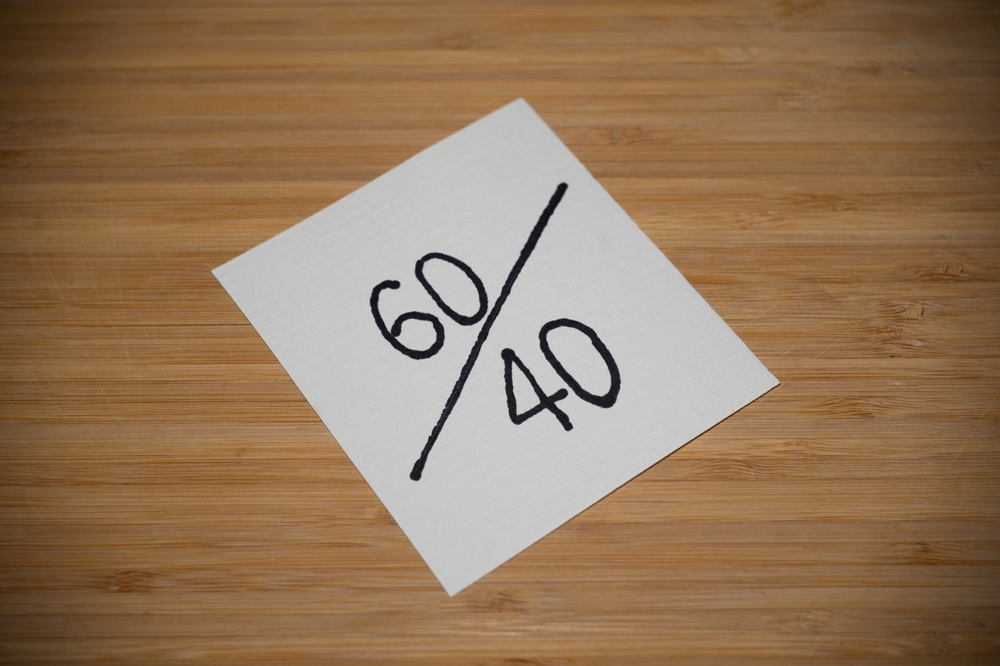
As inflation lingers and market dynamics shift, advisors are rethinking the 60/40 portfolio with managed futures and options income ETFs.
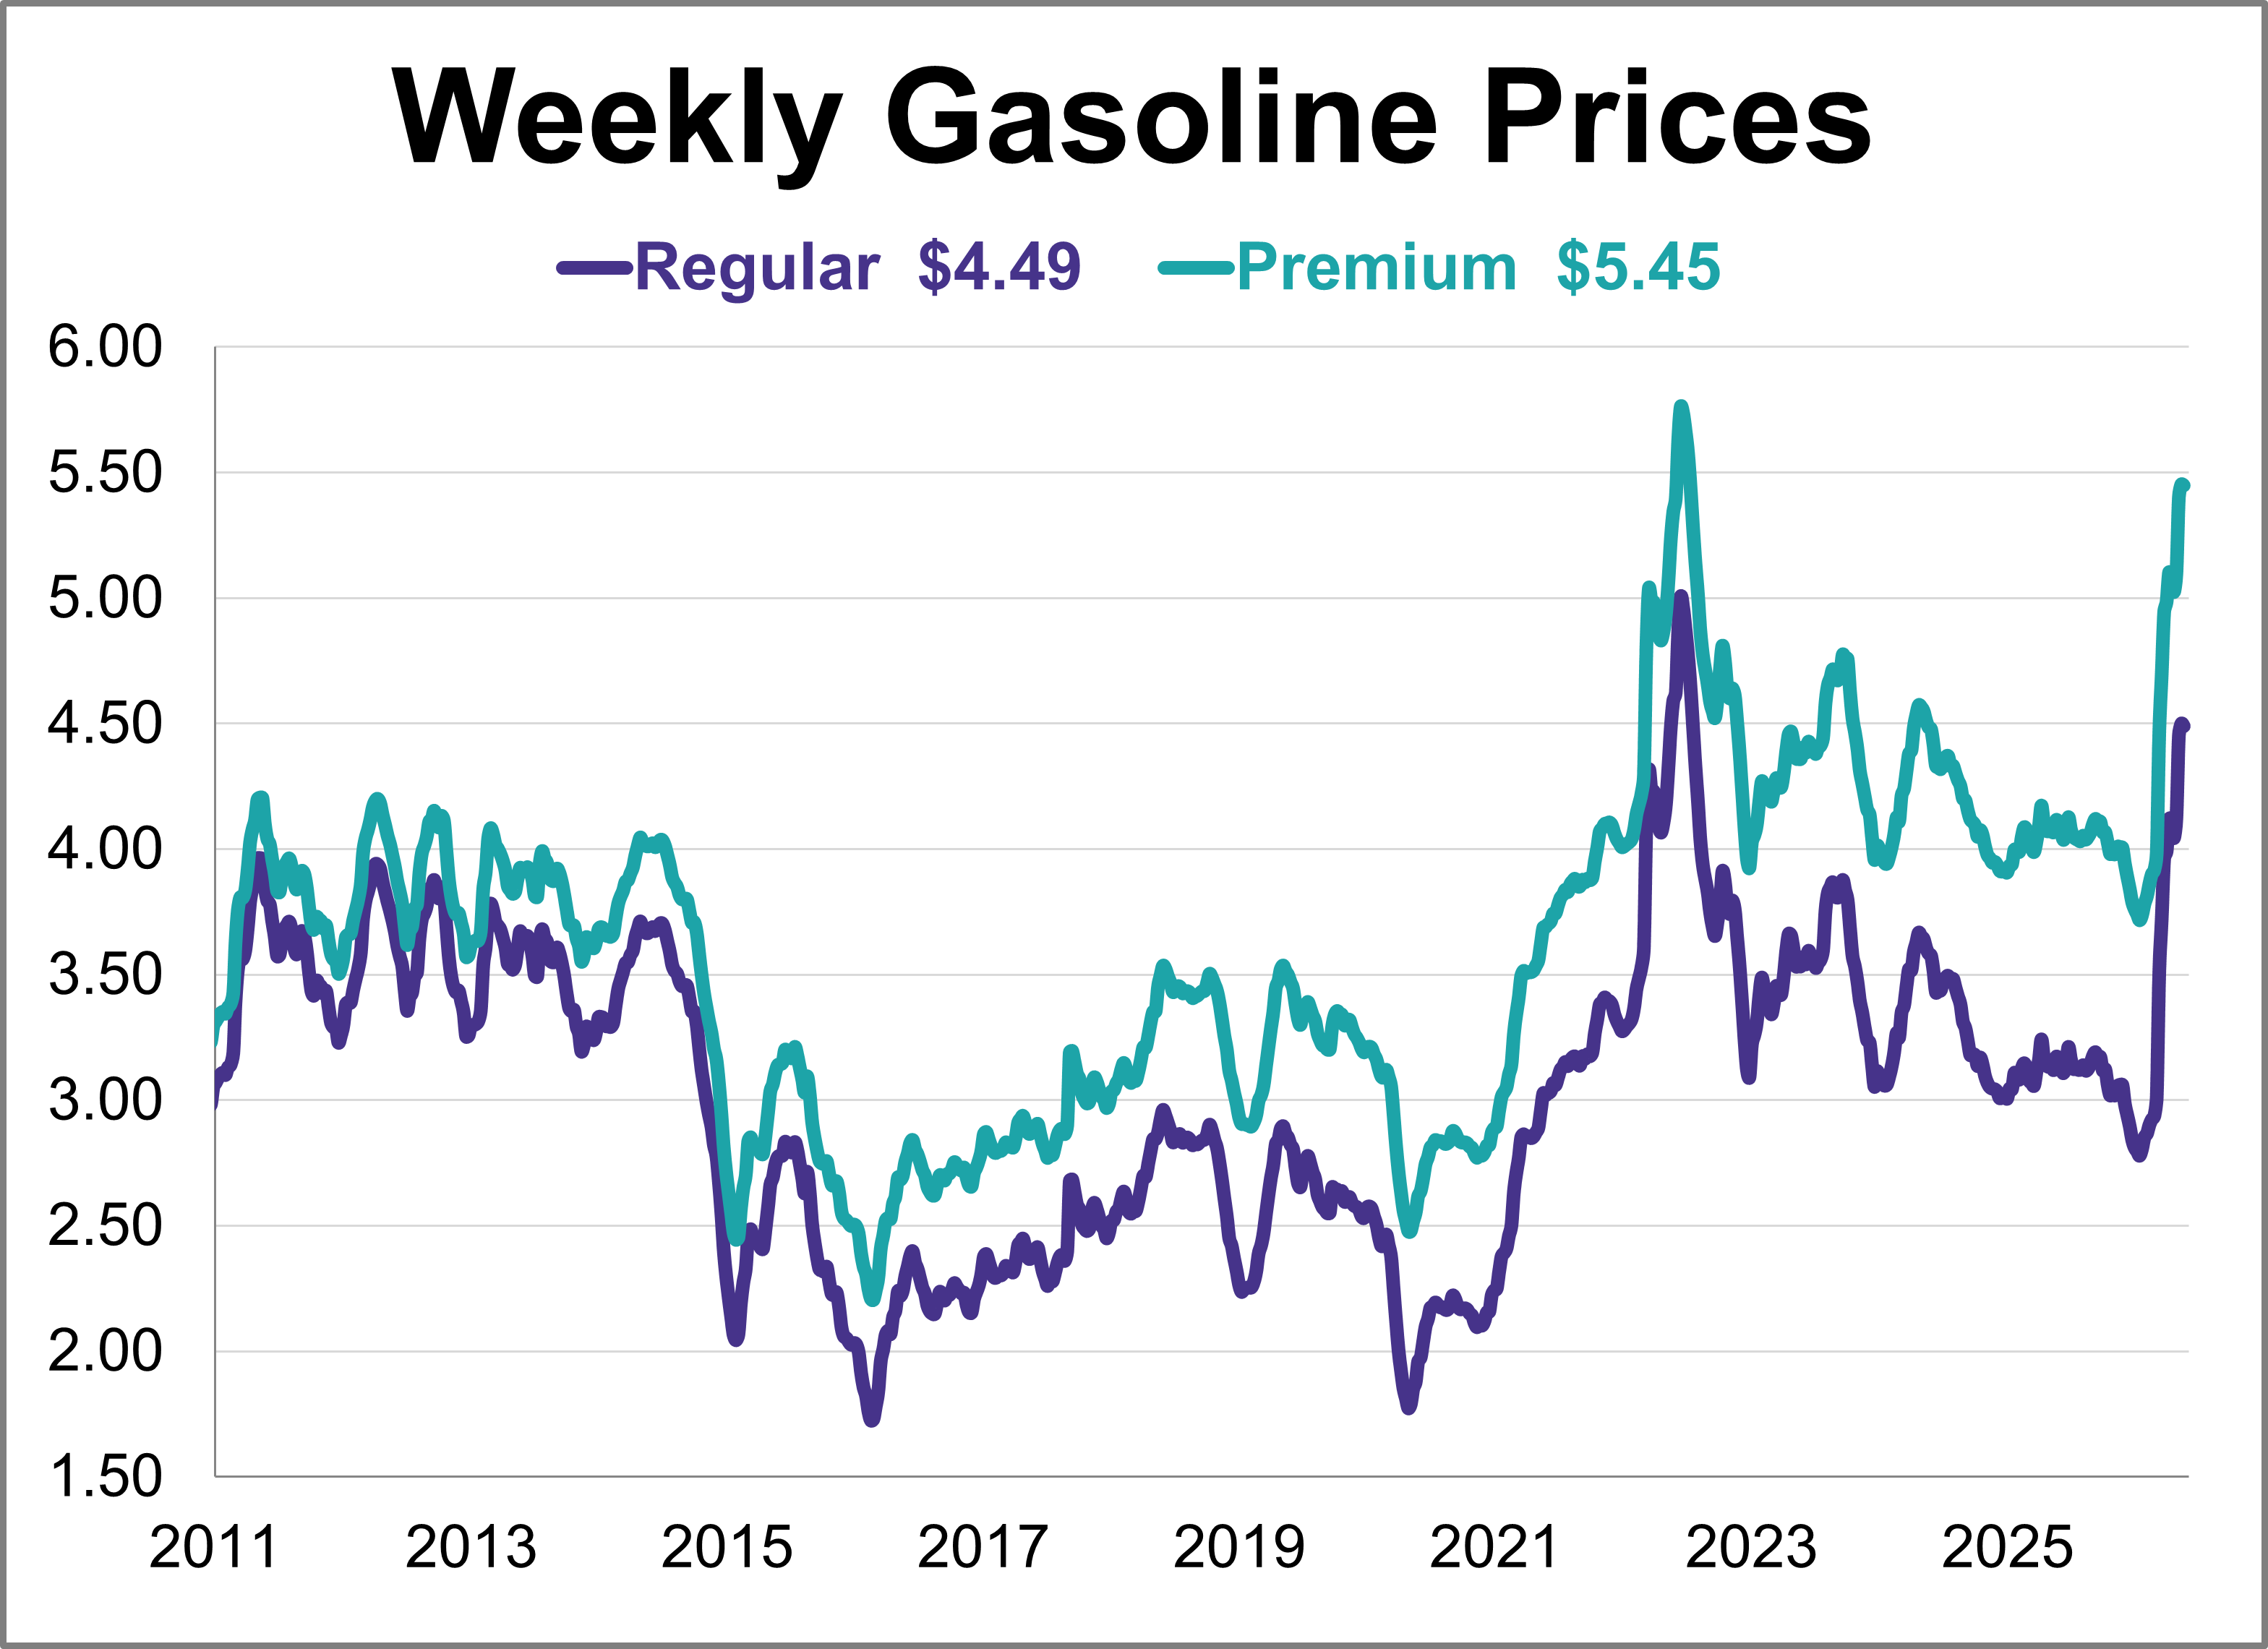
Gas prices were relatively flat this week, remaining at their highest level in nearly four years. As of May 18th, weekly prices were down 1 cent for regular and were unchanged for premium.
The U.S. economic landscape in April was defined by a significant rebound in inflation across both consumer and wholesale sectors, complicating the path for future monetary policy.
Explore how Women in ETFs & CFAOC experts believe AI will supplement, not replace, financial professionals.
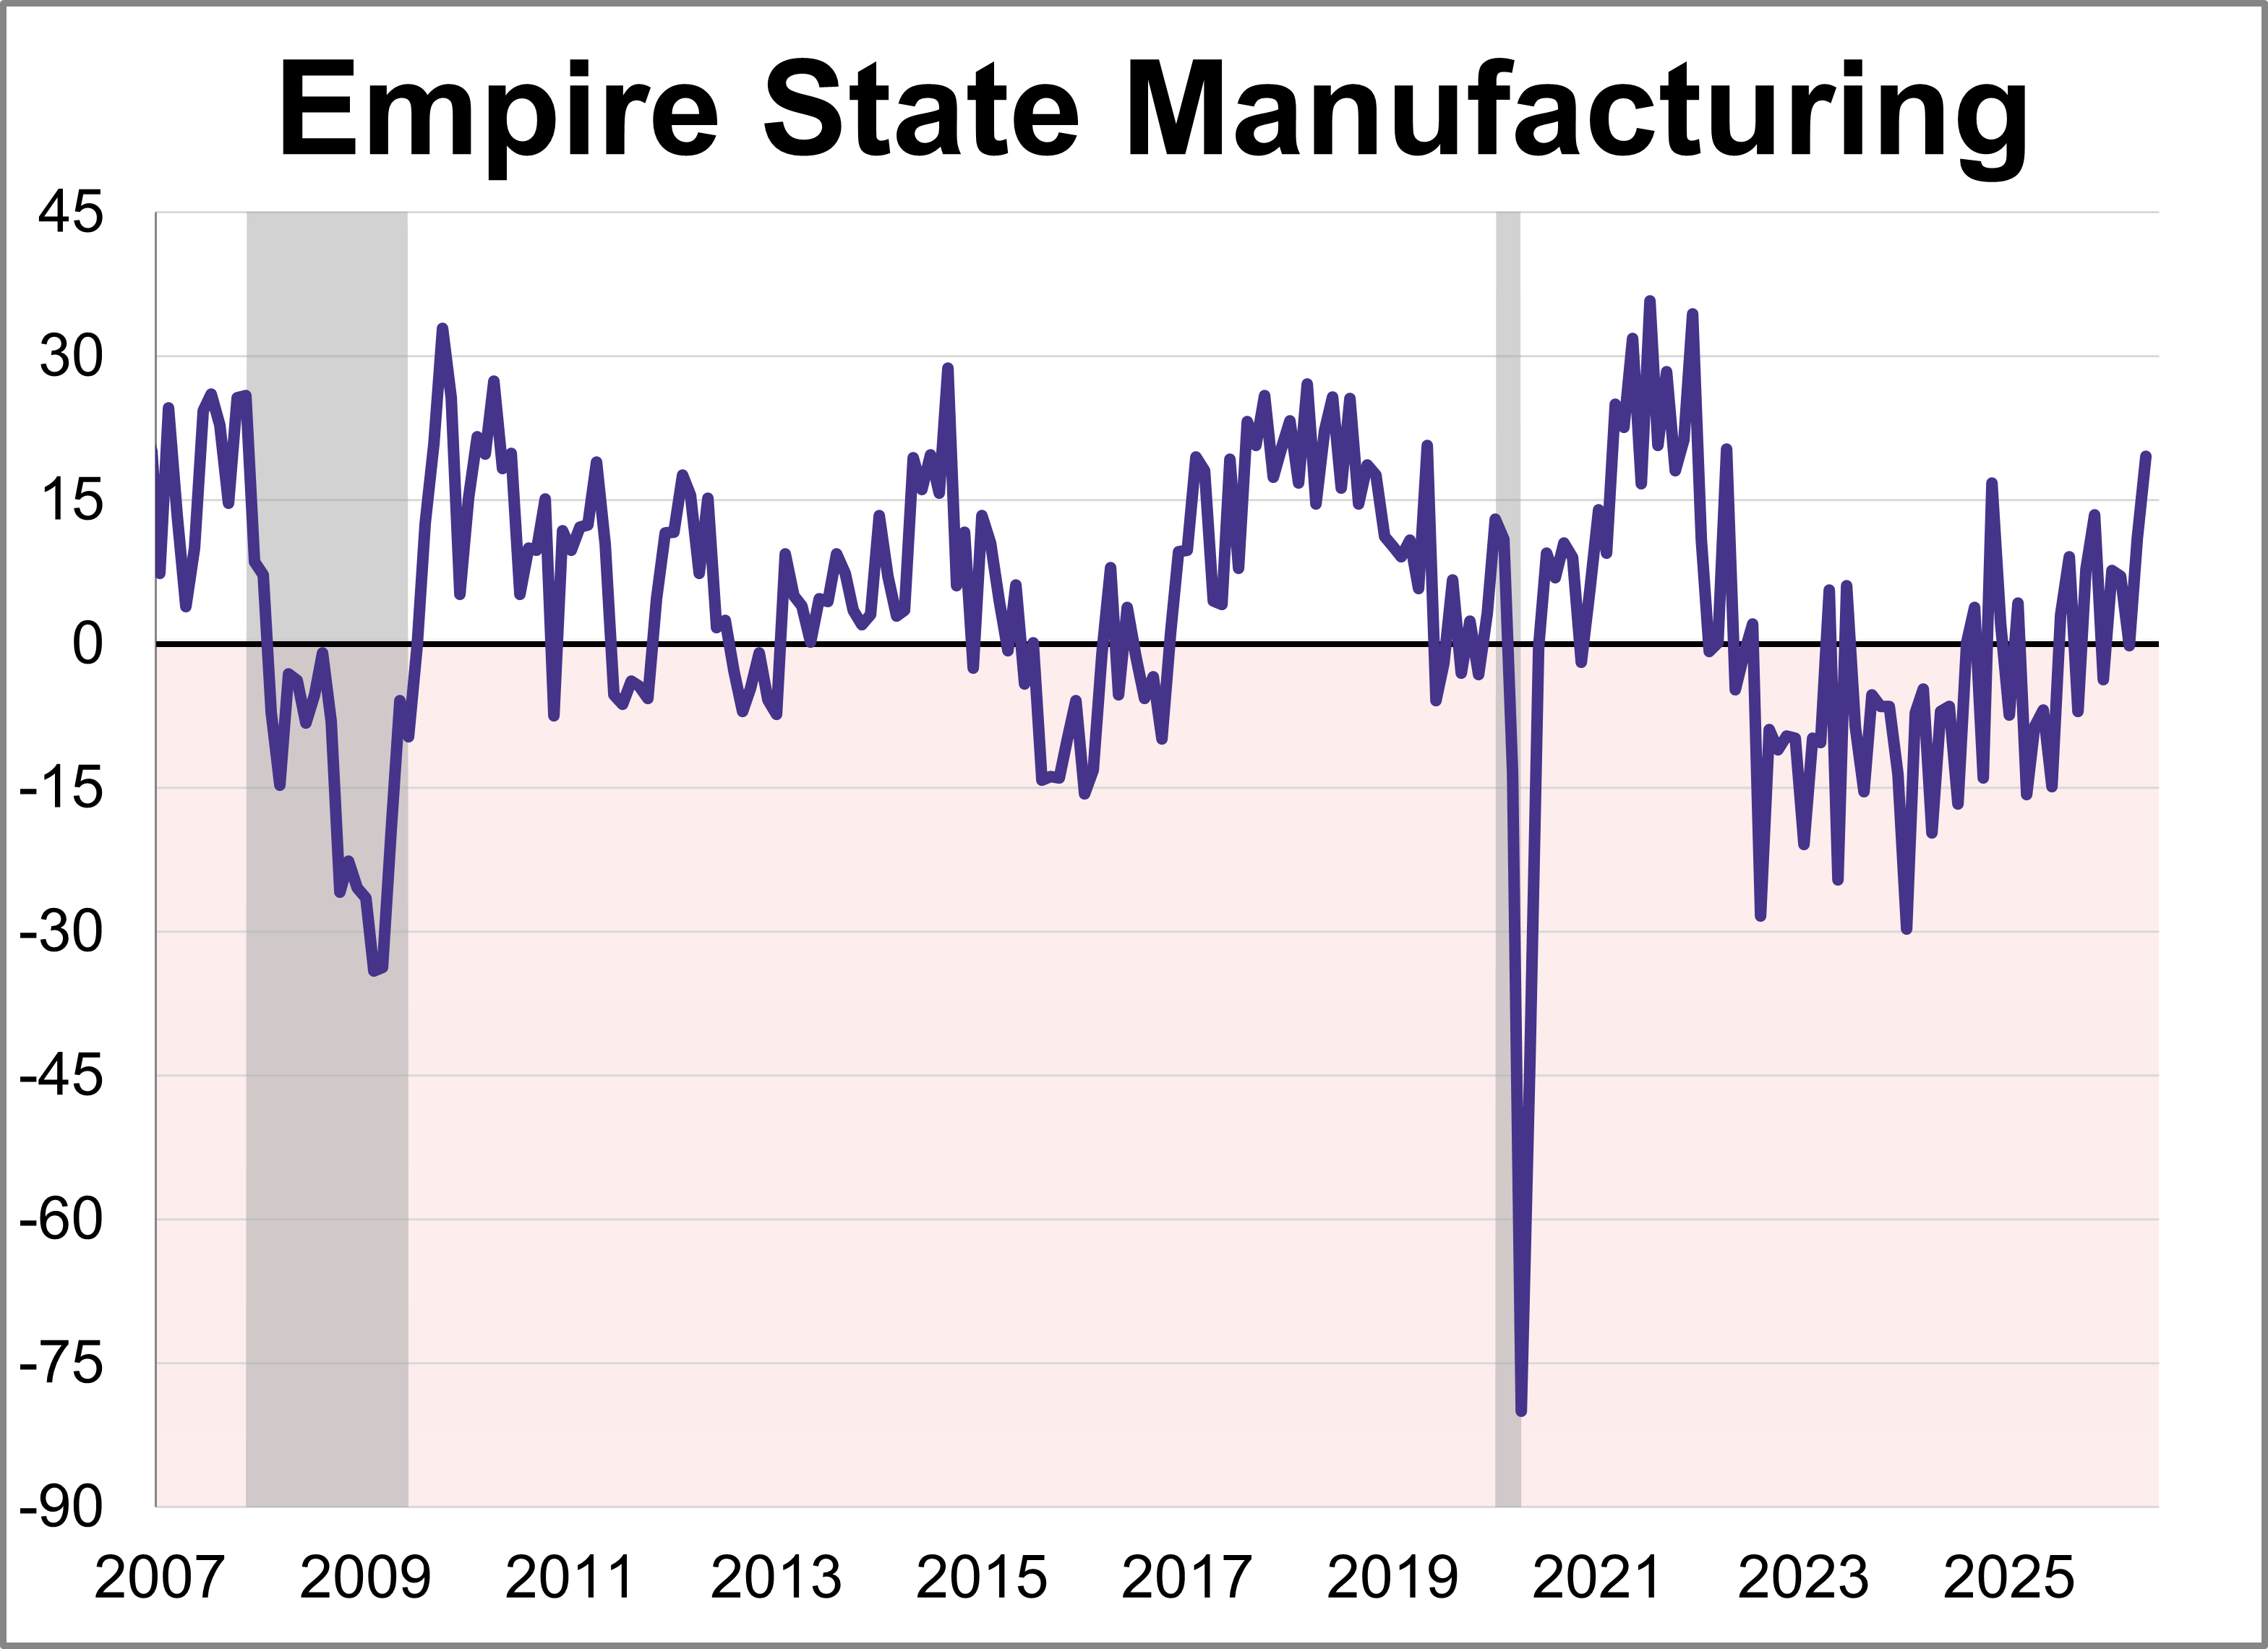
Manufacturing activity grew strongly in New York State, according to the Empire State Manufacturing May survey. The diffusion index for General Business Conditions rose 8.6 points to 19.6, its highest level in over four years.
Investors and advisors often seek private equity, but they are frequently thwarted by liquidity and other issues.
Addressing common 529 Savings Plan concerns and how recent legislative updates have broadened the 529 scope.
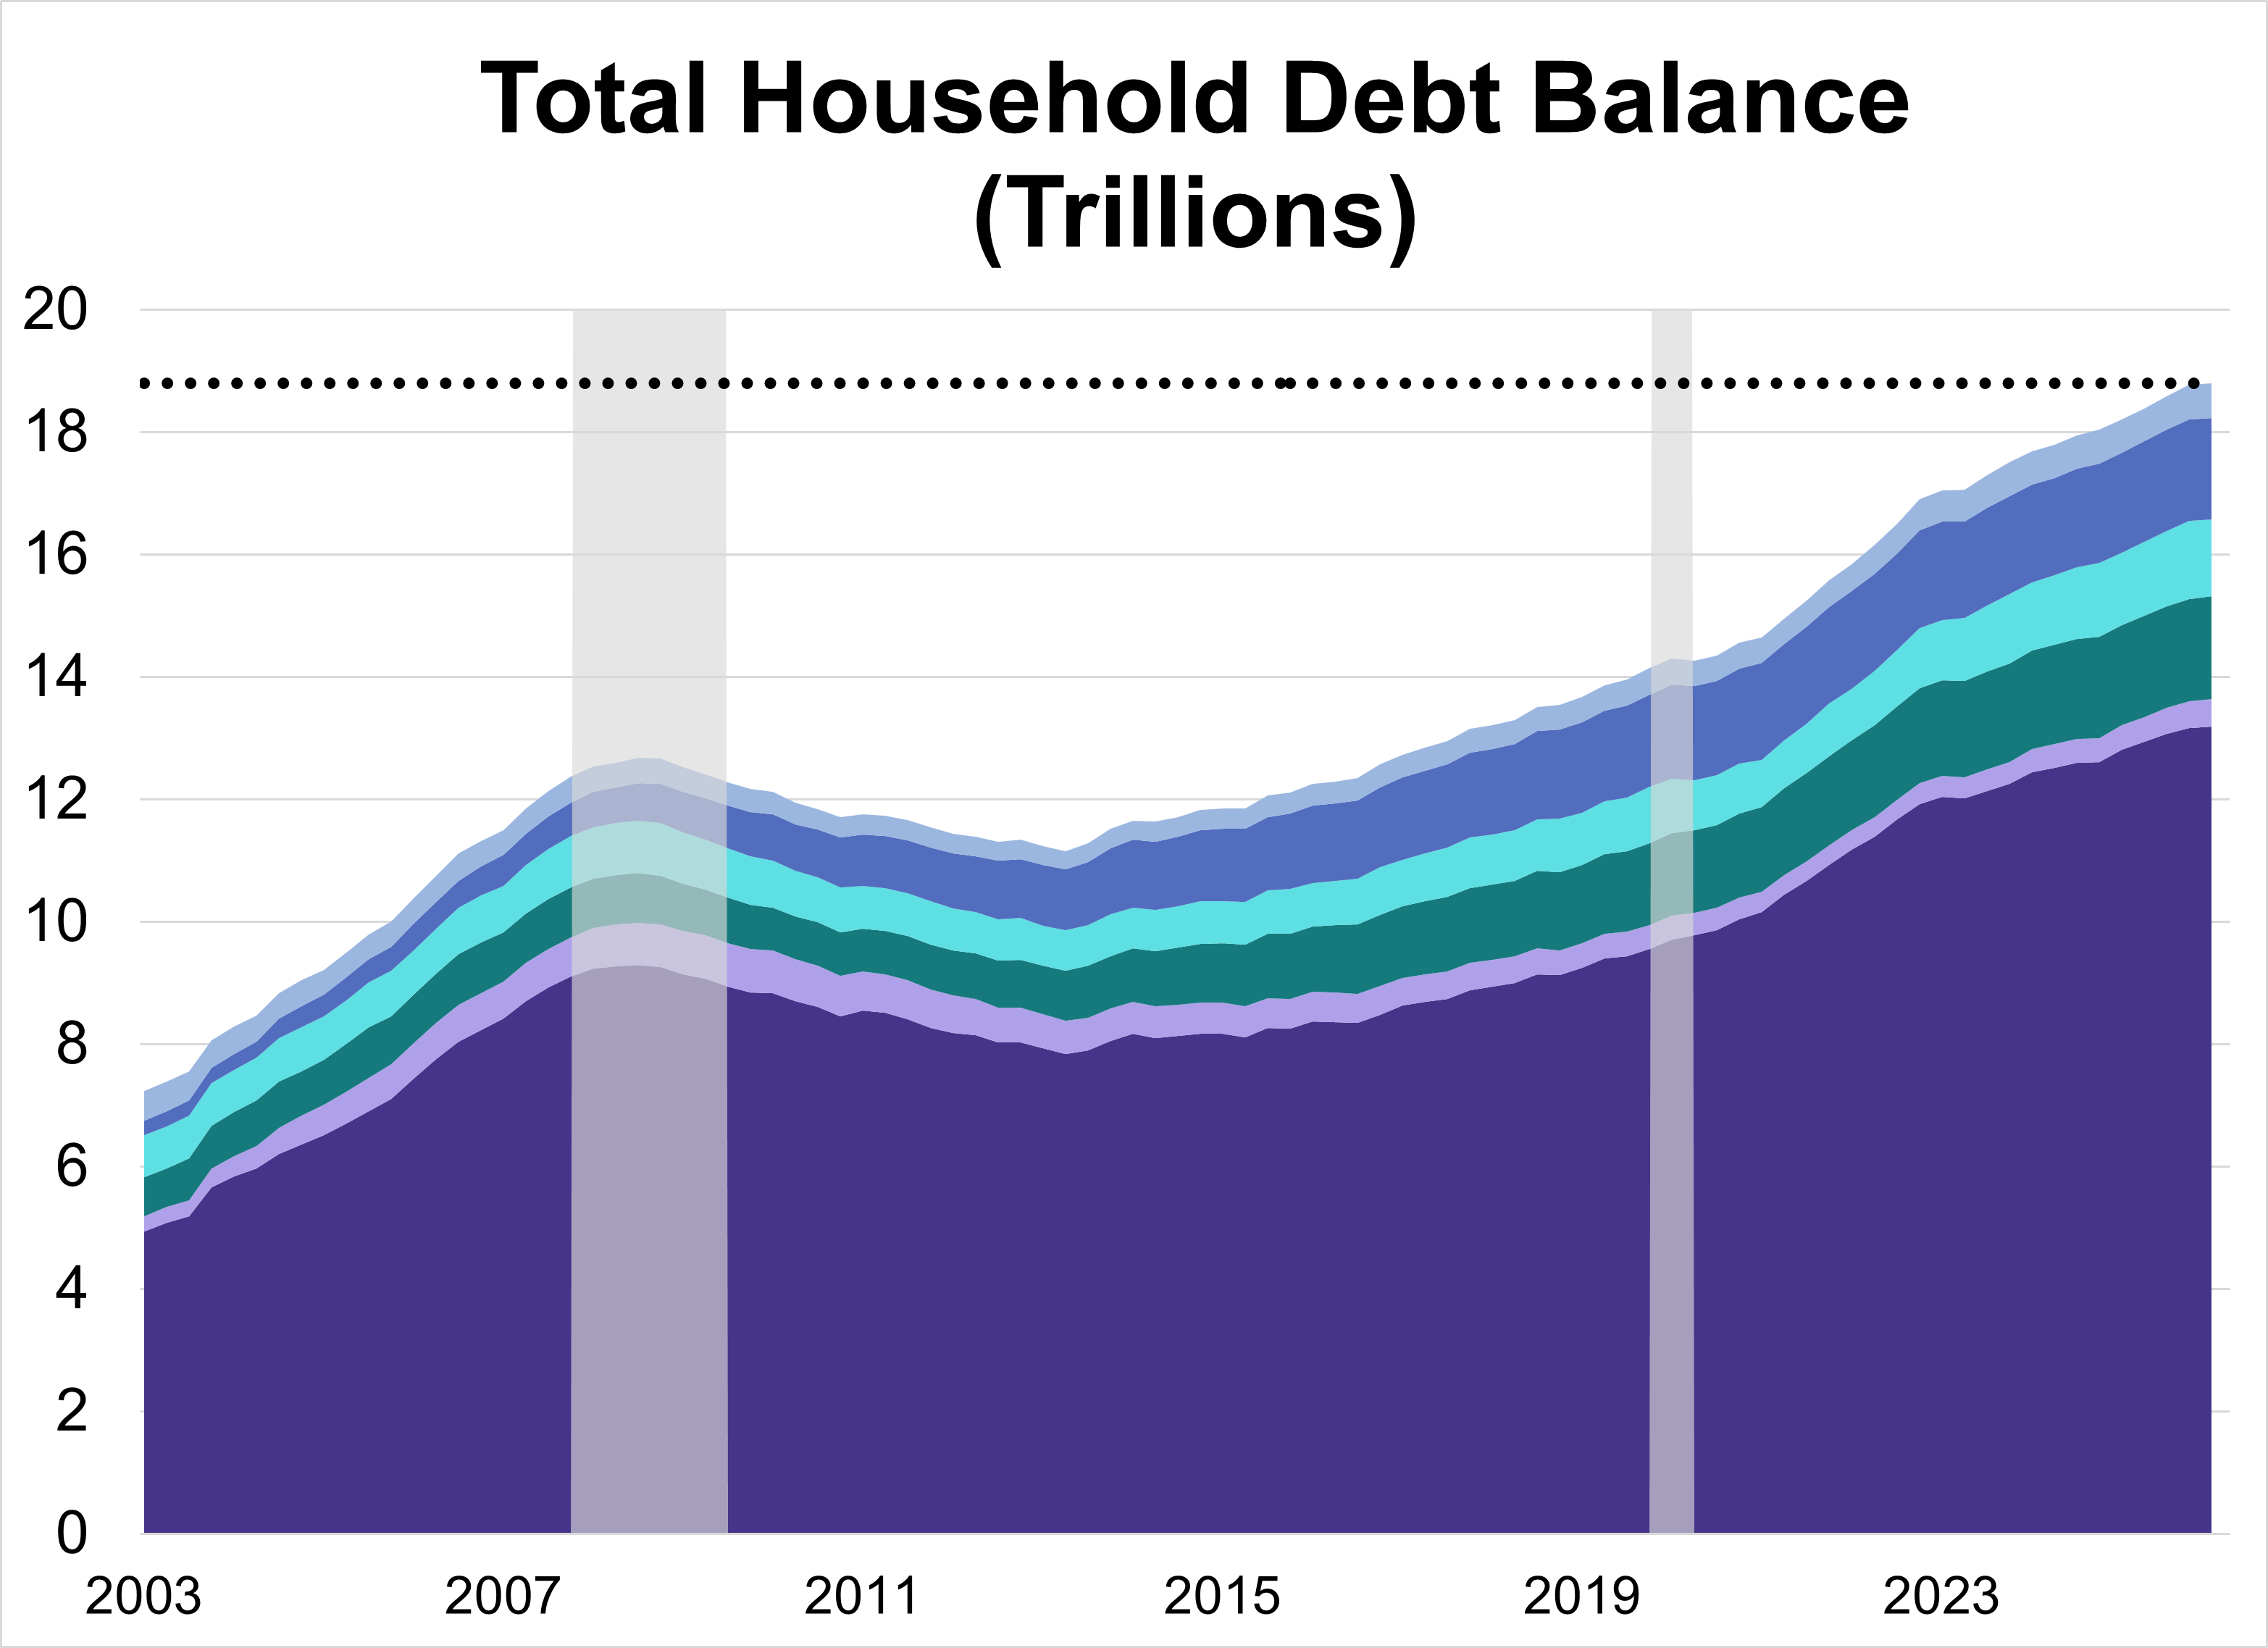
Total U.S. household debt climbed to a record $18.79 trillion in Q1 2026, a modest 0.1% ($18 billion) increase from the previous quarter. The overall rise was driven by increases across a handful of categories, specifically mortgage and auto loan balances.
Munis may have struggled a bit in March, but the long-term environment for these bonds remains full of potential.
Explore the new 529 rules, including Roth IRA rollovers, the grandparent loophole, and higher K-12 limits.
The U.S. labor market demonstrated remarkable endurance in April, with job gains outpacing expectations and private sector expansion reaching its strongest point in over a year. As the Federal Reserve maintains a steady interest rate policy, the focus now turns to upcoming inflation and retail data to gauge the sustainability of this momentum.
As market volatility lingers, the latest S&P Persistence Scorecard reveals a sobering reality for active managers.
Research Affiliates explains how a fundamental growth strategy can outperform traditional market-cap-weighted growth indices.
TCW's concentrated strategy targets power grid constraints over clean tech, riding demand from AI and manufacturing reshoring.
Retirement is a challenge for countless investors and their advisors. A new report from Goldman Sachs has more.
April saw a variety of articles published on Advisor Perspectives address core questions with which advisors and their client must contend.
Advisors are rethinking strategy in 2026, as geopolitics, AI adoption, and downside risk reshape market expectations and investment decisions.
Momentum and growth dominated in April 2026, driving the S&P 500 to a massive 10.5% return. Discover the data behind this risk-on shift.
The U.S. economy ended April with mixed signals: steady interest rates and high Fed dissent met persistent, energy-driven inflation. Despite these hurdles, accelerated Q1 growth and rising consumer confidence provided a buffer against ongoing global instability.
Volatility ETFs have specific purposes to fulfill for investors -- so have they done so in a very volatile year?
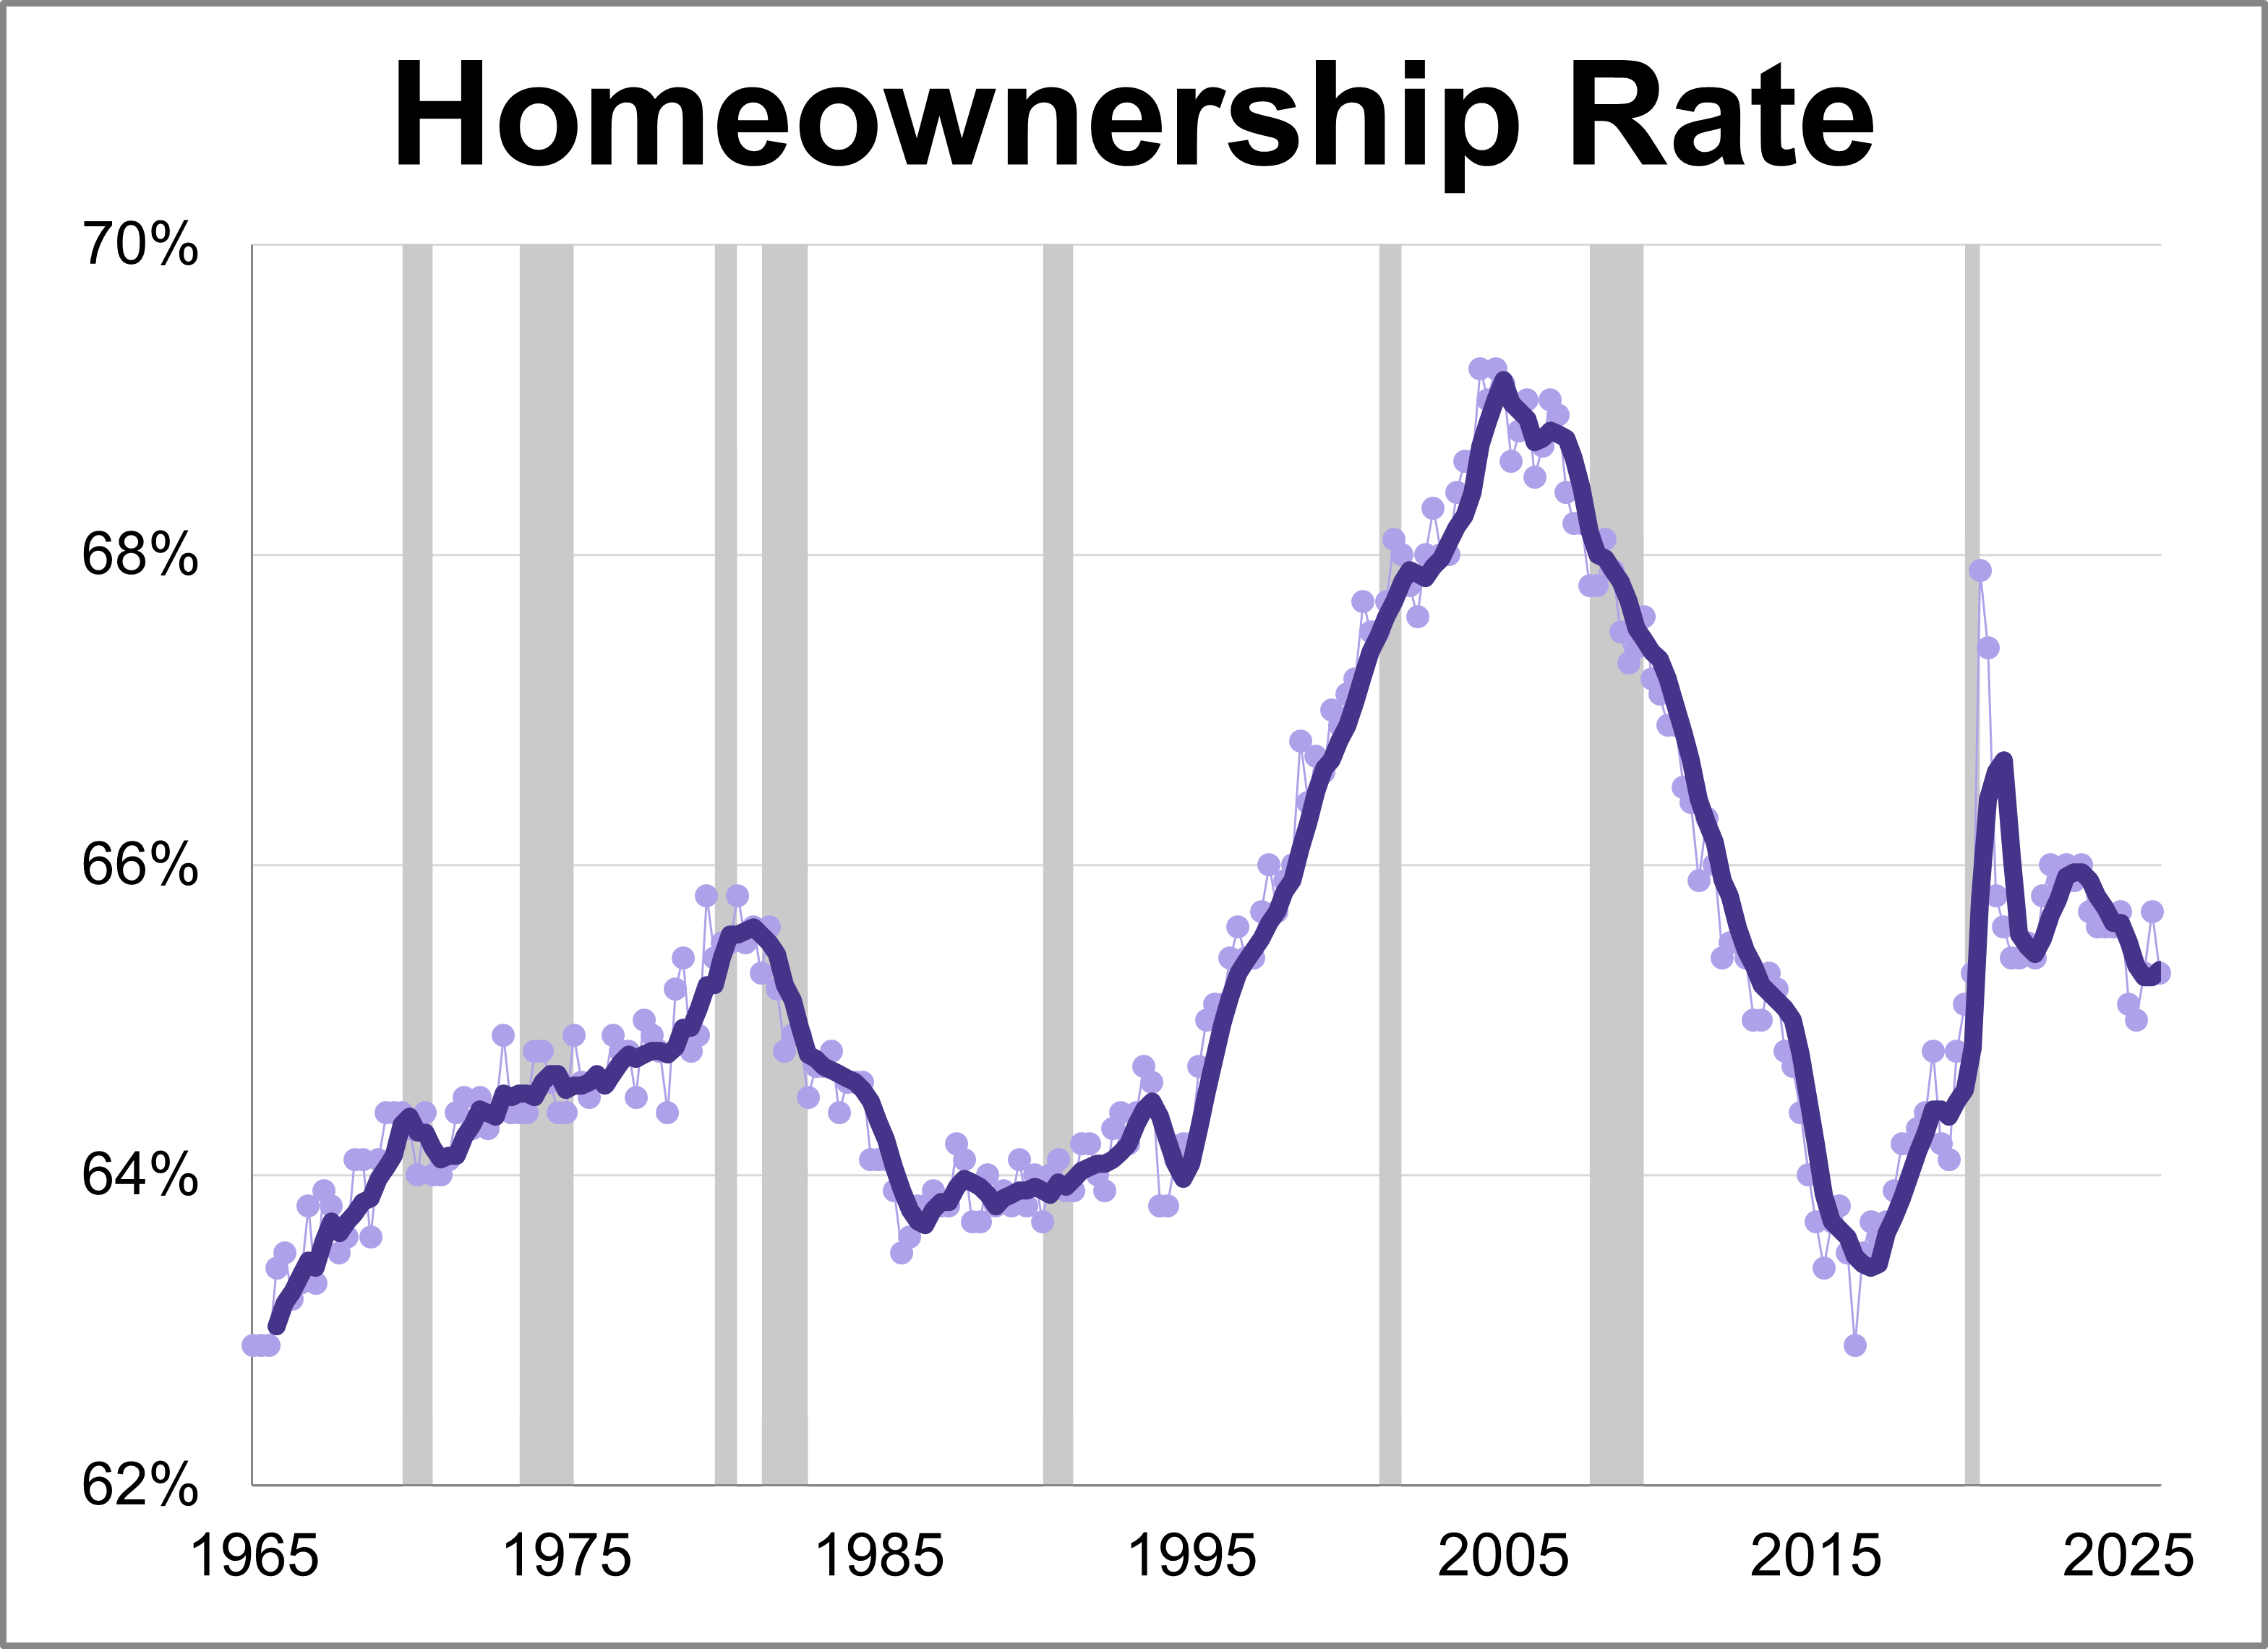
The Census Bureau released its latest quarterly report for Q1 2026 showing the latest homeownership rate is at 65.3%.
Fifth district manufacturing activity increased in April according to the most recent survey from the Federal Reserve Bank of Richmond. The composite manufacturing index rose three points points to 3, marking the highest level for the index in 20 months. This month's reading was above the forecast of 2.
Last week’s economic data was defined by conflicting signals from the consumer. While retail figures suggest resilience, sentiment levels have plummeted to record lows. Meanwhile, the S&P 500 continued its historic rally as markets prepare for the upcoming Fed decision.
Active ETFs are no longer a niche satellite play; they are becoming central pillars of modern portfolio construction.
While recent market performance reflects optimism over potential geopolitical de-escalation, underlying economic data reveals a complex landscape of intensifying price pressures and cooling growth. This article examines the major economic news from the week of April 6-10th, 2026.
While recent market performance reflects optimism over potential geopolitical de-escalation, underlying economic data reveals a complex landscape of intensifying price pressures and cooling growth.
The traditional 60/40 portfolio is undergoing a structural renovation, but the fixed income sleeve is proving difficult to stabilize.
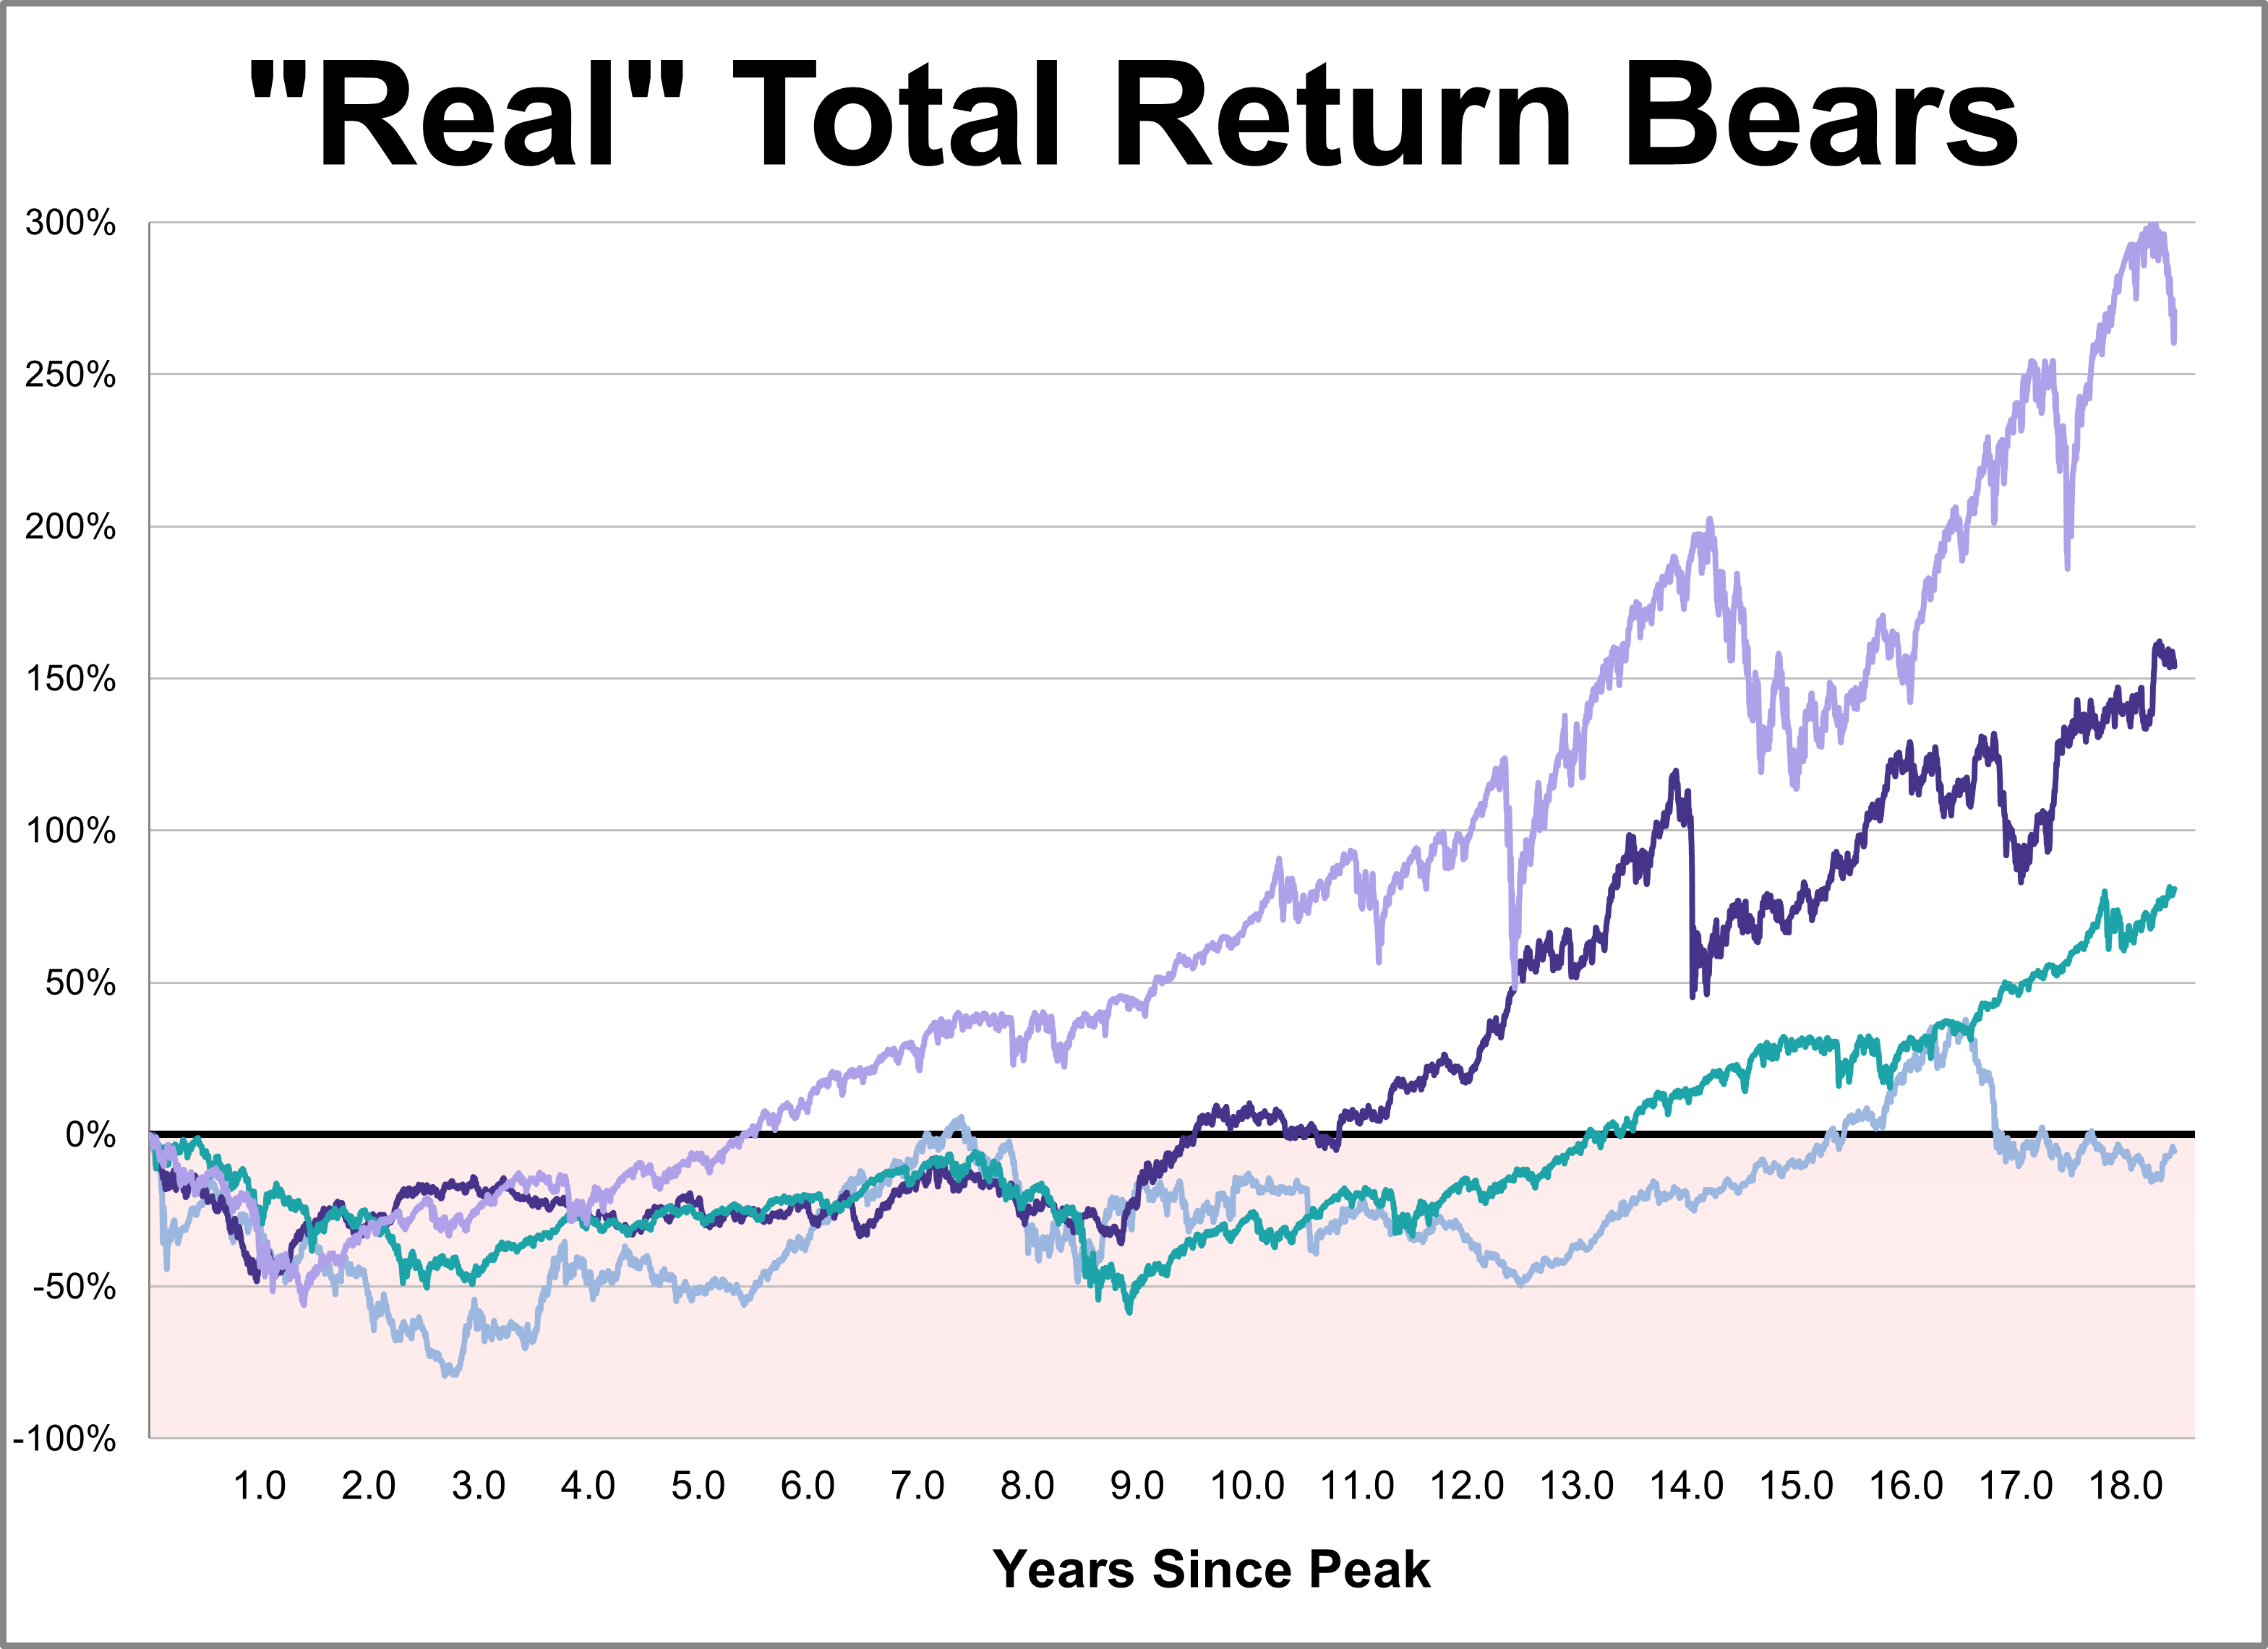
While every market downturn is unique, history offers a crucial lens for understanding recovery. This chart series provides a comprehensive overlay of the Four Bad Bears in U.S. history since the 1929 peak, comparing their recovery paths through the S&P 500's close on March 31, 2026.
Learn how advisors can optimize late-start 529 plans using superfunding, SECURE 2.0 Roth rollovers, and multi-scenario modeling.
Discover how abrdn’s K-1 free ETF outpaced gold and the S&P 500 in March 2026 by providing broad, tax-efficient commodities exposure.