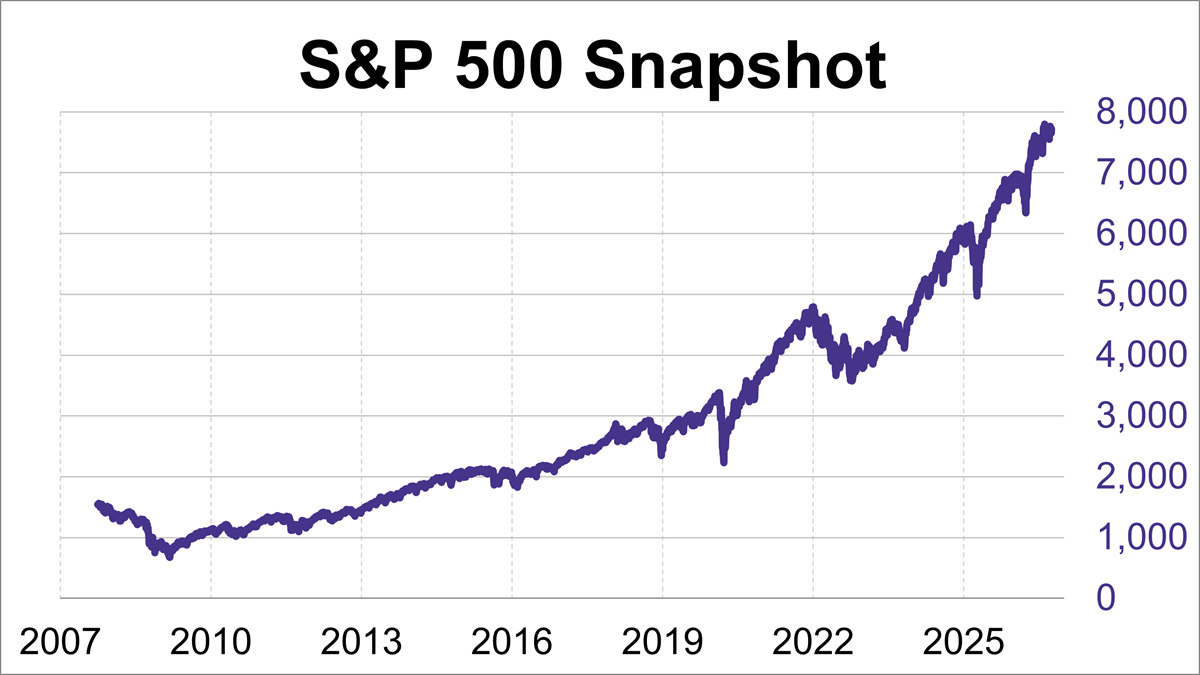
The S&P 500 wrapped up the week with a fractional loss of 0.3%, following a Jobs Friday rally.
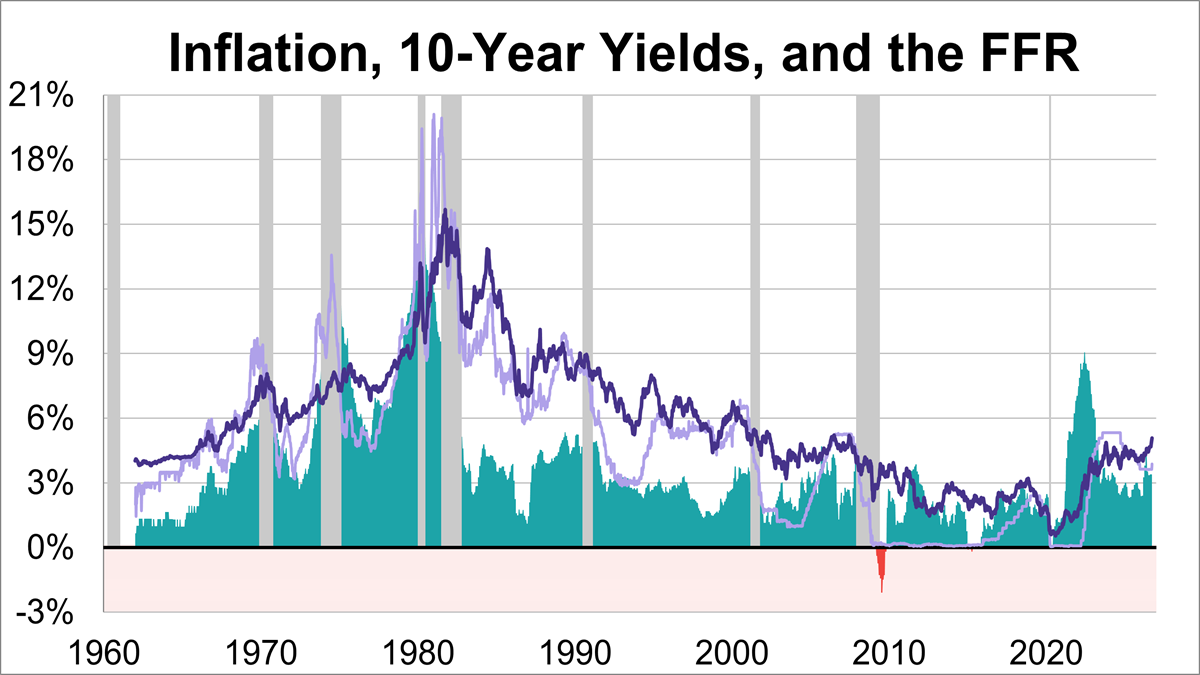
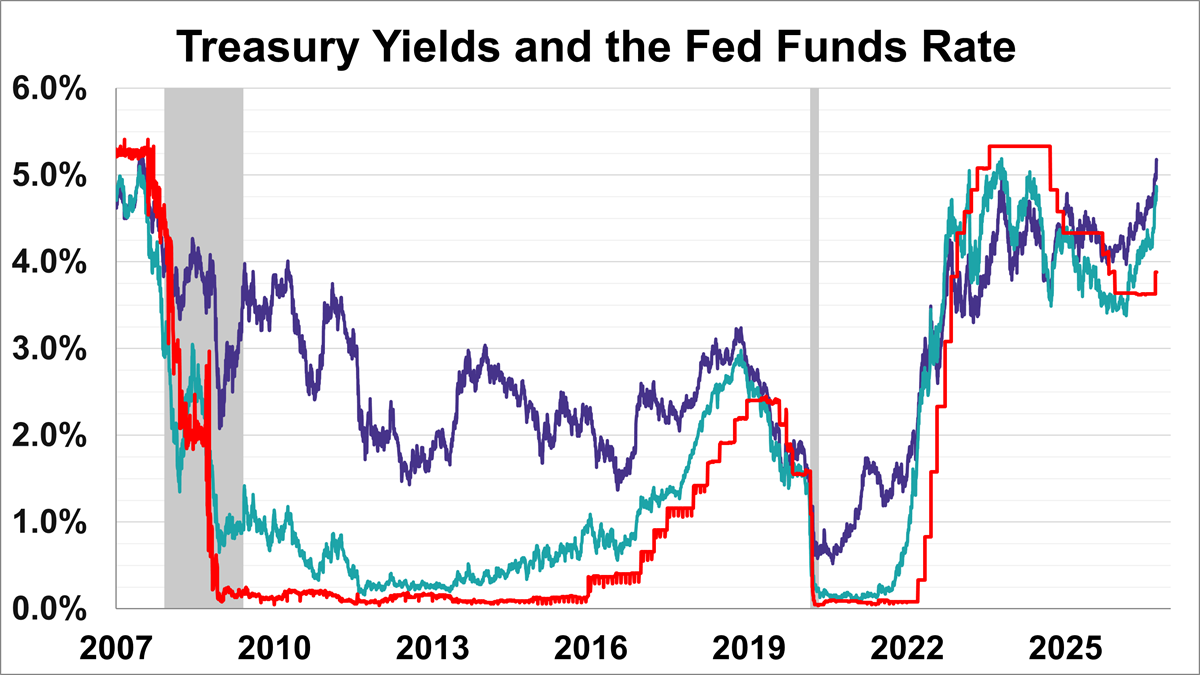
The 10-year Treasury yield has experienced dramatic fluctuations, ranging from a peak of 15.68% in October 1981, during the height of the Volcker era, to a historic low of 0.55% in August 2020, amidst the economic uncertainty of the pandemic. At the end of September 2026, the weekly average stood at 5.08%, the highest level since July 2007.
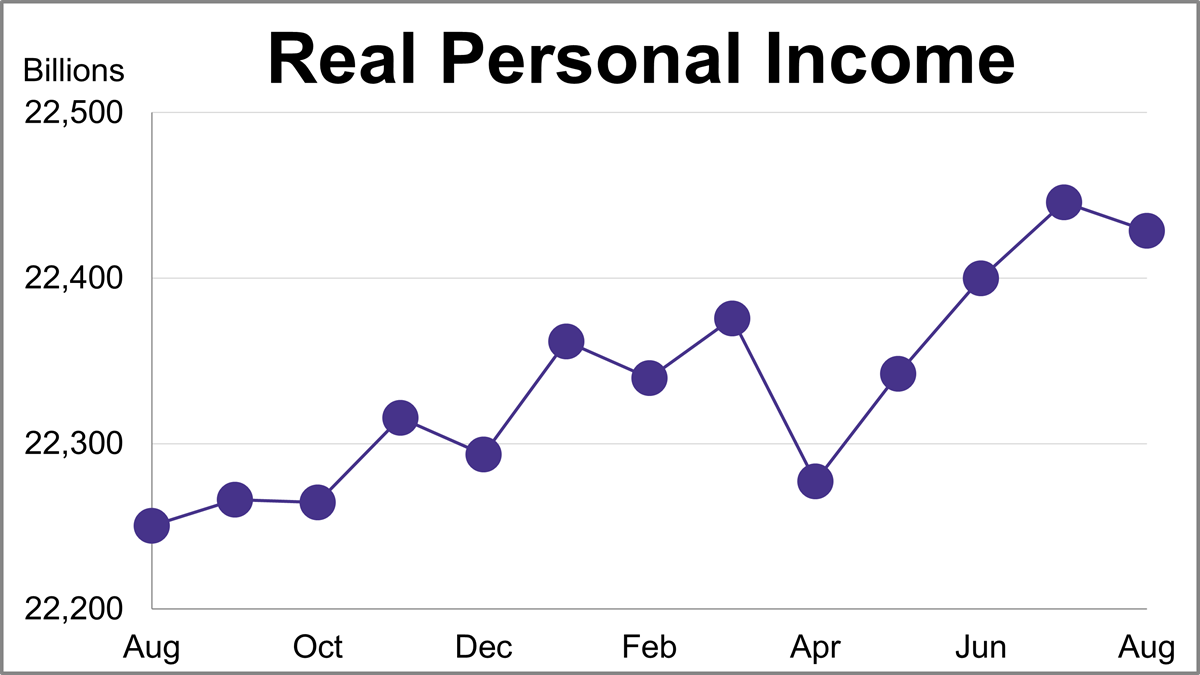
Personal income (excluding transfer receipts) was up 0.23% in August and was up 4.25% year-over-year. However, when adjusted for inflation using the BEA's PCE Price Index, real personal income (excluding transfer receipts) was down 0.08% month-over-month and up 0.80% year-over-year.
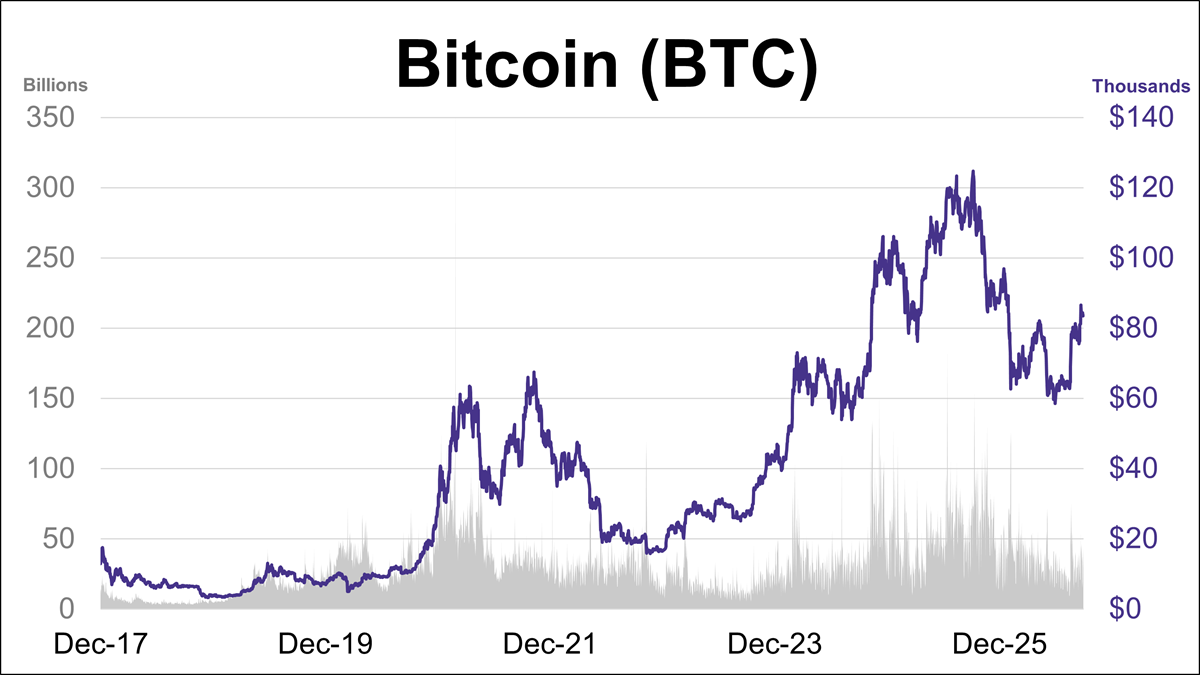
Bitcoin's closing price was down 3.0% this week. BTC is currently down approximately 4% year-to-date and sits about 33% below its October 2025 record high.
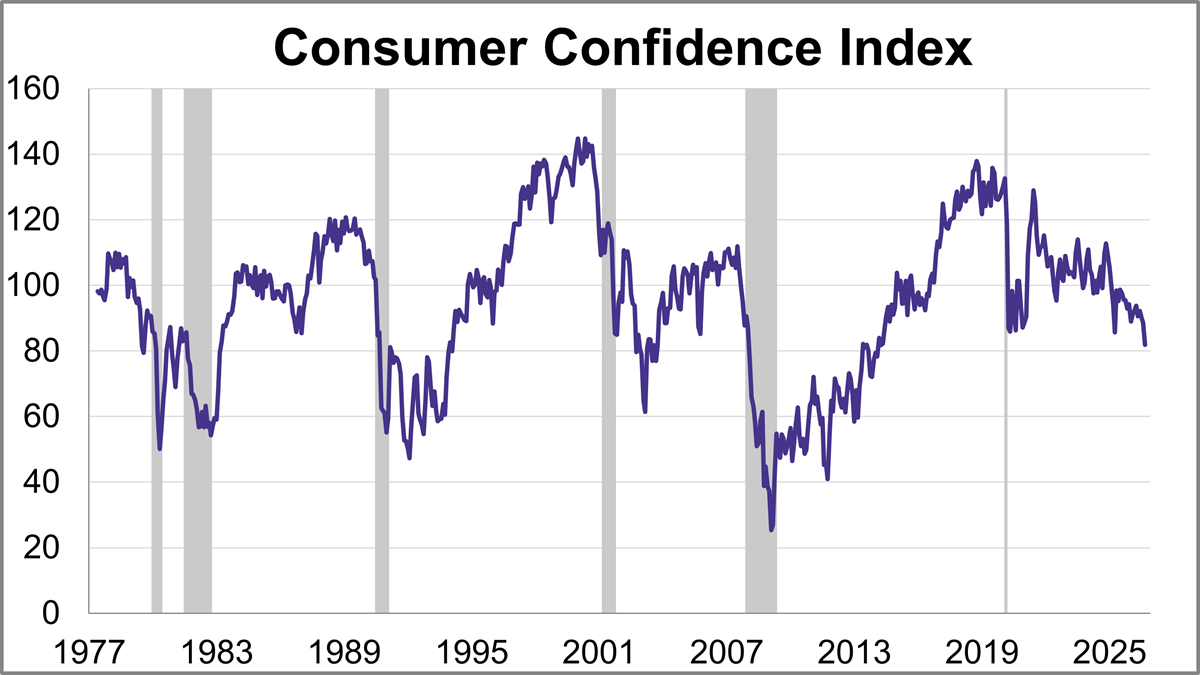
The Conference Board's Consumer Confidence Index® fell significantly more than expected in September, falling 6.7 points to 81.9. The index was far below the forecast of 89.2.
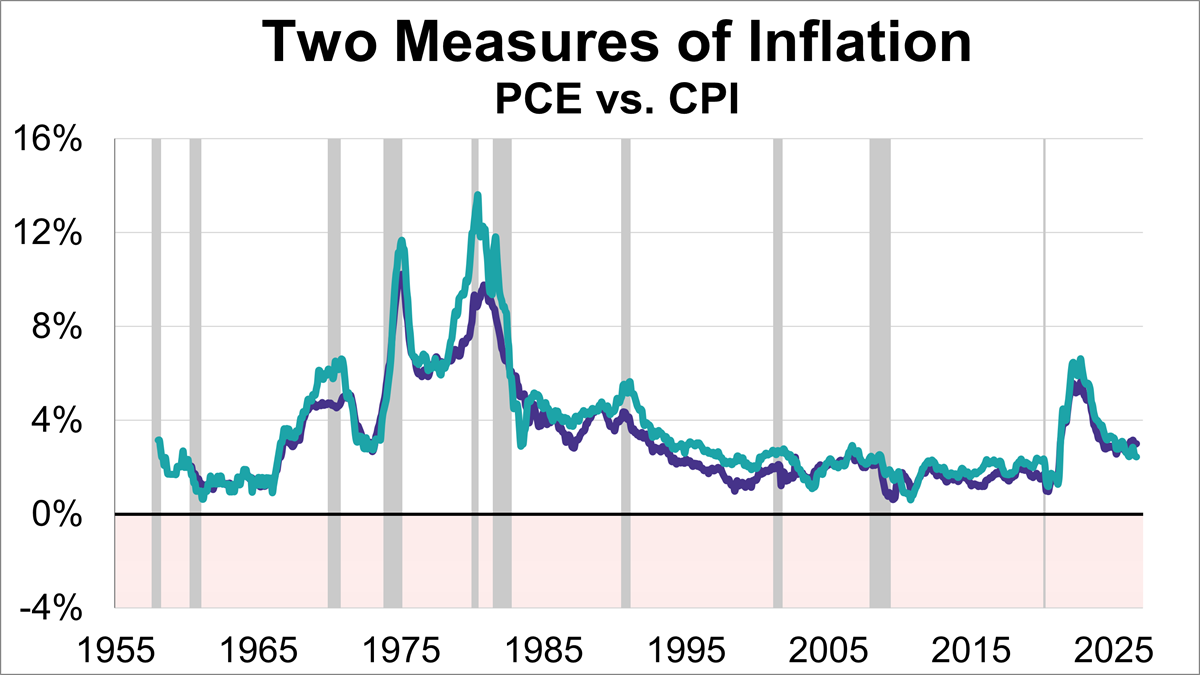
Inflation remains a hot topic, directly impacting everything from your grocery bill to interest rates. As of the latest data, two key inflation gauges — the Personal Consumption Expenditures (PCE) Price Index and the Consumer Price Index (CPI) — show that prices are still above the Federal Reserve's 2% target, with the core PCE at 3% and core CPI at 2.5%.
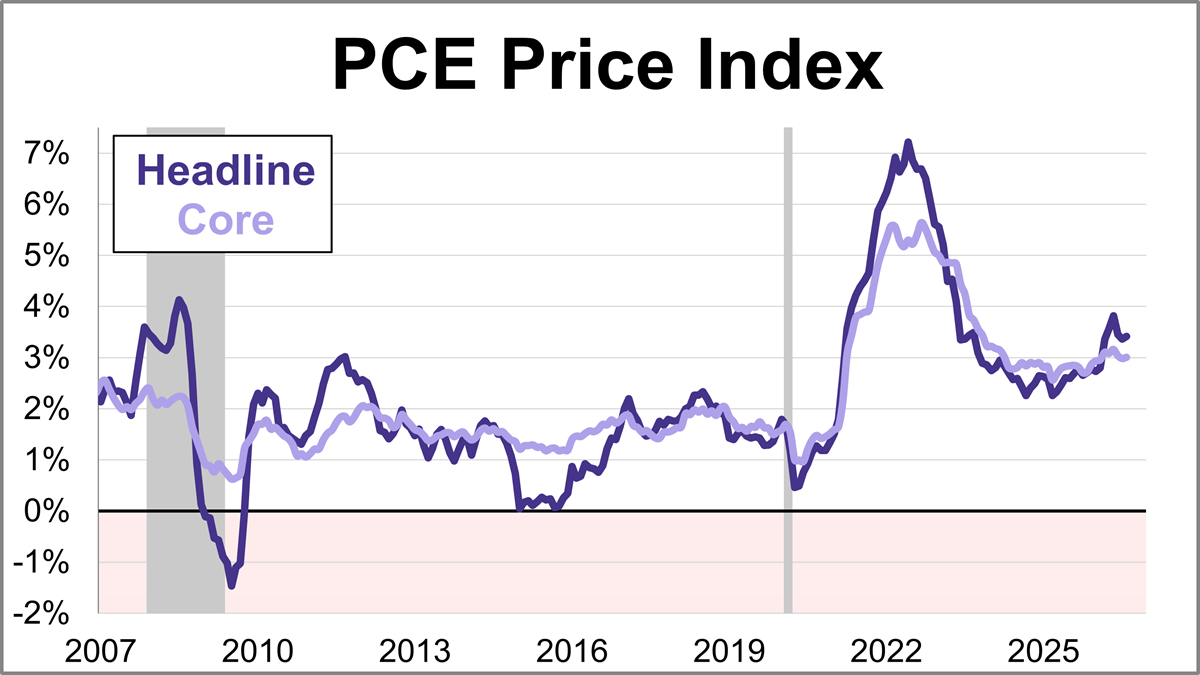
The Federal Reserve’s preferred inflation gauge, the core PCE price index, climbed 3% year-over-year in August. This marks no change from July's reading. On a monthly basis, core prices rose 0.2%.
Valid until the market close on October 31, 2026
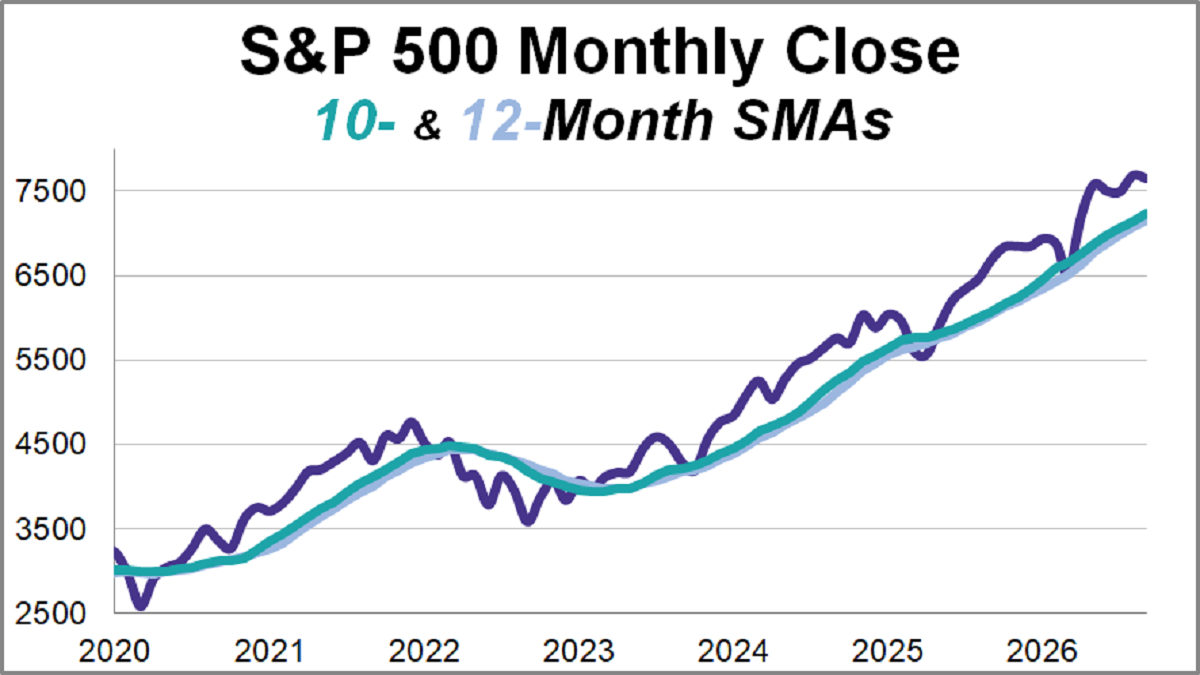
This article provides an update on the monthly moving averages we track for the S&P 500 and the Ivy Portfolio after the close of the last business day of the month.
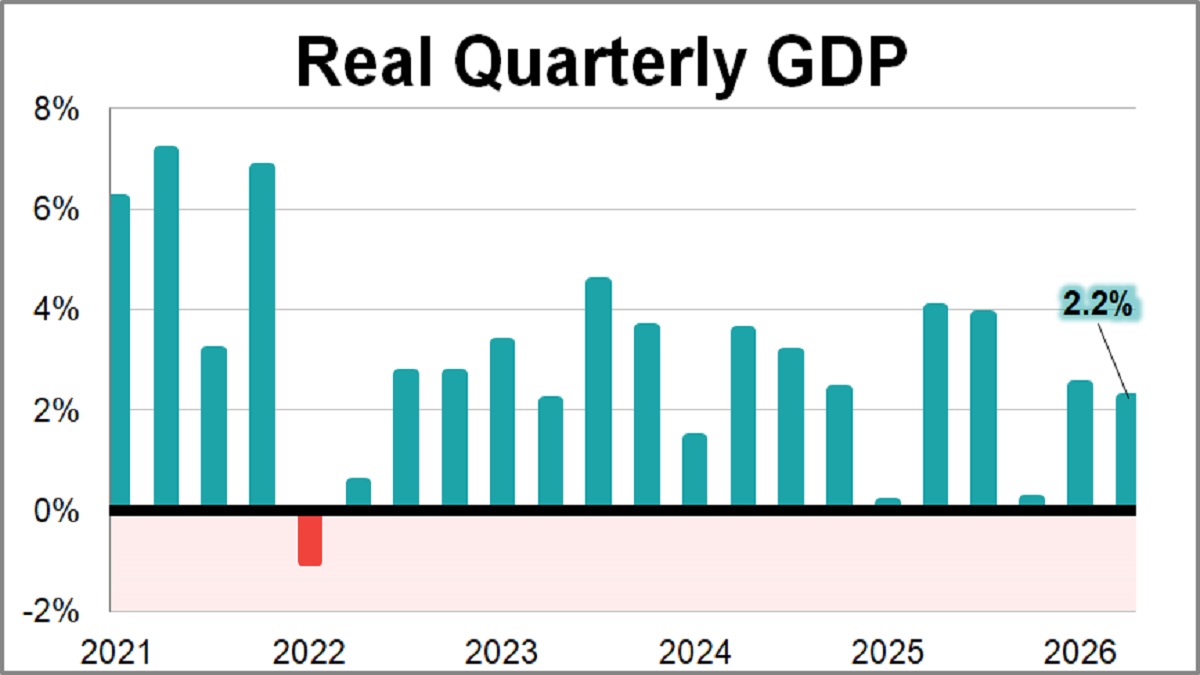
Real GDP rose 2.2% in Q2 for the third estimate from the U.S. Bureau of Economic Analysis, which was a 0.7% increase from the previous Q2 advance and second estimates.
A recent VettaFi webcast explored advice on navigating retirees' behavioral tendencies in decumulating assets in retirement.
"Funflation" is on the rise, and it could bode quite well for the retail sector if the trend remains persistent.
Northern Trust Asset Management will move six mutual funds with $33 billion in assets into ETFs in early 2027, its first such conversions.
Asset owners want private-market exposure, but liquidity remains their biggest hurdle, an opening advisors can meet with public alternatives.
The yield on the 10-year note finished September 25, 2026 at 5.17% while the 2-year note ended at 4.81%.
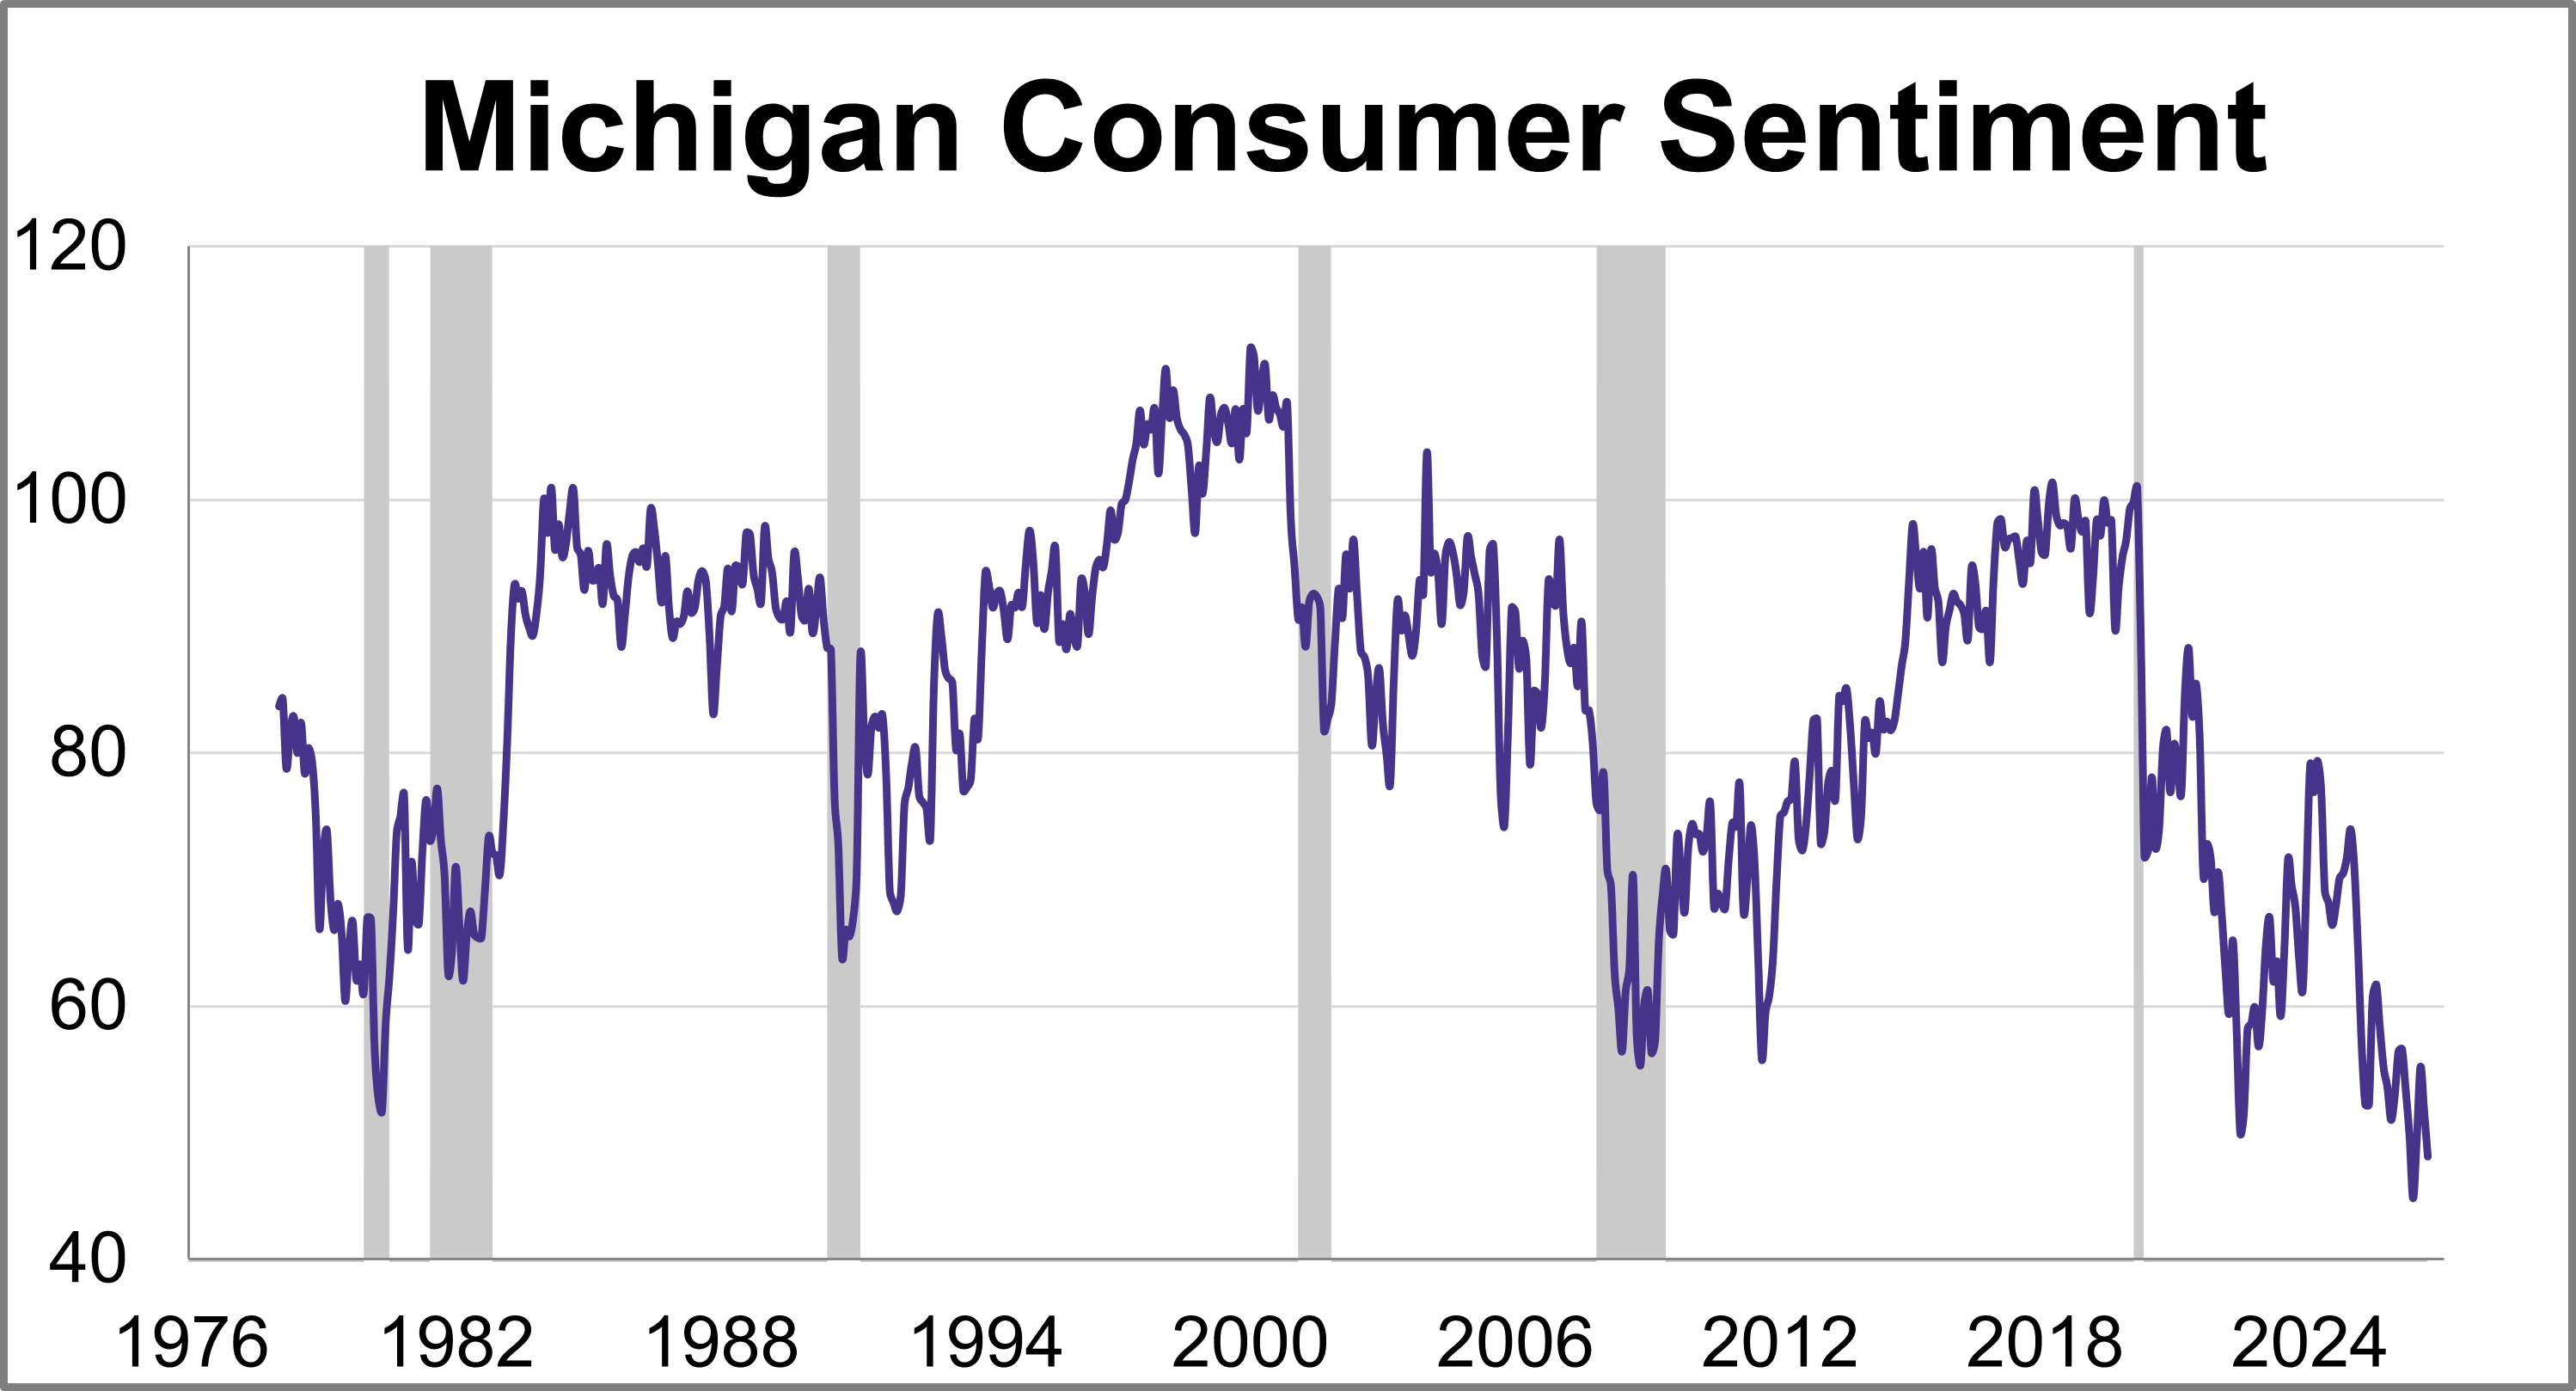
Consumer sentiment falls in September for two consecutive months. The final September reading for the University of Michigan Consumer Sentiment Index came in at 48.1. This marks a 7.0% (3.6 points) decrease from August.
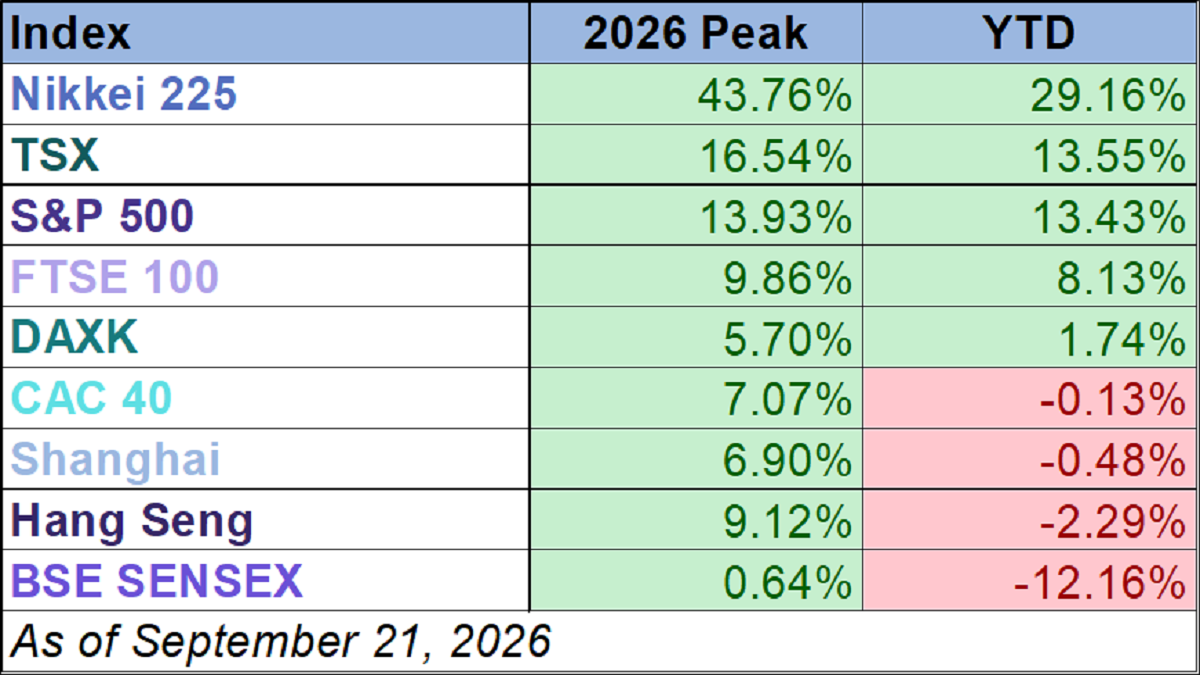
Six of the nine indexes on our world markets watch list posted year-to-date gains through September 21, 2026.
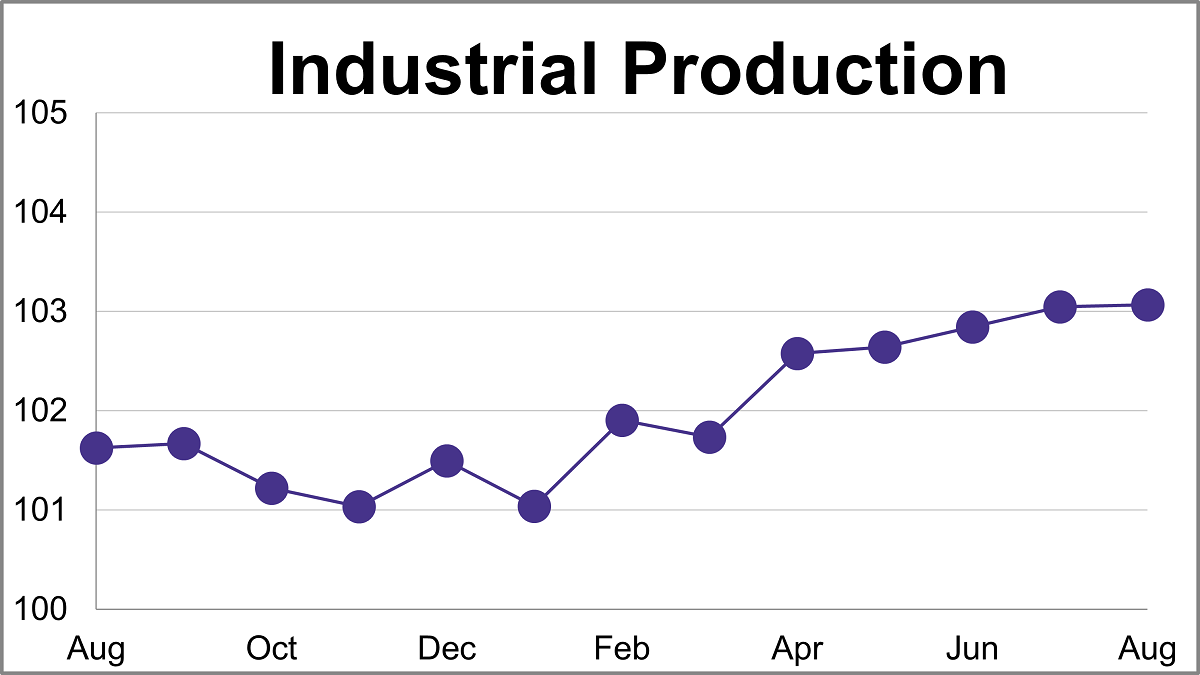
Industrial production grew 0.02% in August after July's 0.2% growth. This was lower than the expected 0.3% growth and marks a 1.4% increase compared to one year ago.
The Federal Reserve increased rates by 25 basis points this week, a remarkable turnaround with major implications for portfolios of all kinds; one underexamined impacted area may be annuities.
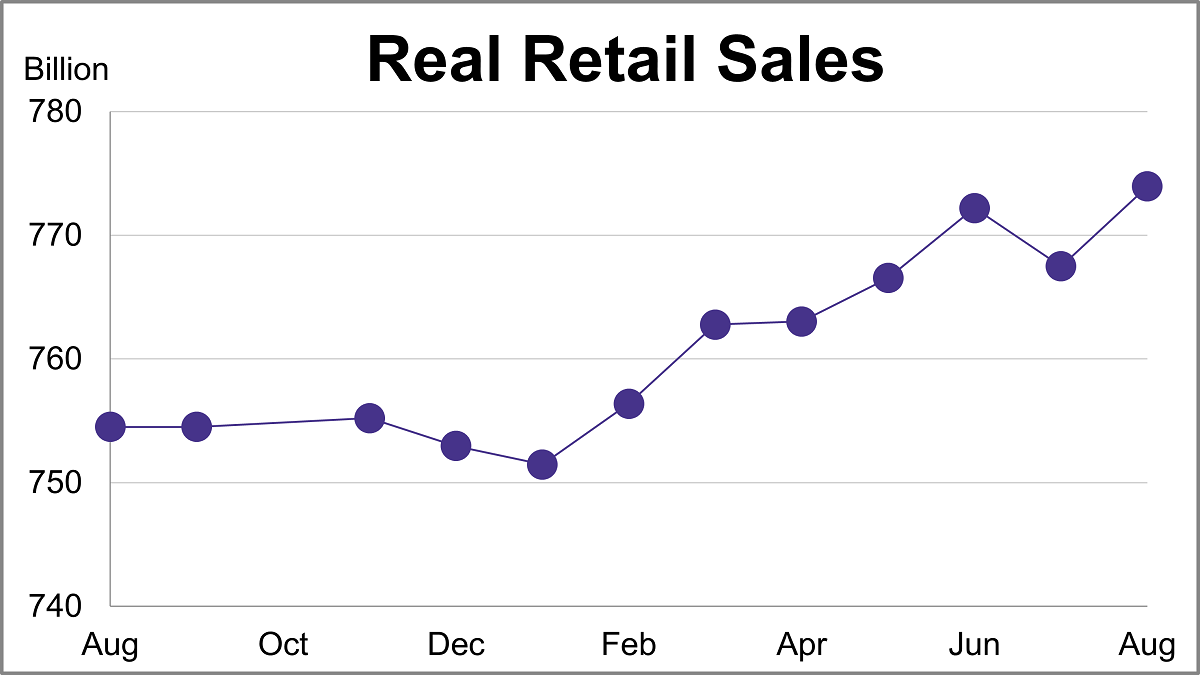
Nominal retail sales were up 1.2% month-over-month and up 6.0% year-over-year in August. After adjusting for inflation, real retail sales were up 0.8% month-over-month and up 2.6% year-over-year.
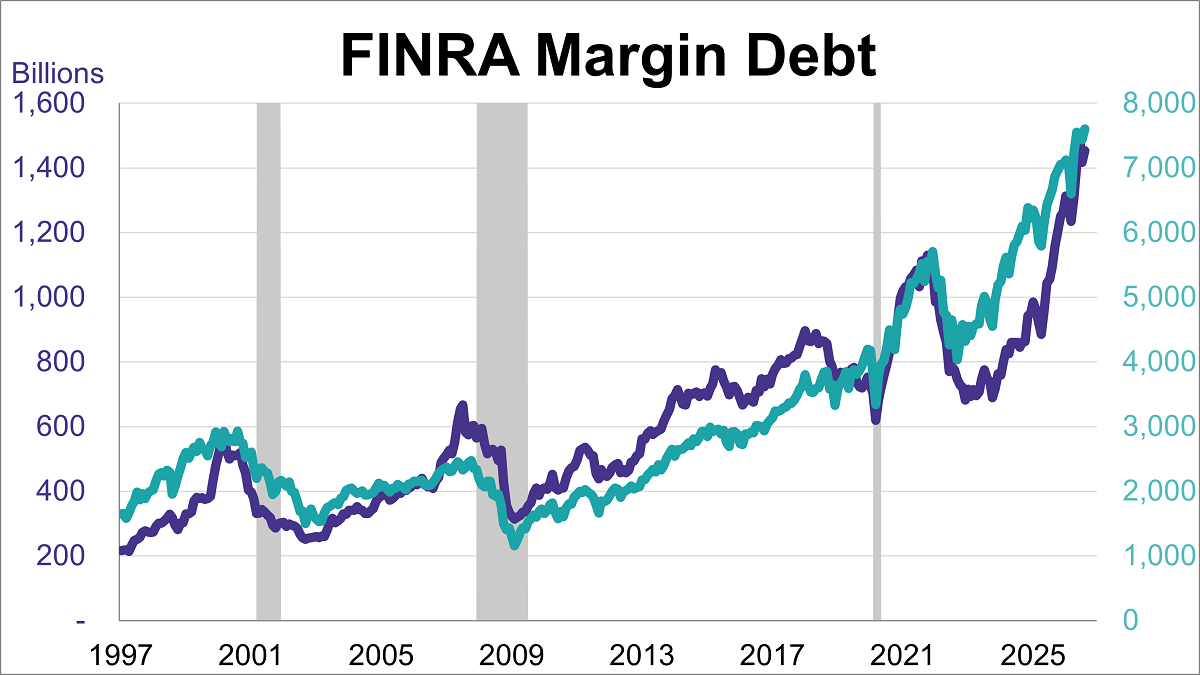
Margin debt increased in August to $1.45 trillion after decreasing last month. This marked a 2.6% increase from July and a 37.2% rise compared to the previous year.
The 2026 U.S. midterms are rapidly approaching, with major implications. Muni bonds, in particular, may be impacted.
Vanguard research challenges four myths about women investors, revealing what female clients value from financial advisors, from expertise to collaboration.
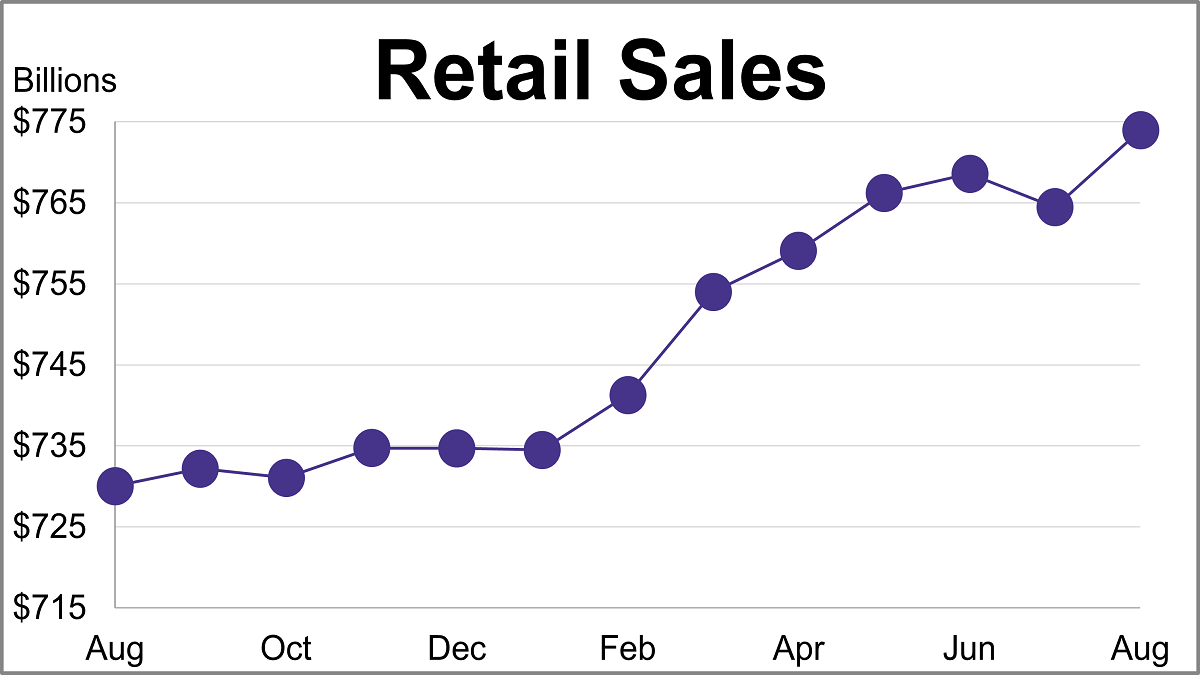
U.S. headline retail sales rebounded in August, up 1.2% to $773.9 in August, while core retail sales increased by 1.4%.
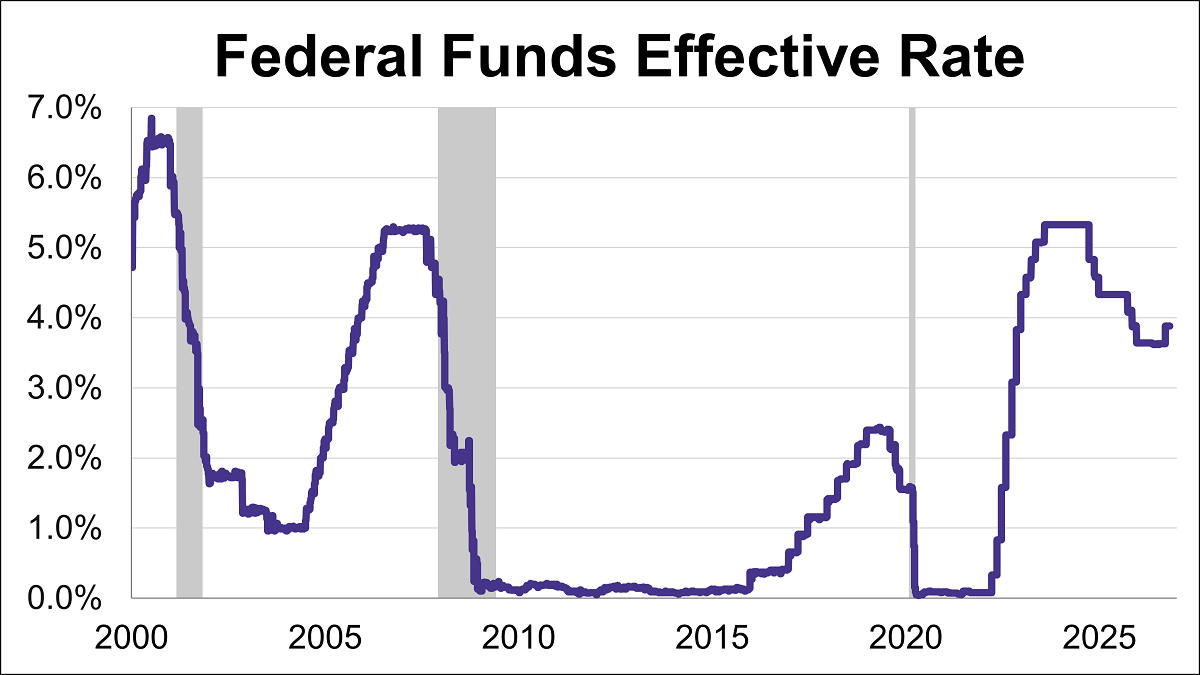
The Federal Reserve concluded its sixth meeting of the year by raising the federal funds rate (FFR) by 25 basis points to a target range of 3.75%-4%.
According to new data from J.P. Morgan Asset Management’s 2026 Defined Contribution Plan Participant Survey, 73% of savers said they wish they could hit an “easy button” and fully delegate their wealth management.
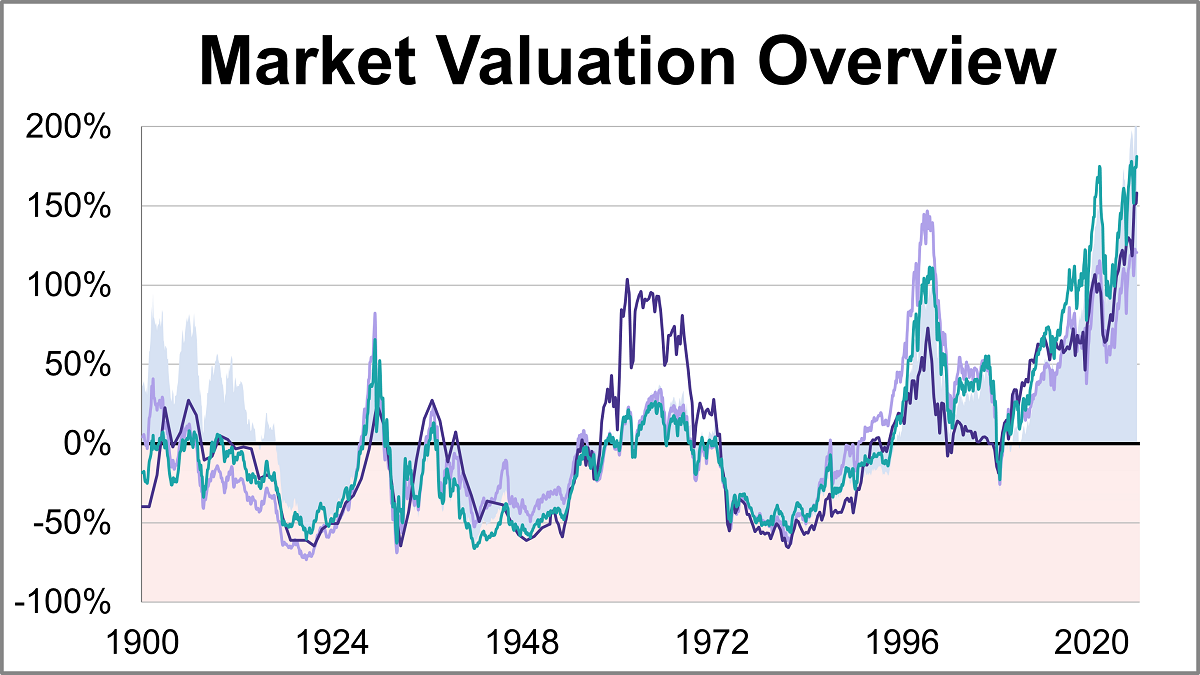
Here is a summary of the four market valuation indicators we update on a monthly basis.
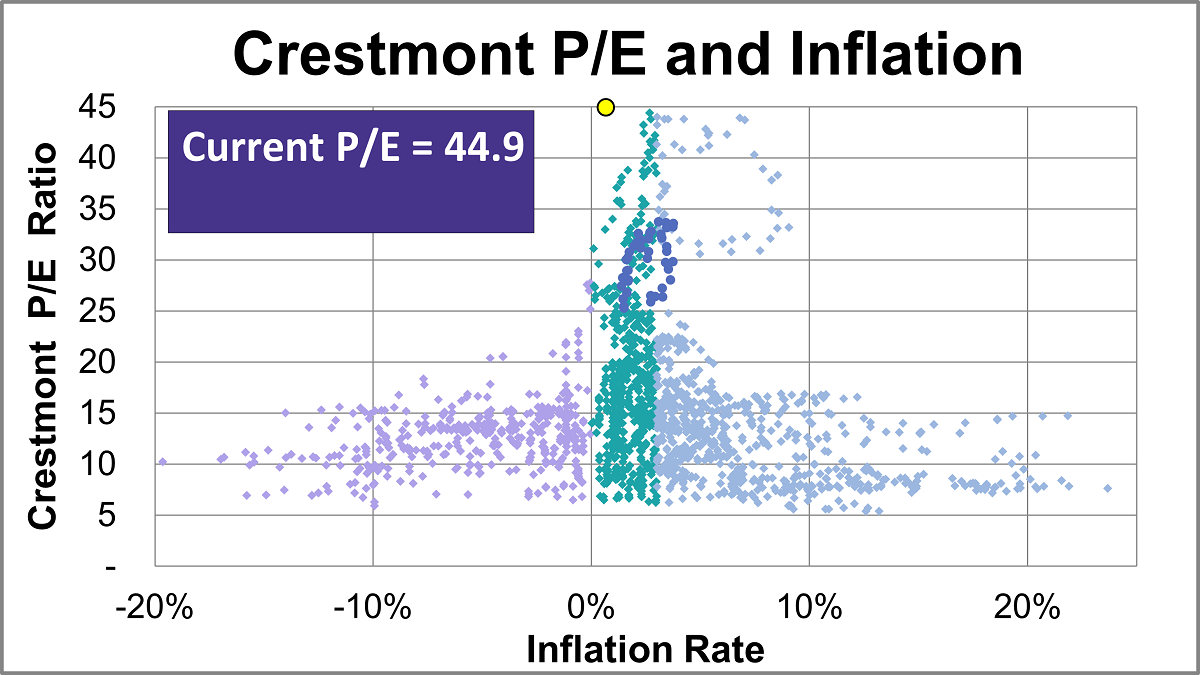
Based on August's S&P 500 average of daily closes, the Crestmont P/E of 44.9 is 191% above its arithmetic mean, 220% above its geometric mean, and is in the 100th percentile of this 14-plus-decade series.
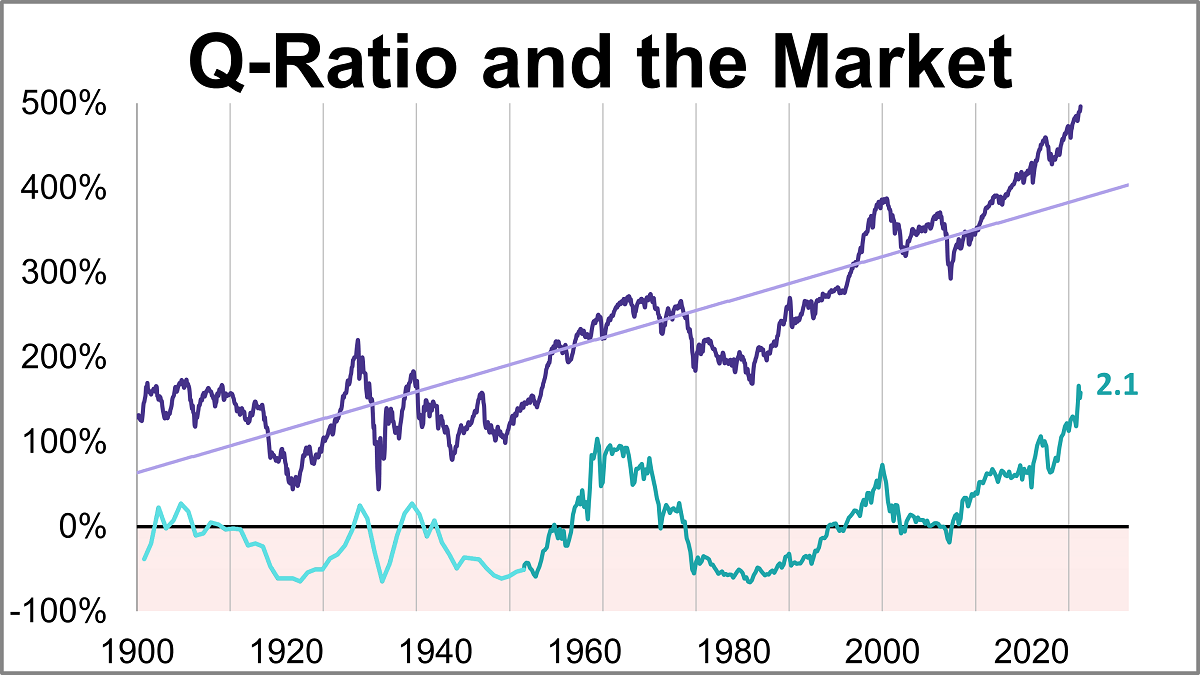
The Q Ratio is the total price of the market divided by the replacement cost of all its companies. As of August 2026, the latest Q-ratio is at 2.12.
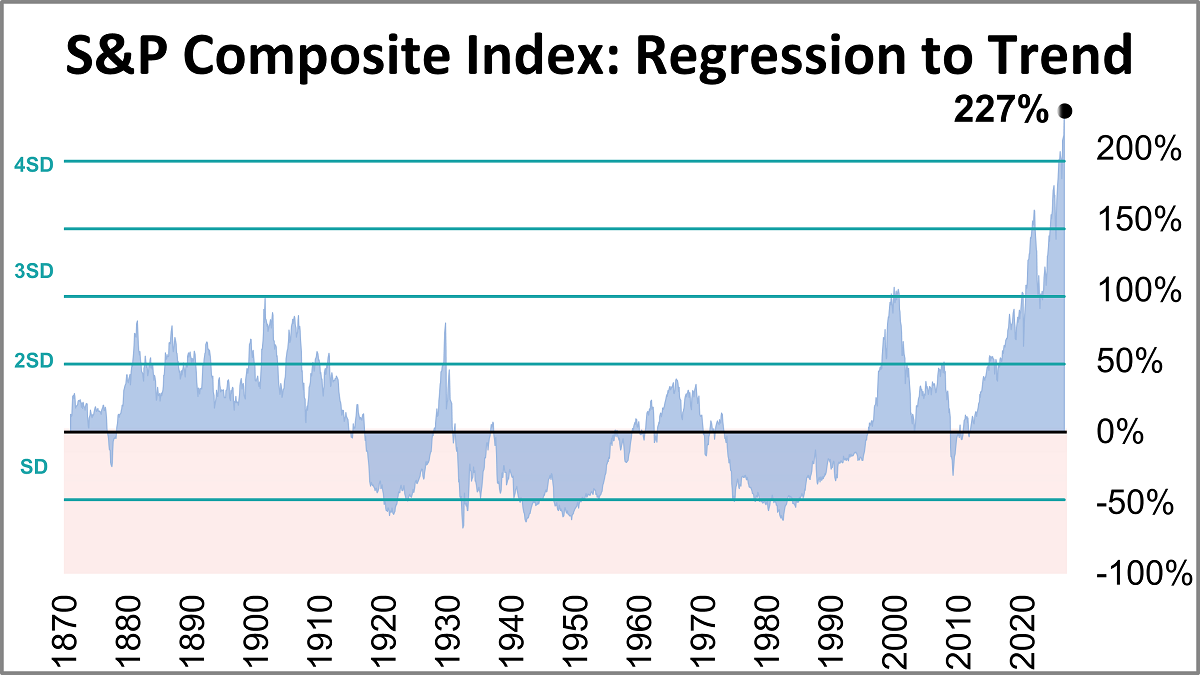
The inflation-adjusted S&P Composite Index was 227% above its long-term trend at the end of August.
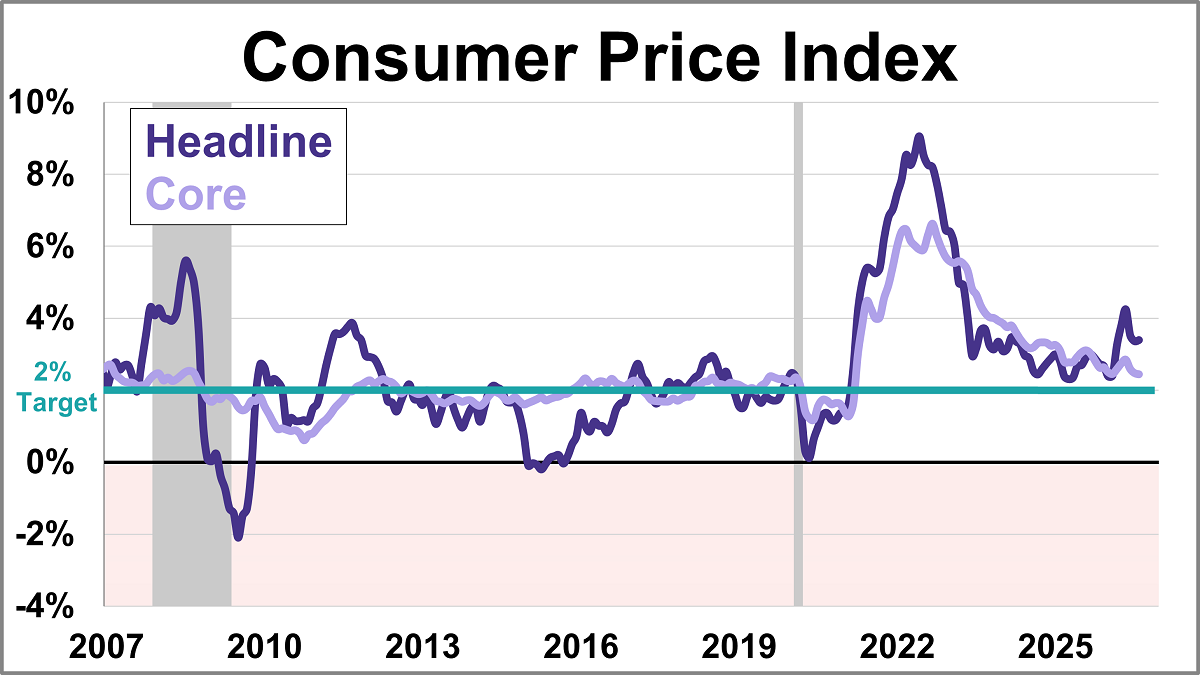
Inflation rose 3.4% year-over-year in August, as it did for the 12 months ending July. The headline figure for the Consumer Price Index (CPI) was in line with economist estimates.
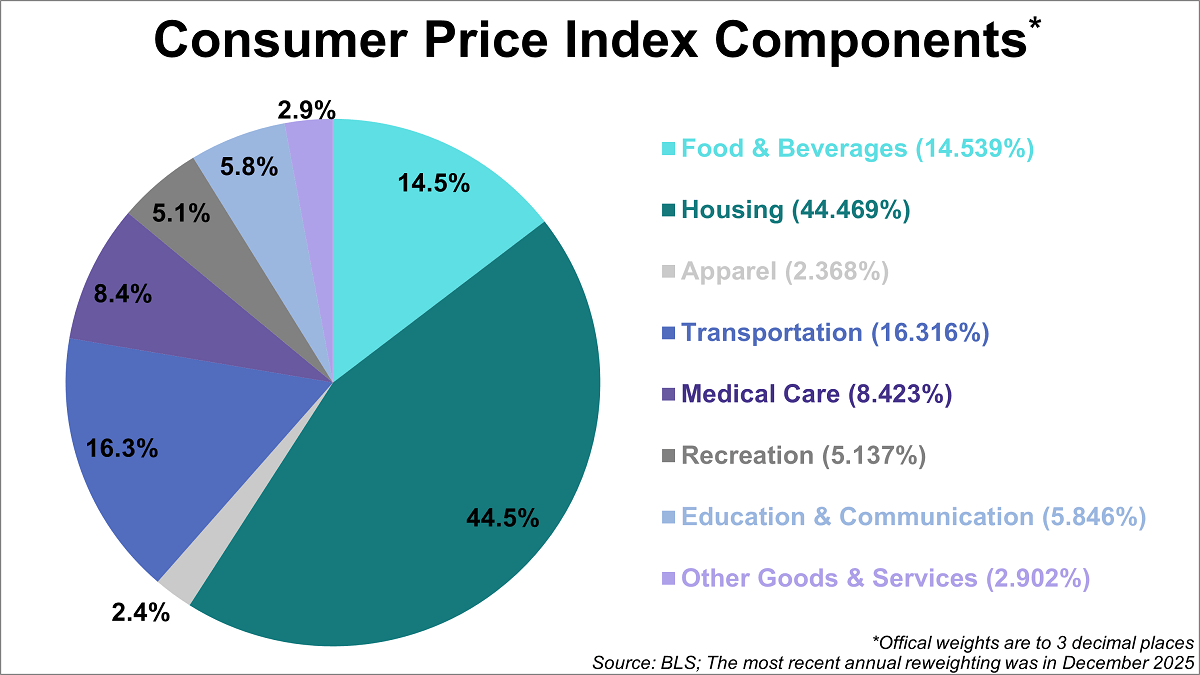
Inflation affects everything from grocery bills to rent, making the Consumer Price Index (CPI) one of the most closely watched economic indicators. The Bureau of Labor Statistics (BLS) tracks this by categorizing spending into eight categories, each weighted by its relative importance.
The U.S. Energy Information Administration (EIA) has released its latest Short-Term Energy Outlook (STEO), providing forecasts for energy markets. This article presents the annual production outlooks for crude oil, natural gas, and natural gas liquids (NGLs), comparing the September 2026 projections against the previous month's estimates.
The Producer Price Index (PPI) was up 0.4% in August, better than expectations.
Cerulli projects a $2 trillion surge in advisor-held alternatives over five years, as interval funds reshape how RIAs access private markets.
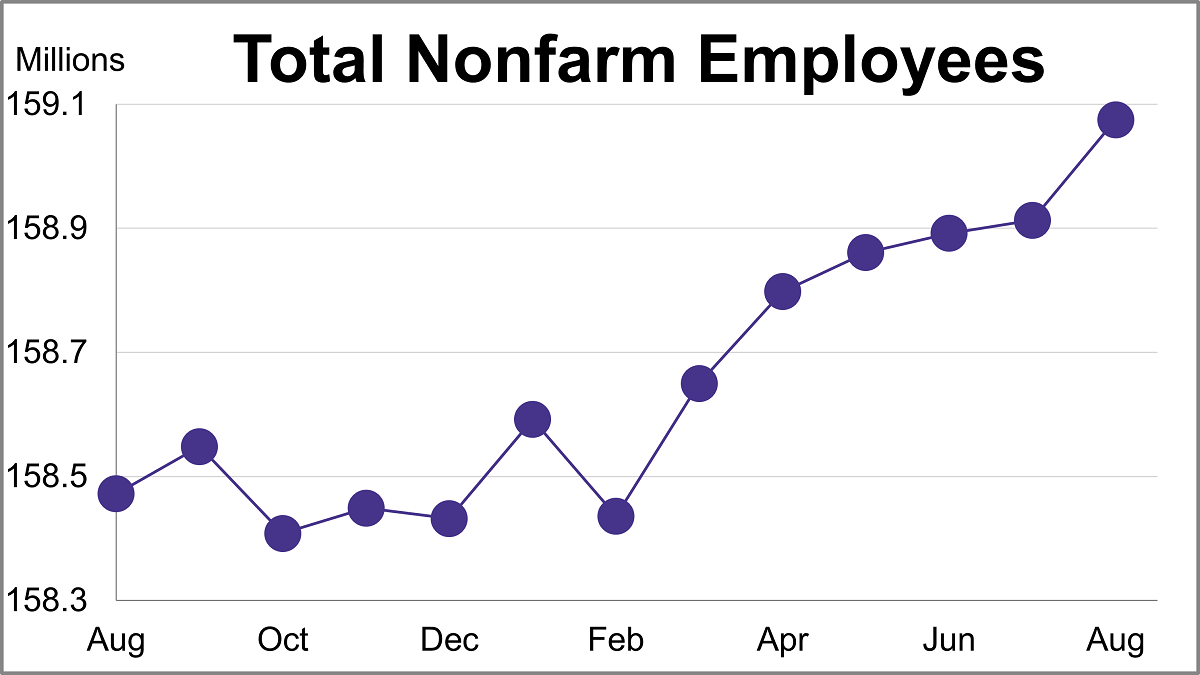
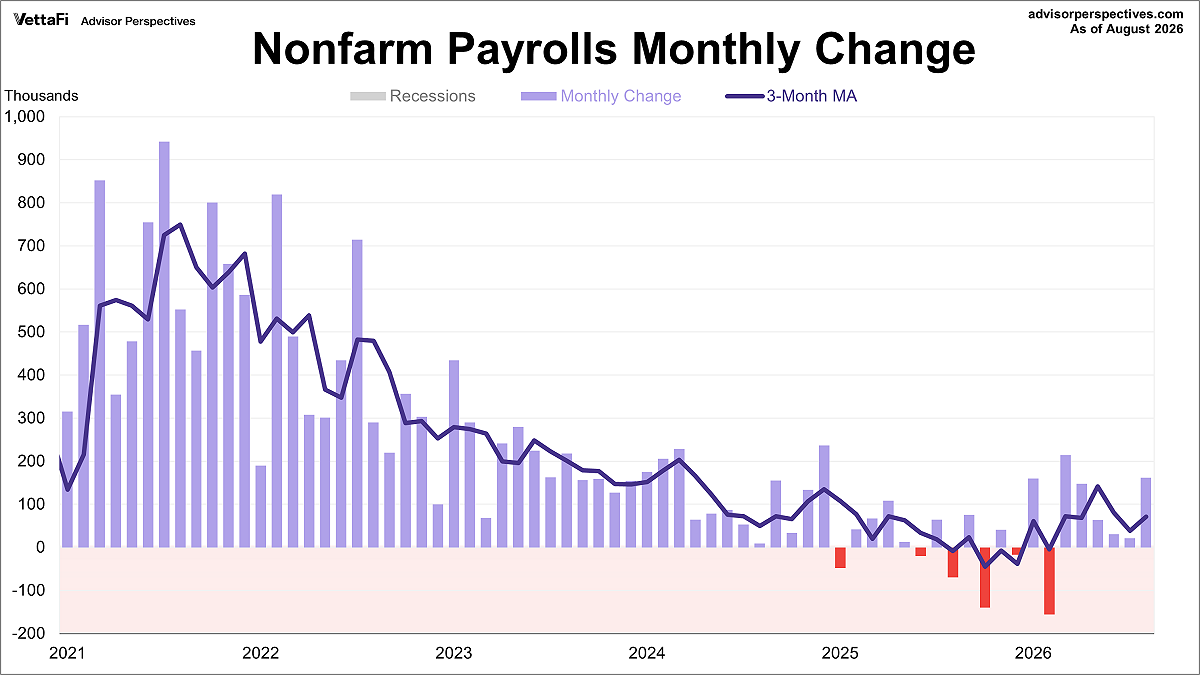
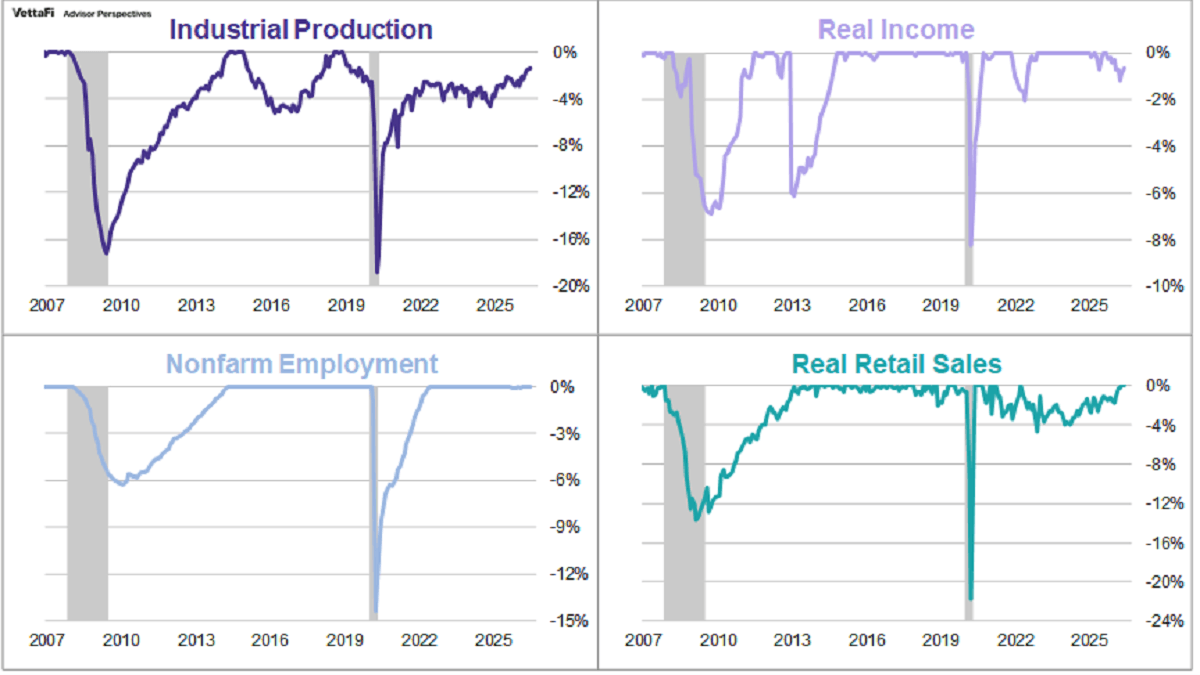
There is a general belief that there are four big indicators that the NBER Business Cycle Dating Committee weighs heavily in their cycle identification process. This commentary focuses on one of these indicators: nonfarm employment. In August, total nonfarm payrolls increased by 162,000 while the unemployment rate remained unchanged at 4.1%
The latest employment report showed that 162,000 jobs were added in August, compared to July's 21,000 gain. This figure was significantly higher than the projected addition of 55,000 jobs. Meanwhile, the unemployment rate was unchanged at 4.1%.
Artificial intelligence is quickly becoming a bigger part of financial advisors’ workflows, but the technology is still in the early stages of adoption. LPL Financial experts share how agentic AI can help advisors with workflows
FactSet finds core clients still favor cheap funds, while active ETF buyers pay a premium for performance, a trade-off advisors should watch.
There are routes towards adding innovation exposure in portfolios without going overboard on the biggest names. The ETF ecosystem has provided for significant innovation in investment strategies in recent years.
Here are three tips for young investors setting out to build wealth but not sure where to start.
Official recession calls are the responsibility of the NBER Business Cycle Dating Committee, which is understandably vague about the specific indicators on which they base their decisions. There is, however, a general belief that there are four big indicators that the committee weighs heavily in their cycle identification process.
Discover why higher Treasury yields, strong ETF demand, and active management are creating new opportunities in muni bonds for advisors.
Given the current state of inflation and interest rates, it’s probable that many advisors and investors are considering alternative ways of fostering income within their portfolios.
High-net-worth investors and institutional managers continue to allocate heavily to muni bond ETFs to lock in attractive yields.
State Street's July Flash Flows report highlights record ETF inflows, and a major rotation into value and dividend strategies.
Learn what Trump Accounts for advisors mean for financial planning, including contribution rules, employer funding, 529comparisons, and ETFs.
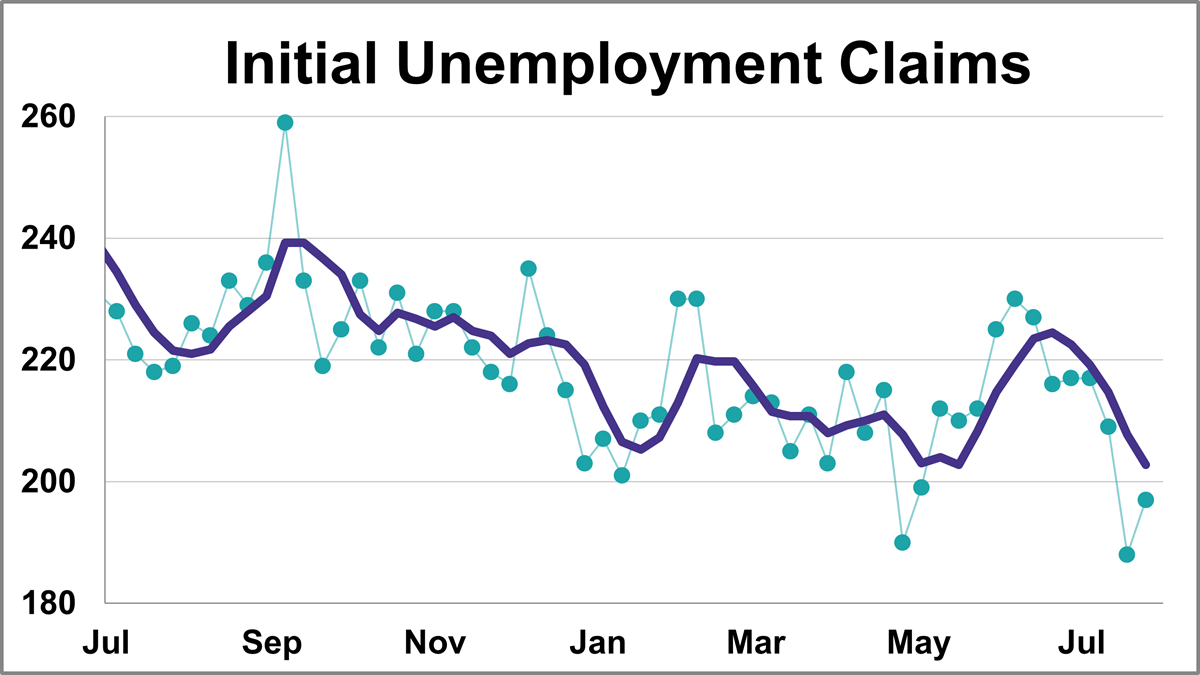
In the week ending July 25th, initial jobless claims were at a seasonally adjusted level of 197,000. This represents an increase of 9,000 from the previous week's figure and was lower than the forecast of 201,000.
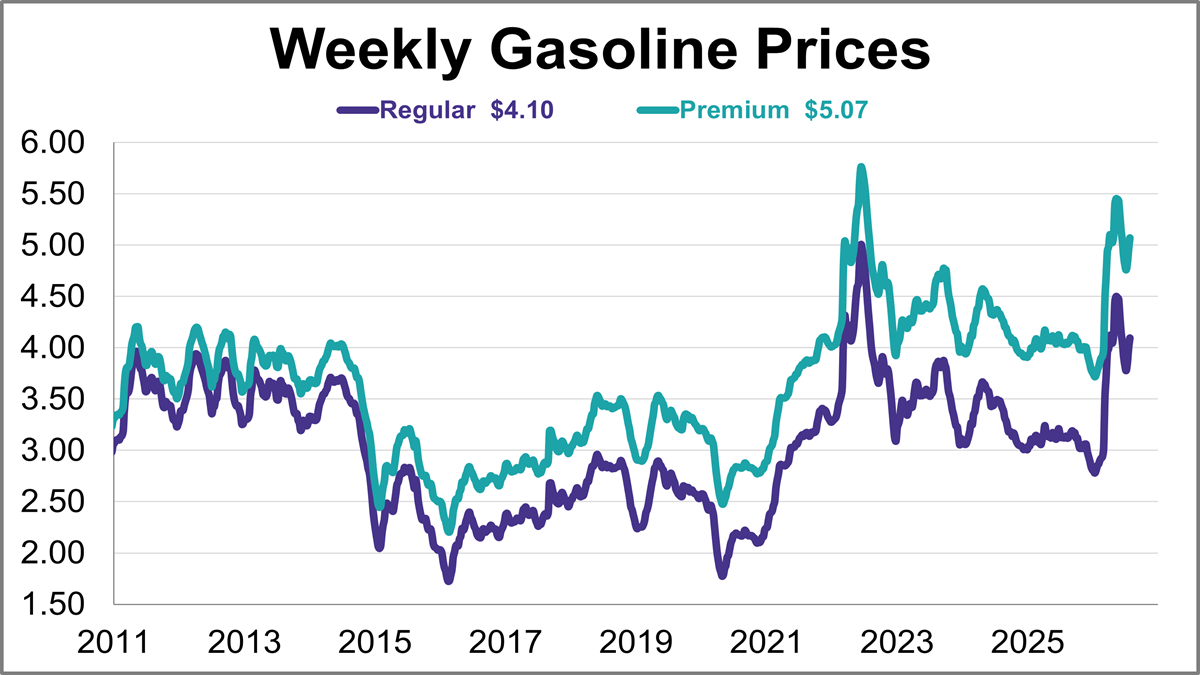
Gasoline prices jumped for a third straight week, reaching their highest level in almost two months.
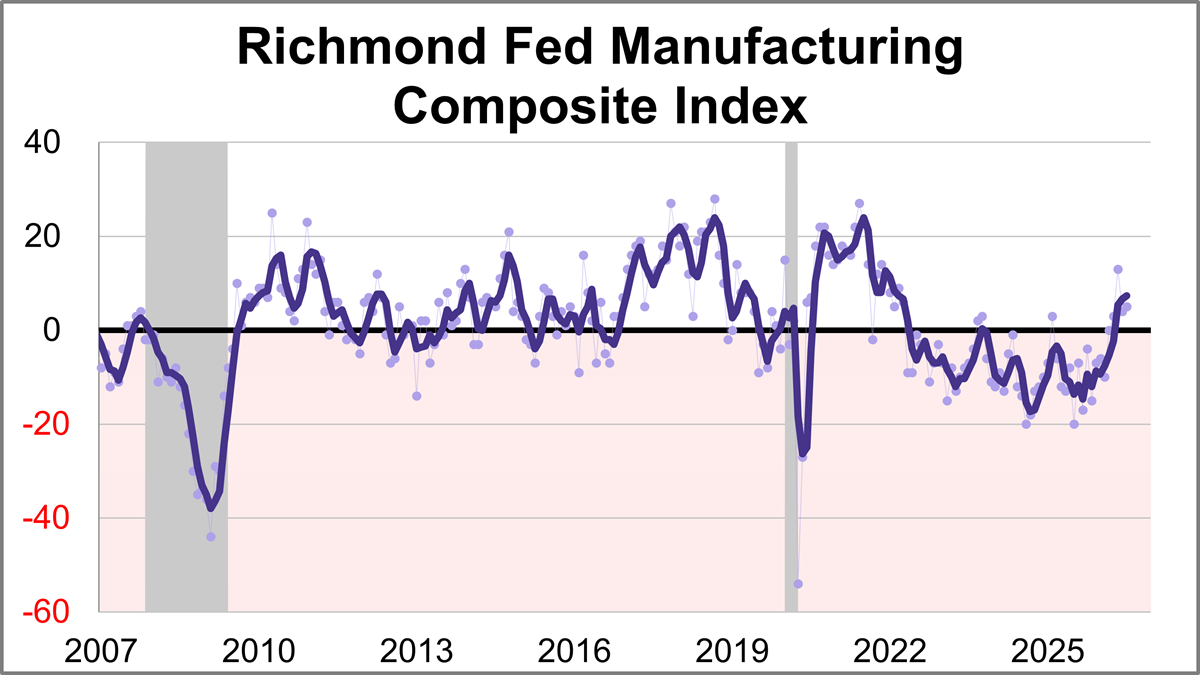
Fifth district manufacturing activity was mostly flat in July, according to the most recent survey from the Federal Reserve Bank of Richmond. The composite manufacturing index inched up one point to 5, marking the fourth consecutive positive reading.
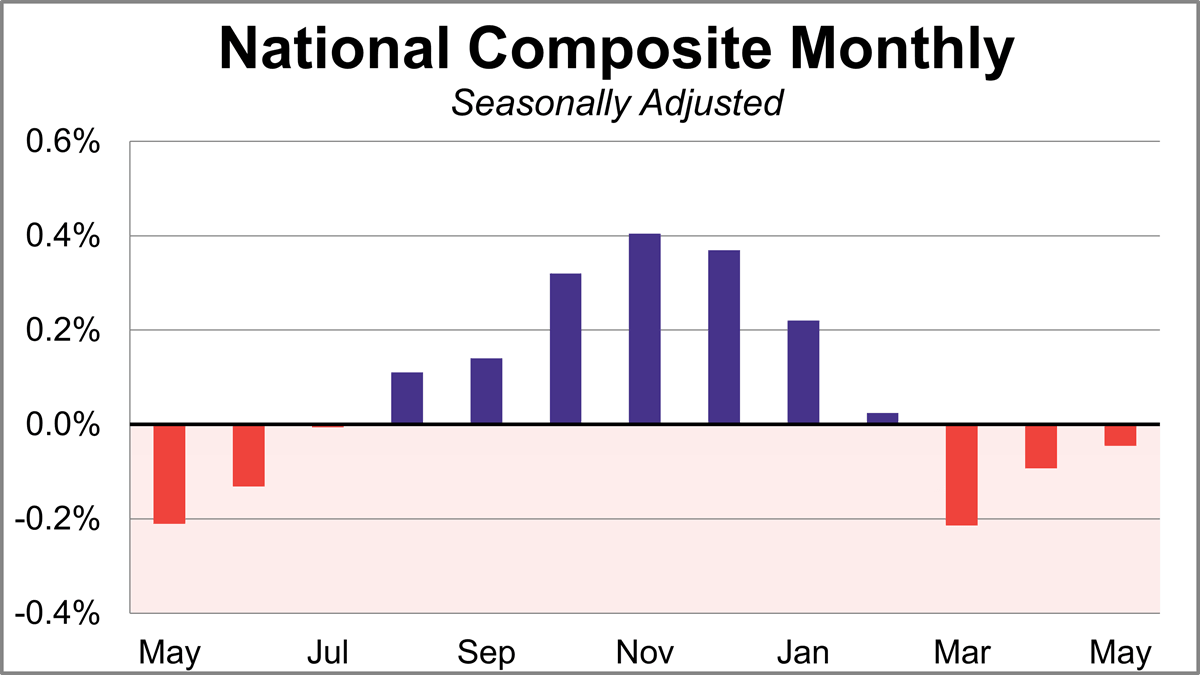
Home prices fell for a third straight month in May according to the S&P Cotality Case-Shiller index, as the housing slowdown continues. On a seasonally adjusted basis, the national index was essentially flat month-over-month and was up 1.1% year-over-year.