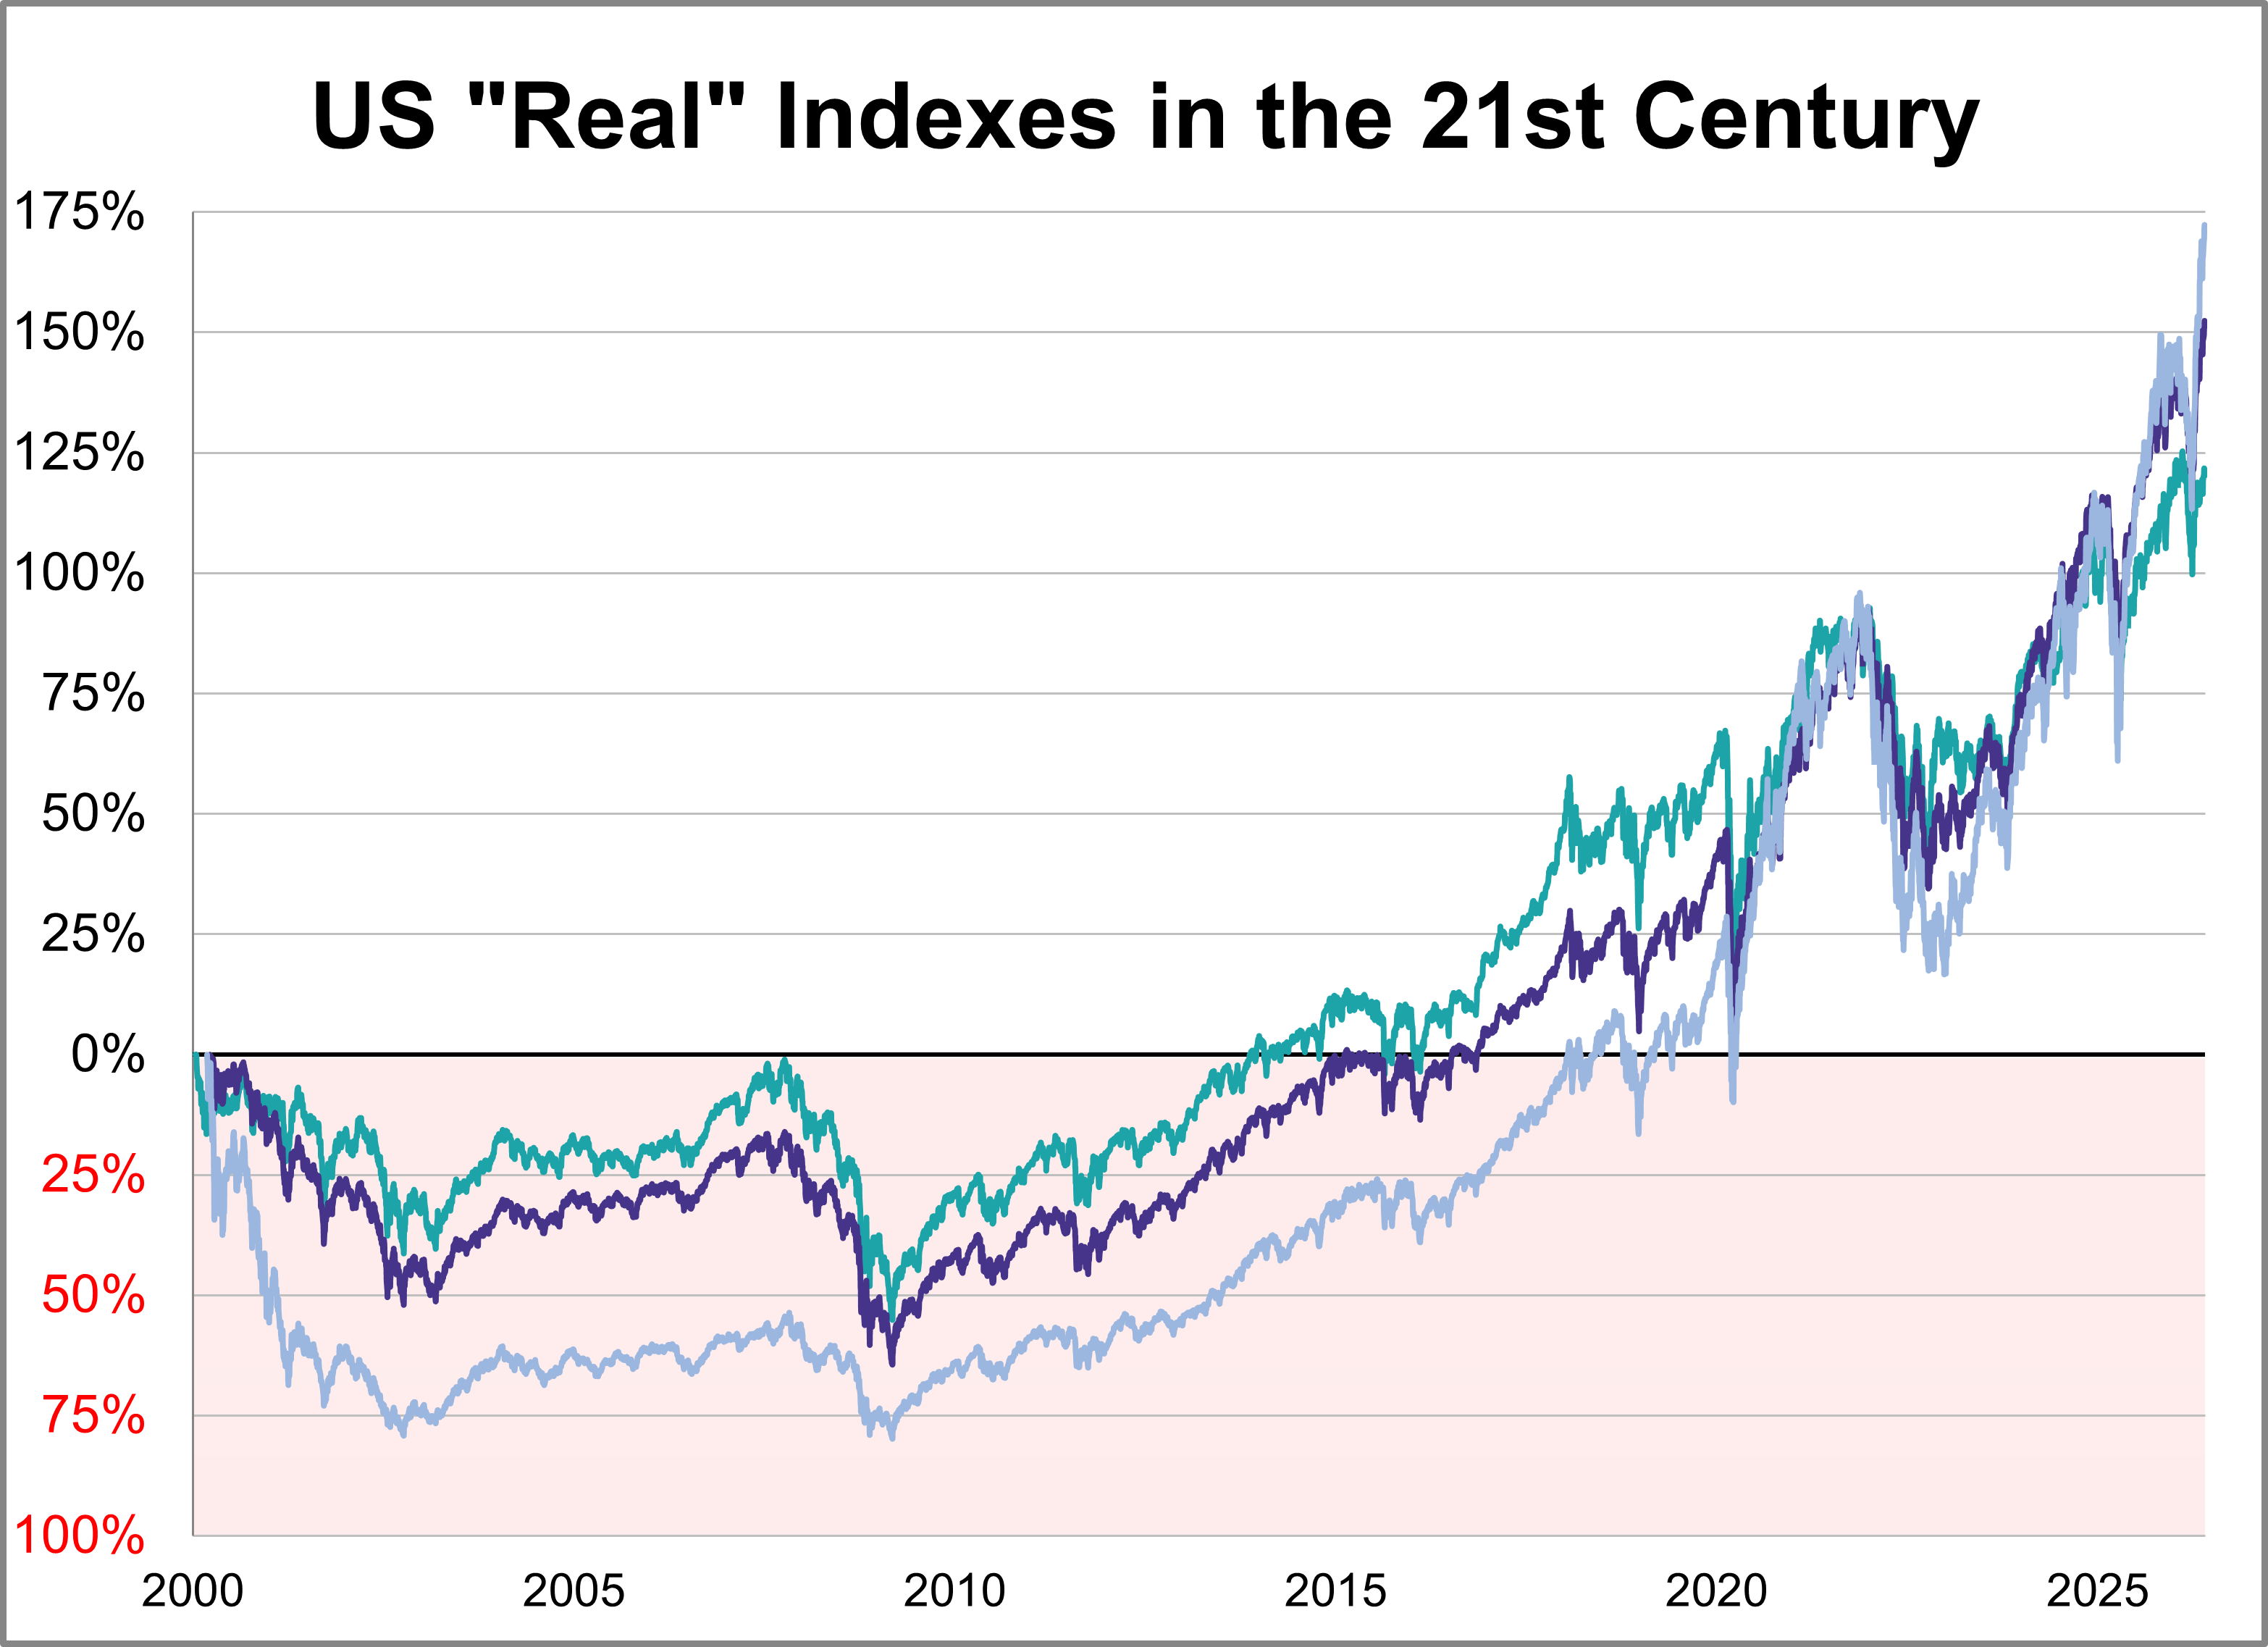
Here is a look at real (inflation-adjusted) charts of the S&P 500, Dow 30, and Nasdaq composite since their 2000 highs. We've updated this through the May 2026 close.
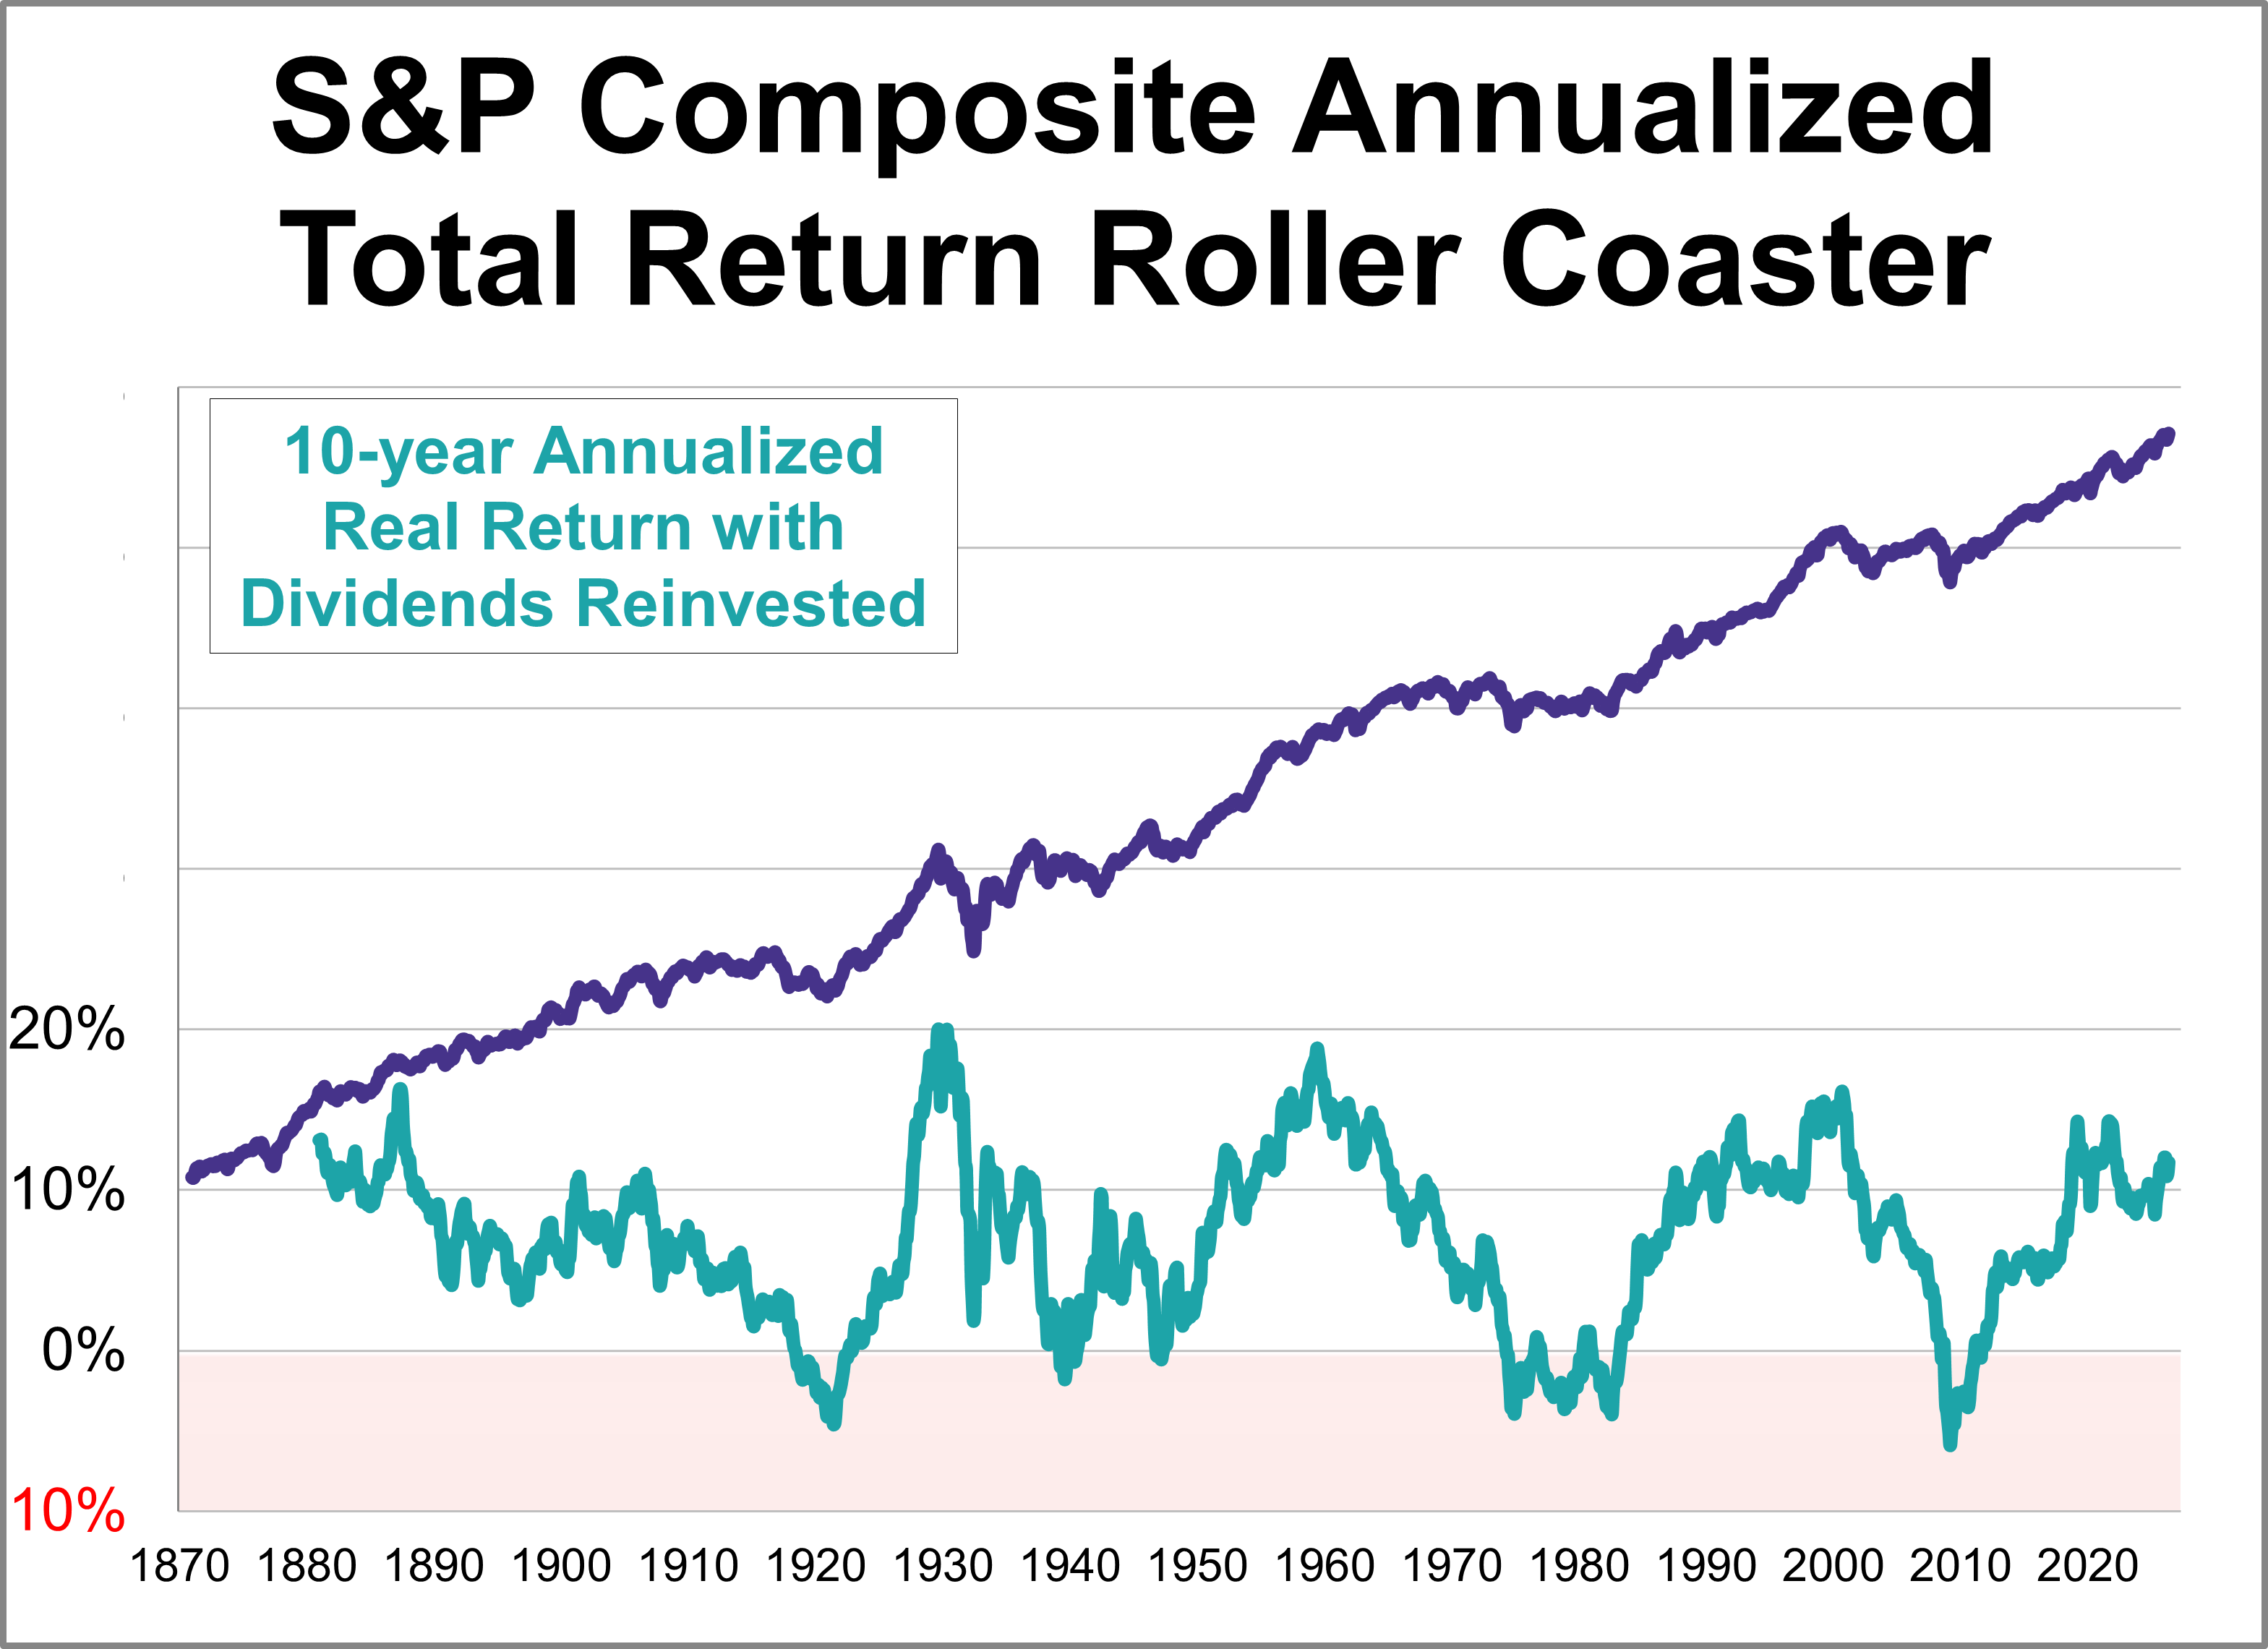
Here's an interesting set of charts that will especially resonate with those of us who follow economic and market cycles. Imagine that five years ago you invested $10,000 in the S&P 500. How much would it be worth today, with dividends reinvested but adjusted for inflation?
The S&P 500 real monthly averages of daily closes reached a its all-time high in May 2026. Let's examine the past to broaden our understanding of the range of historical bull and bear market trends in market performance.
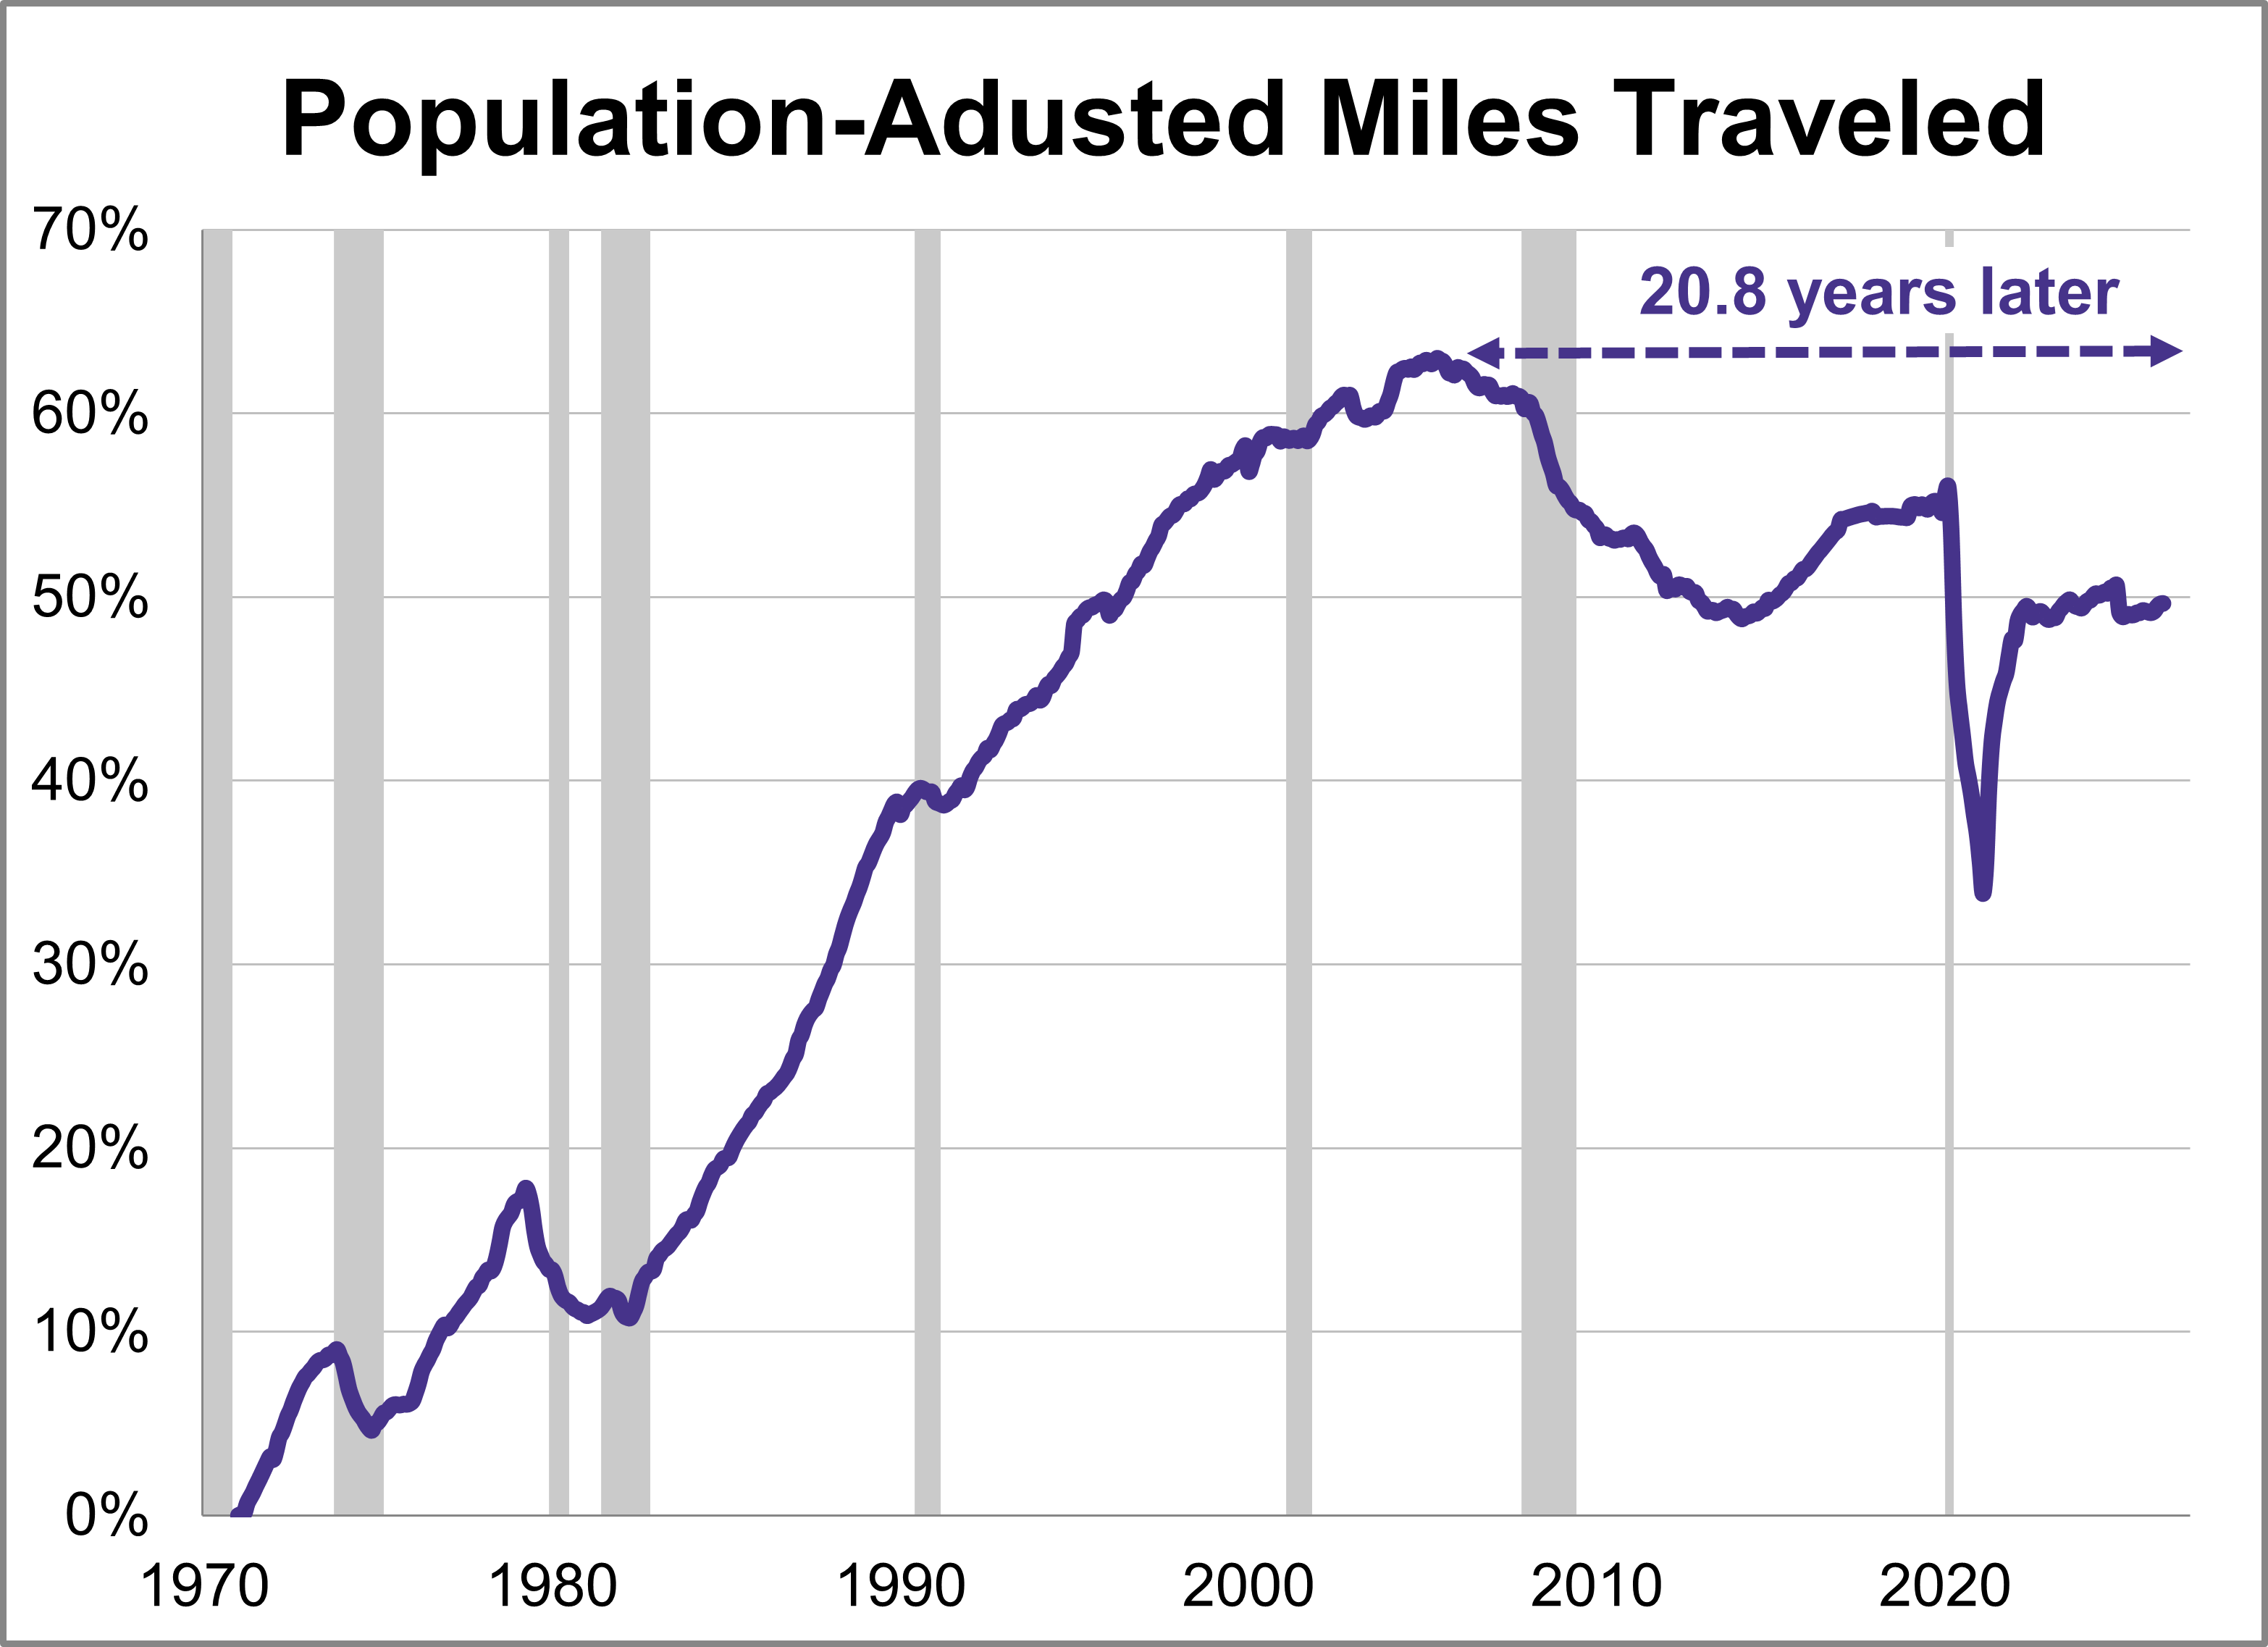
Travel on all roads and streets increased in April. The 12-month moving average was up 0.05% month-over-month and was up 1.04% year-over-year. However, if we factor in population growth, the 12-month MA of the civilian population-adjusted data (age 16-and-over) was up 0.02% month-over-month and up 0.40% year-over-year.
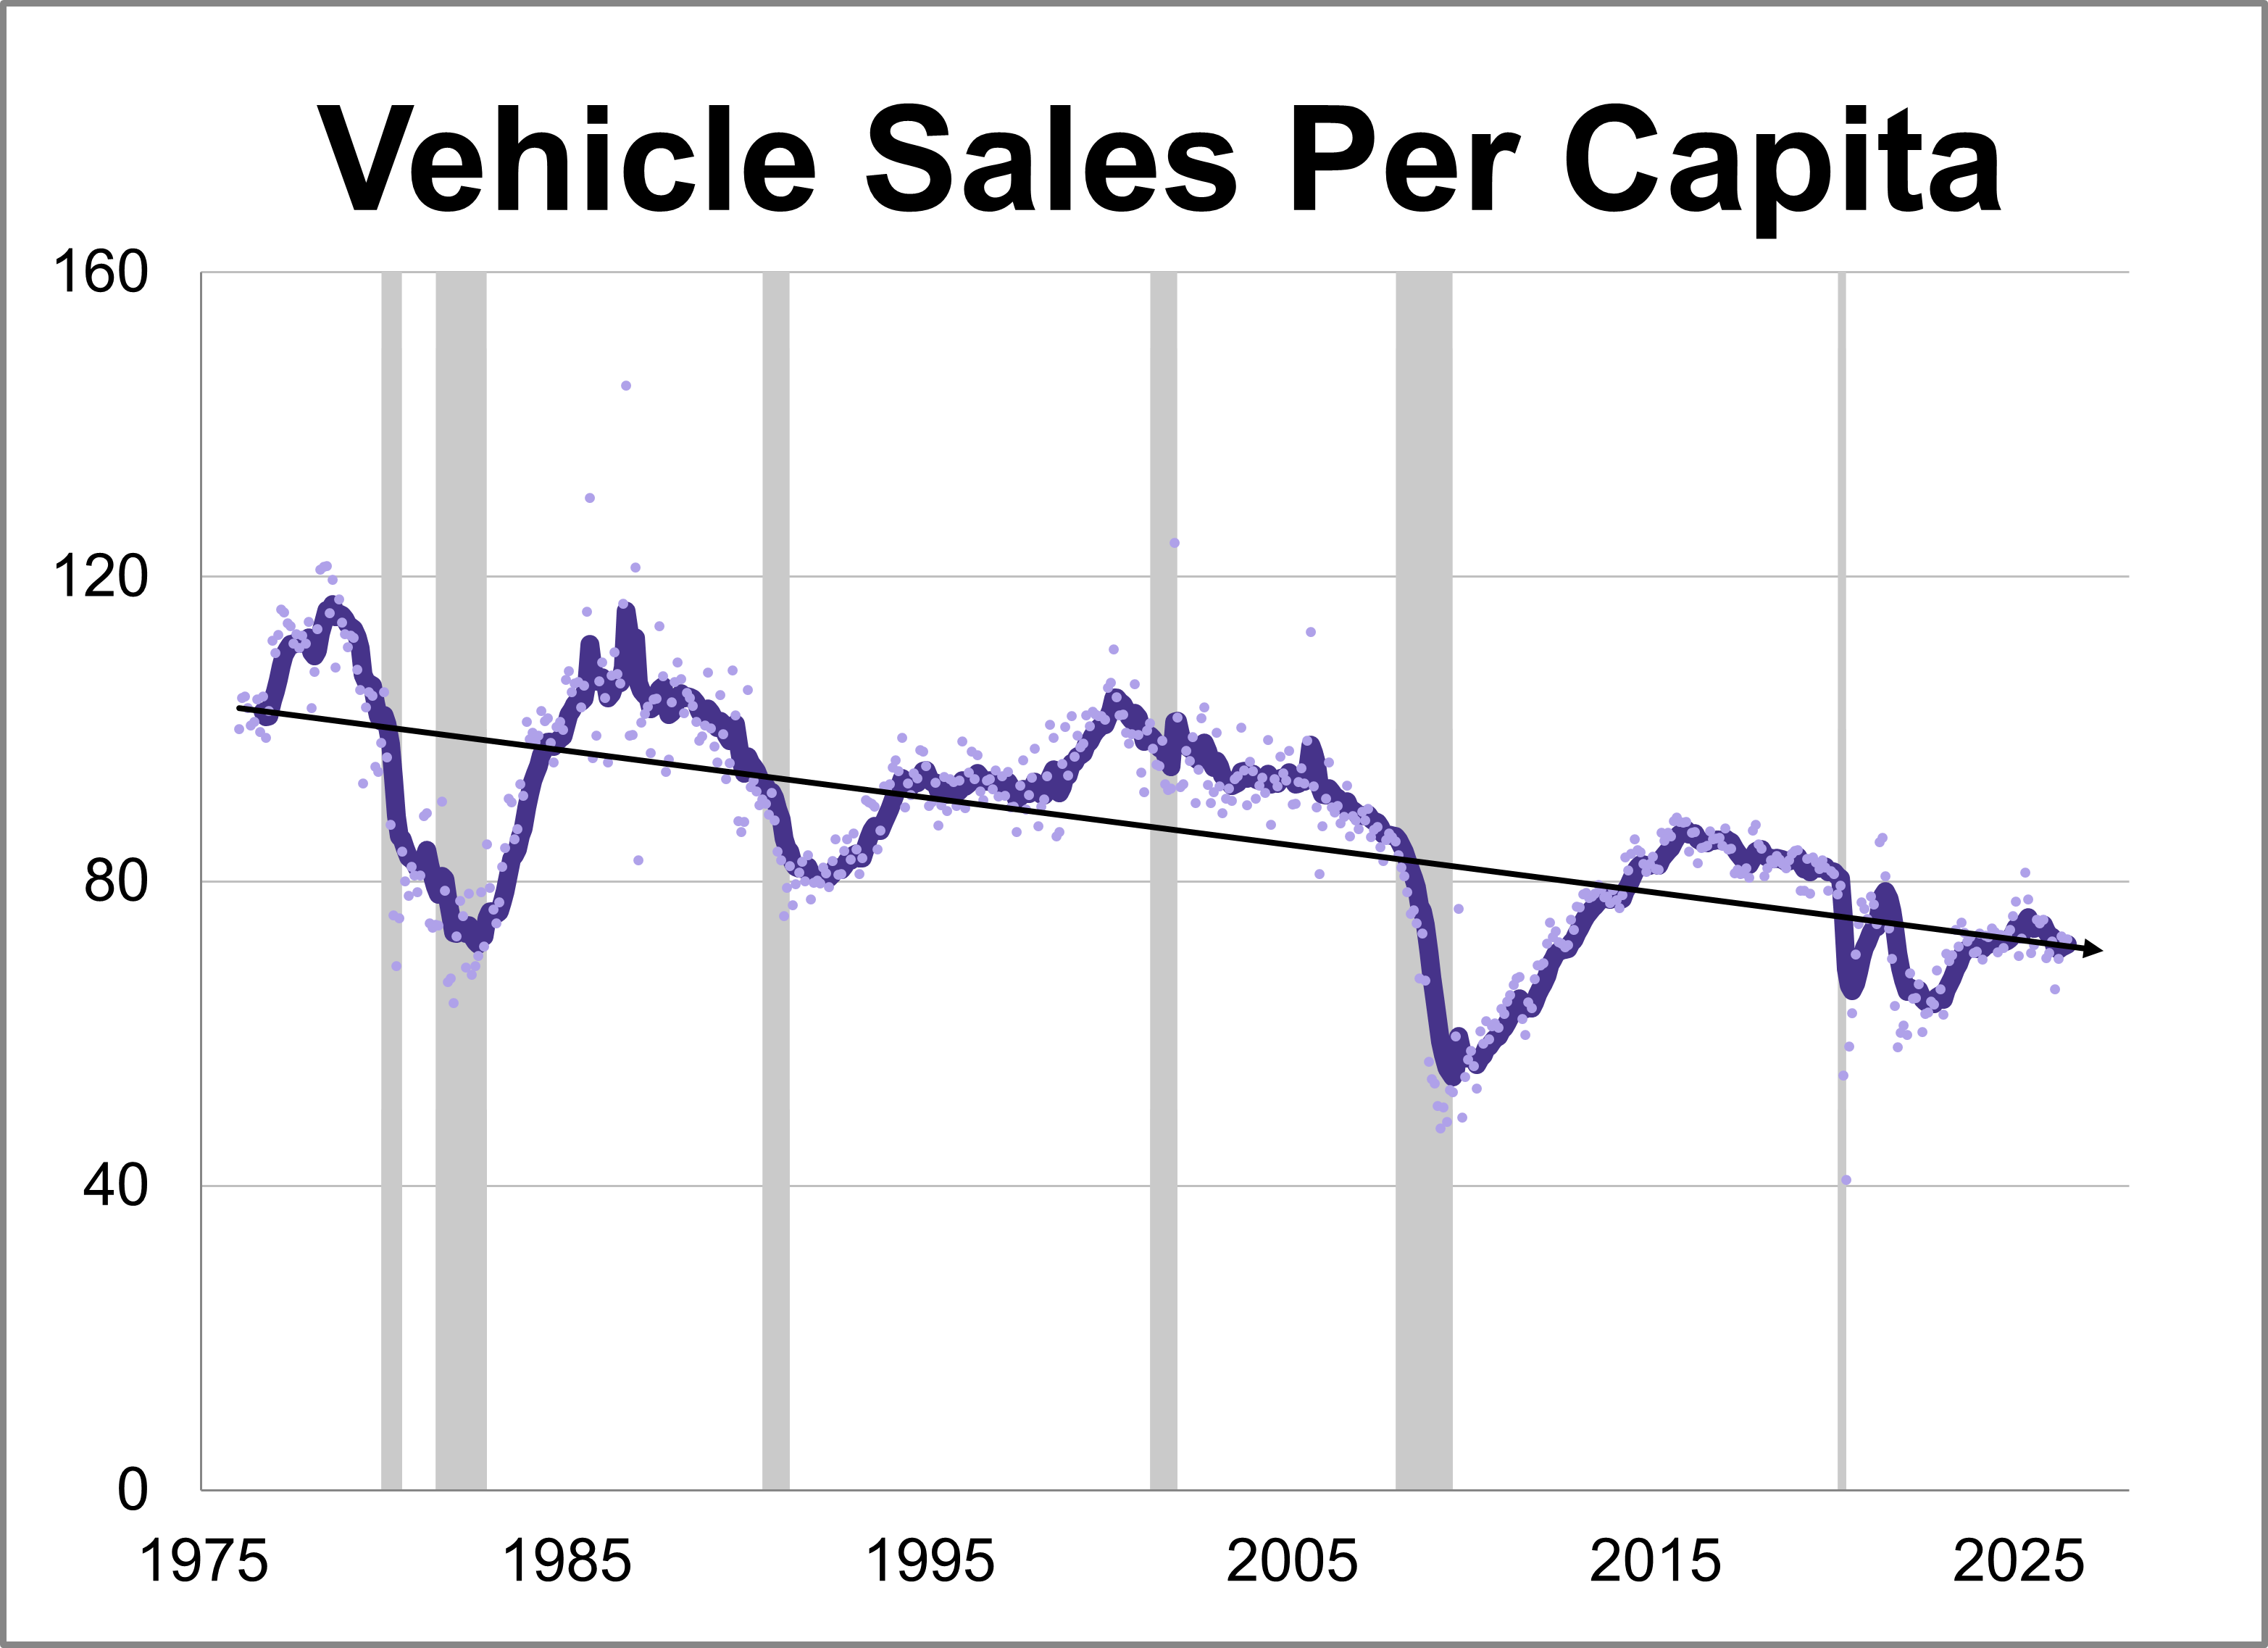
Vehicle sales inched up in May, coming in at a seasonally adjusted annual rate of 16.083 million units. This represents a 0.4% increase from the previous month and a 3.2% rise from one year ago.
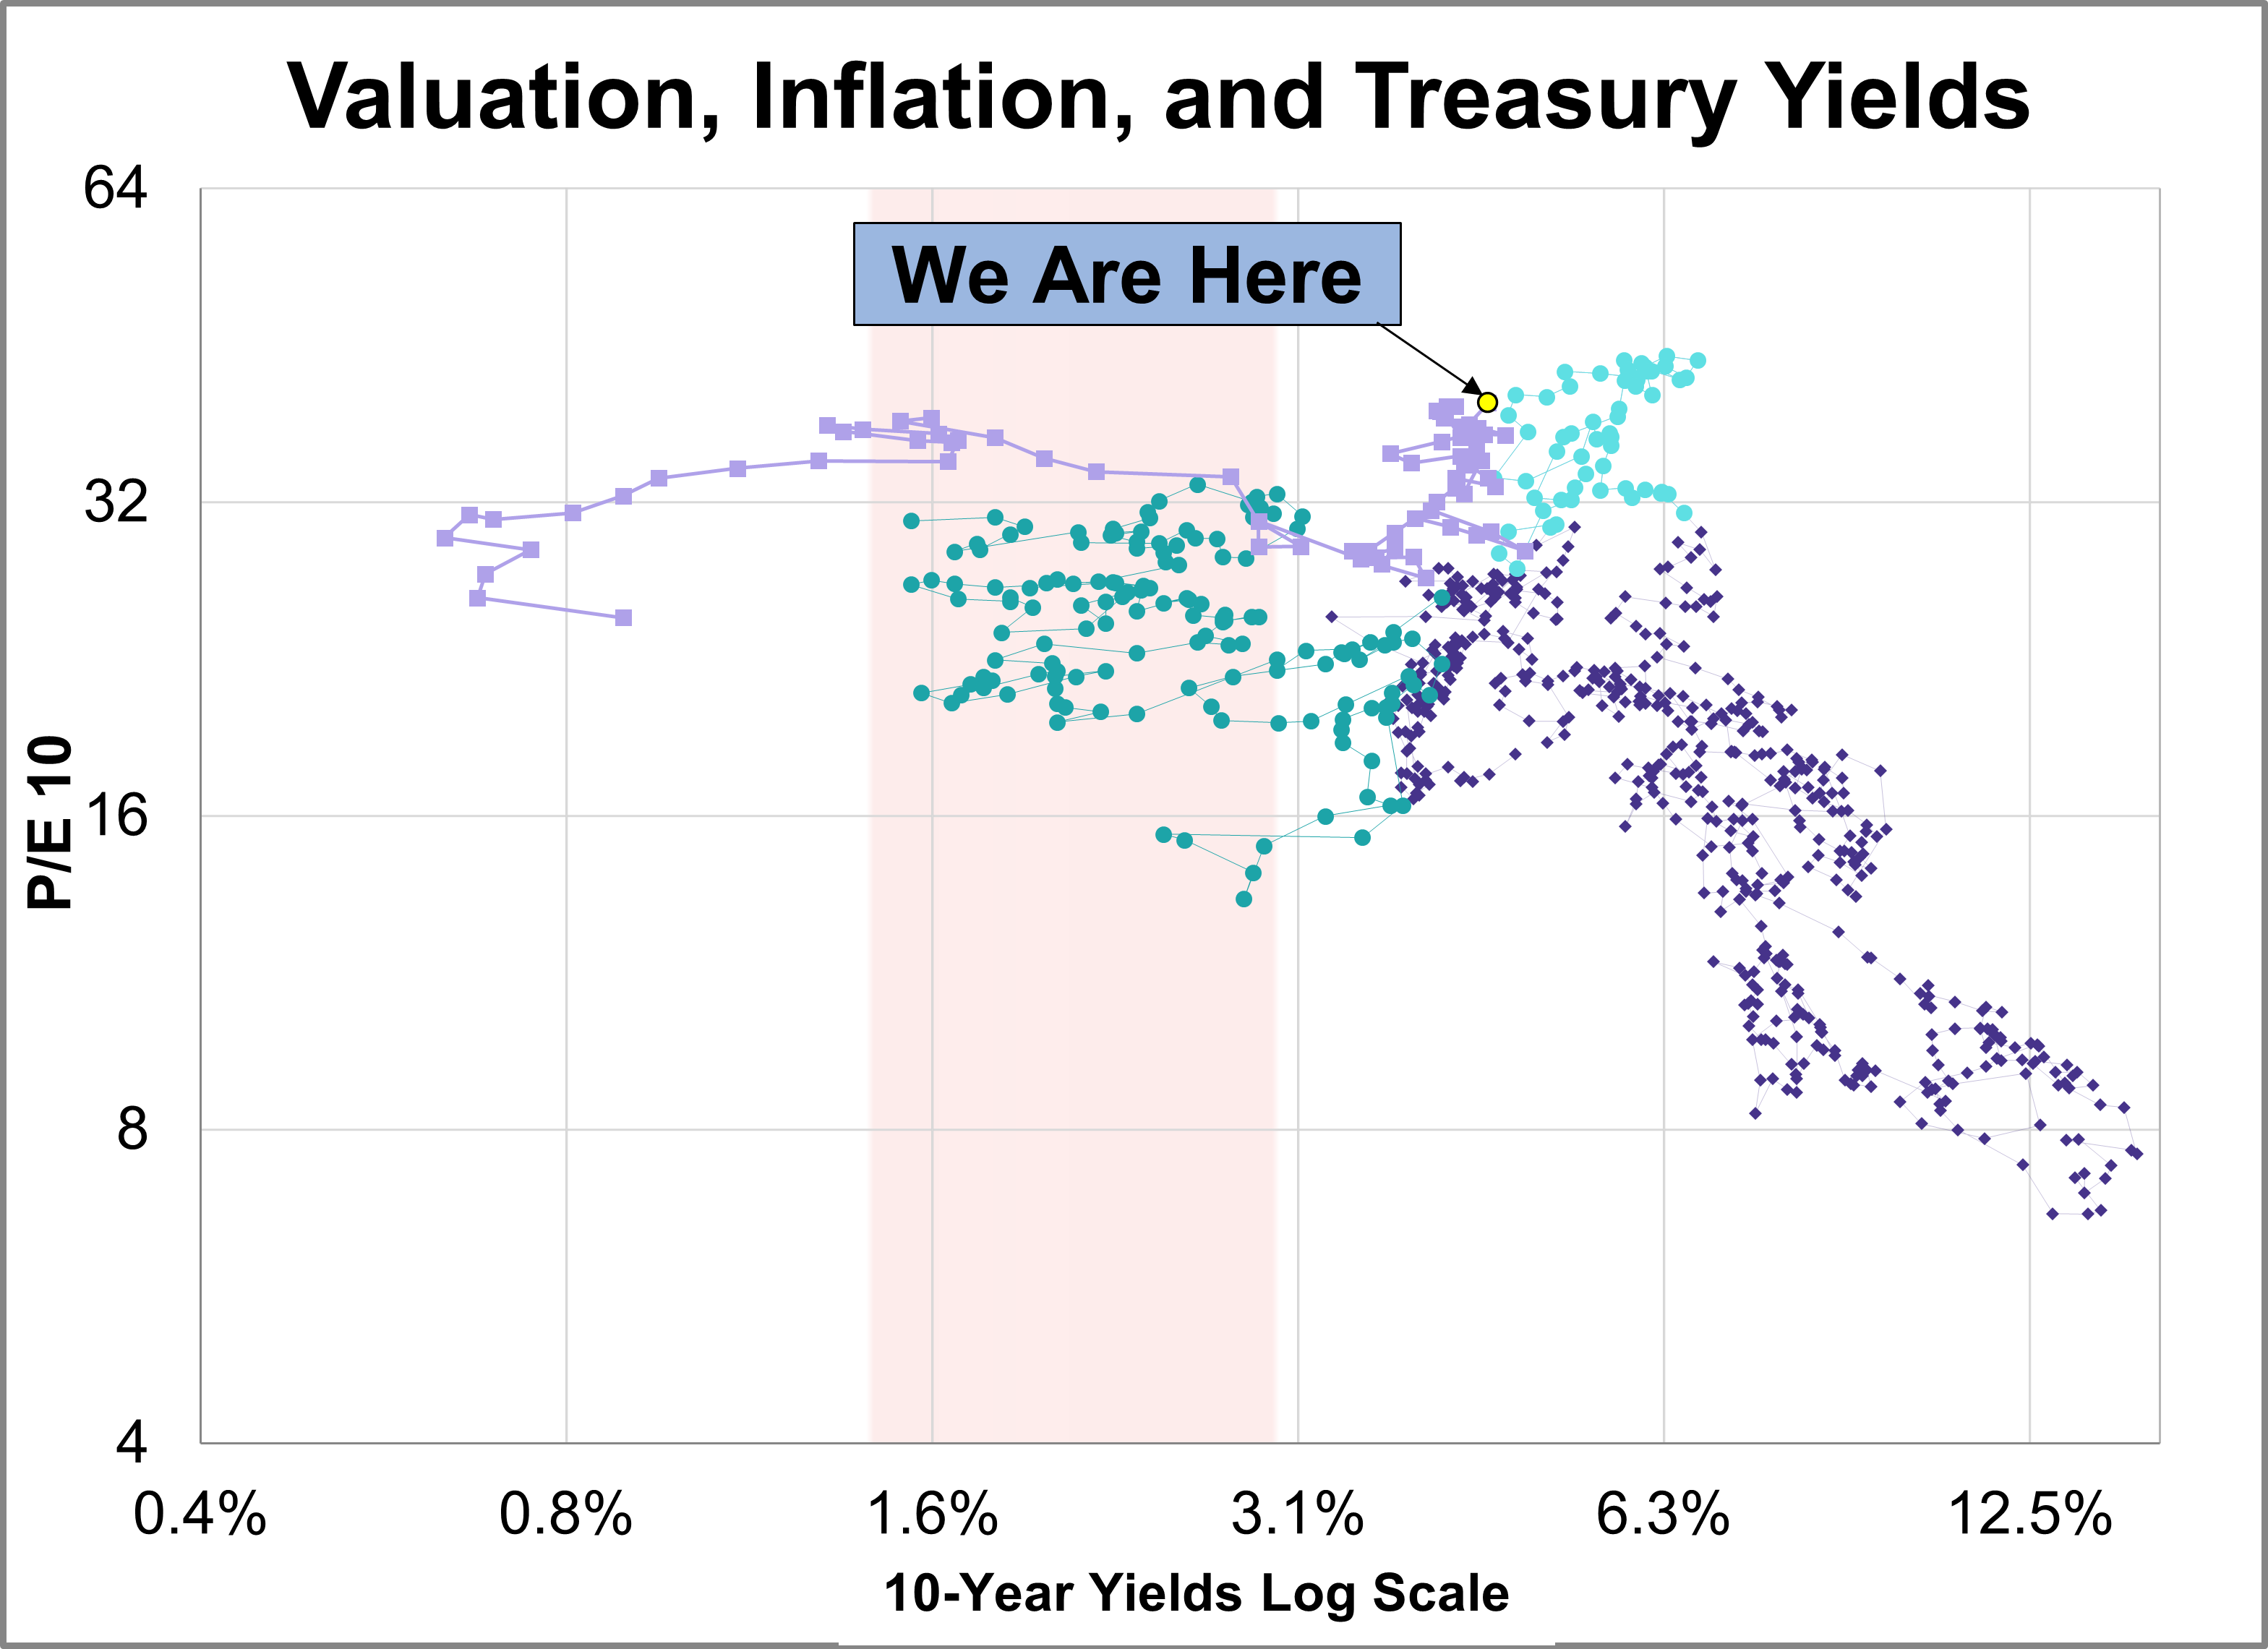
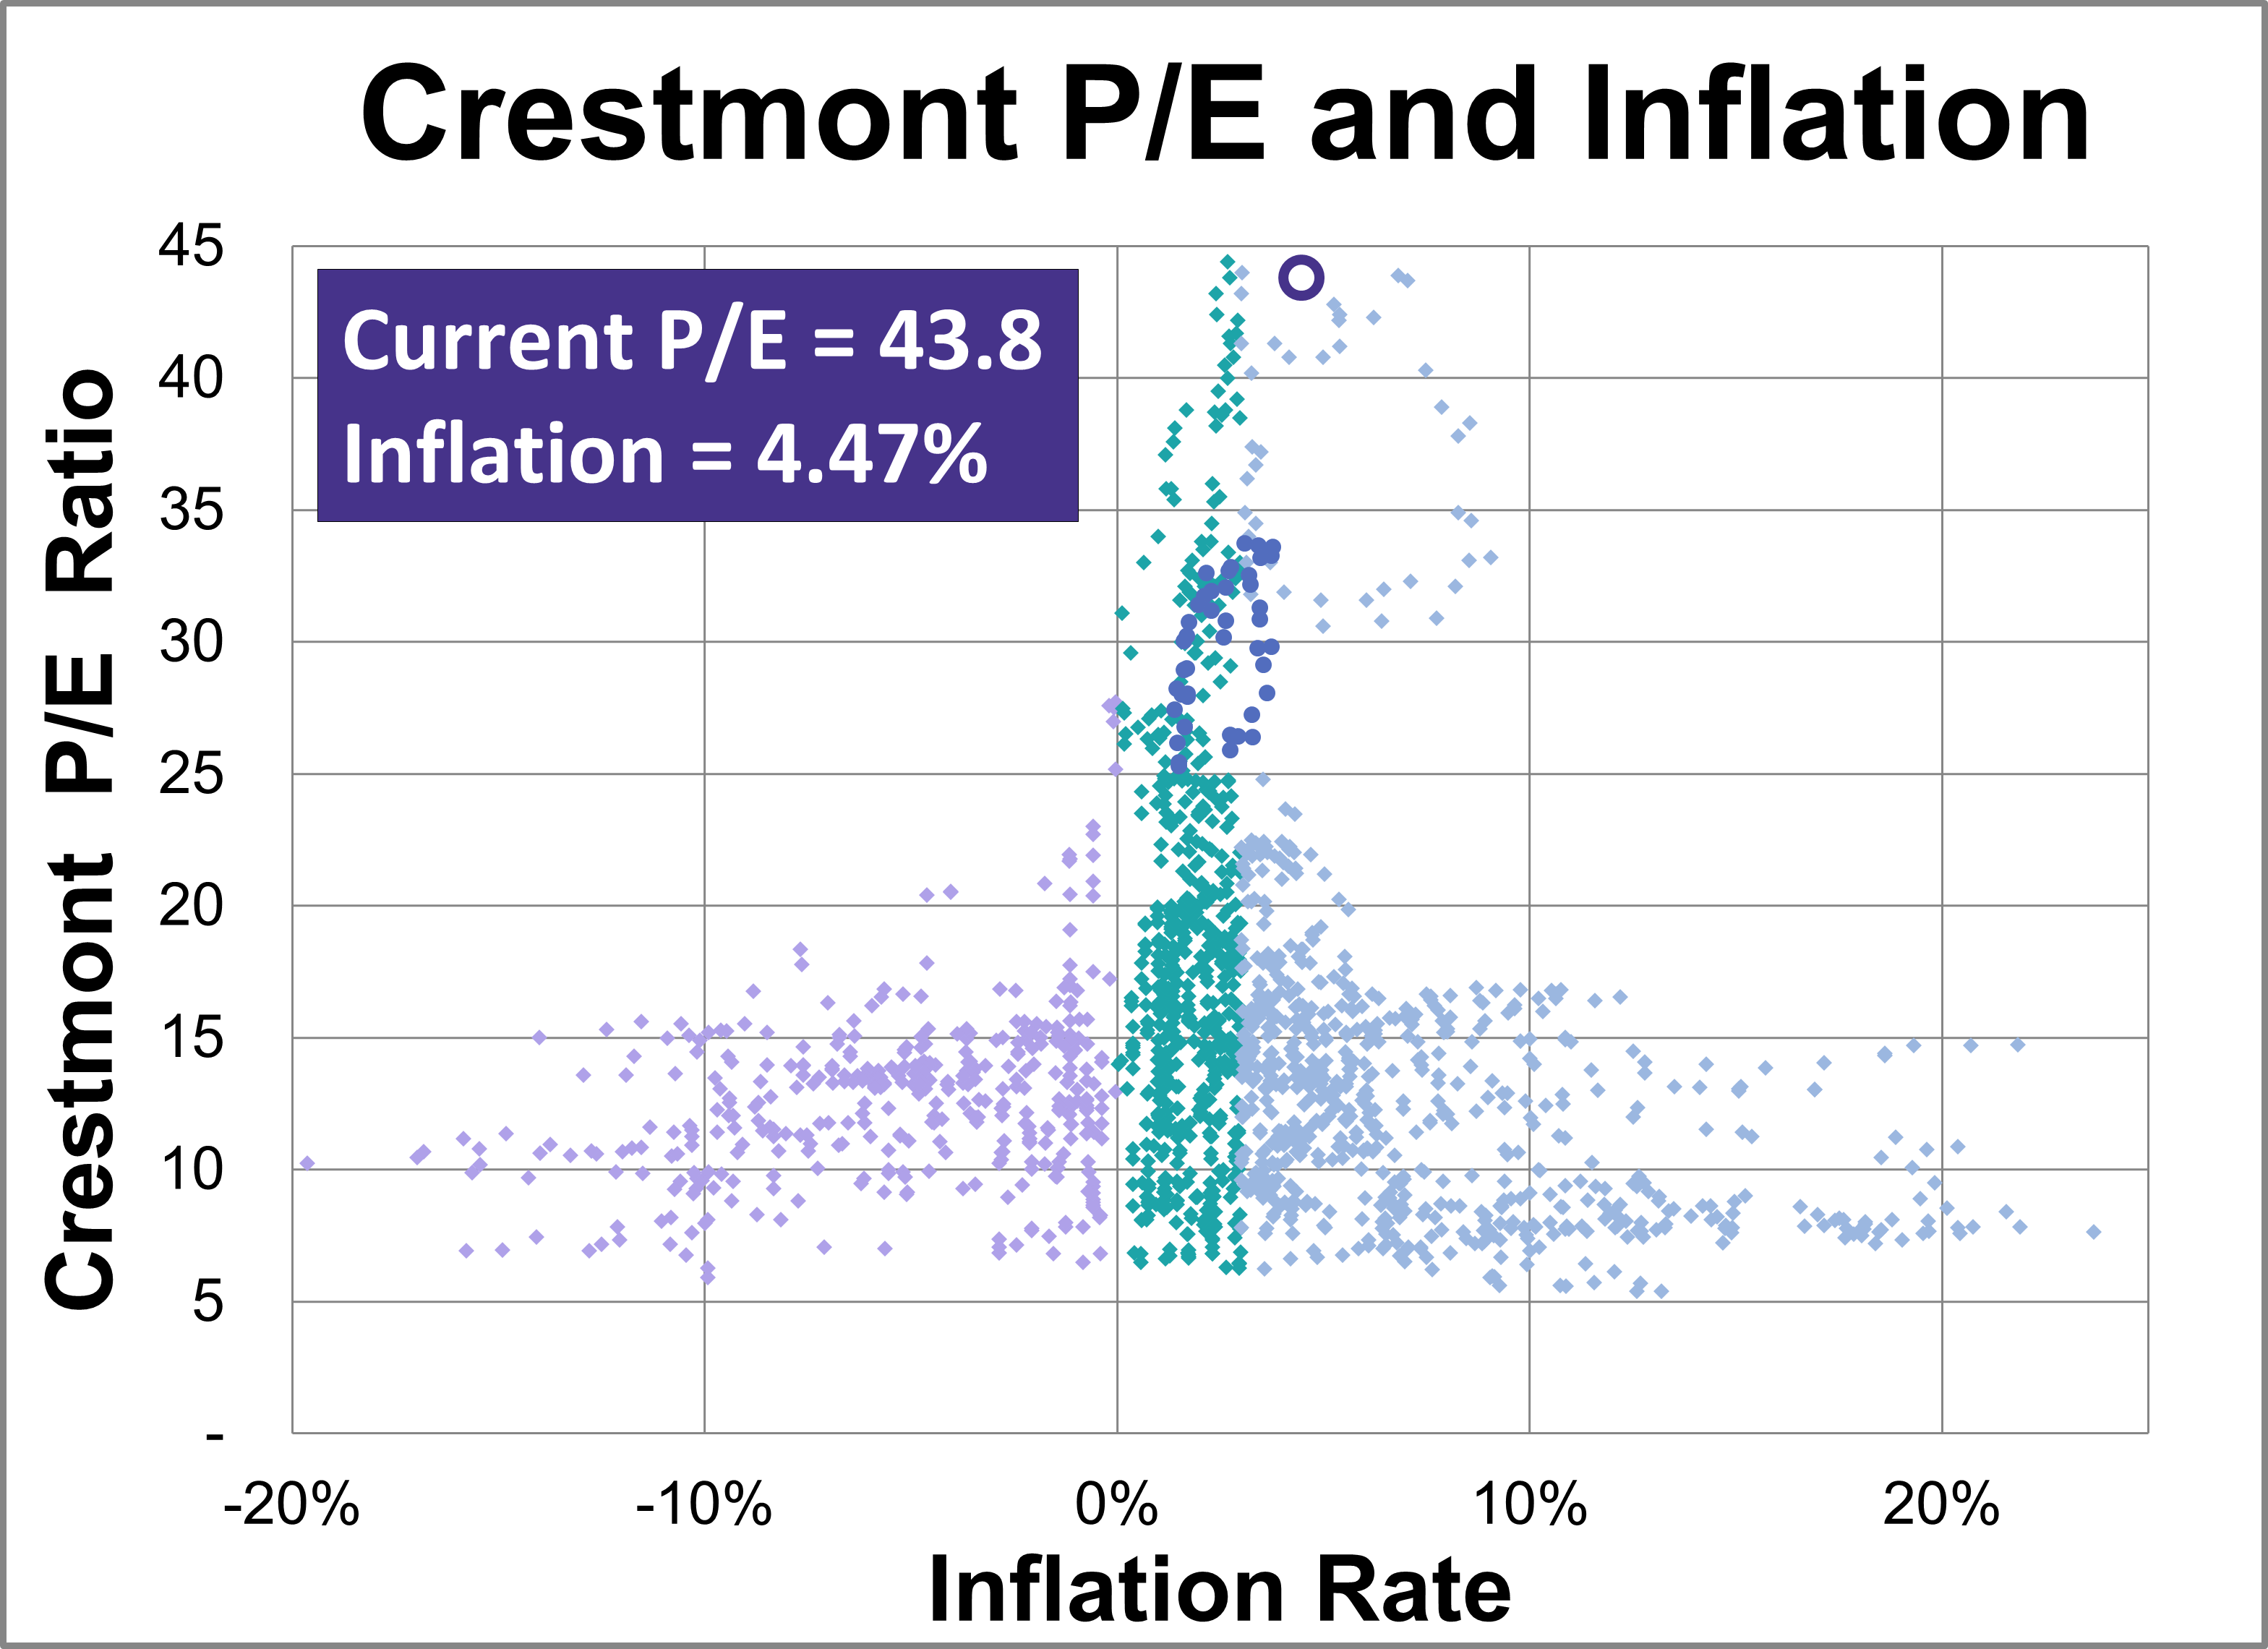
Our monthly market valuation updates have long had the same conclusion: US stock indexes are significantly overvalued, which suggests cautious expectations for investment returns. This analysis focuses on the P/E10 ratio, key indicator of market valuation, and its correlation with inflation and the 10-year Treasury yield.
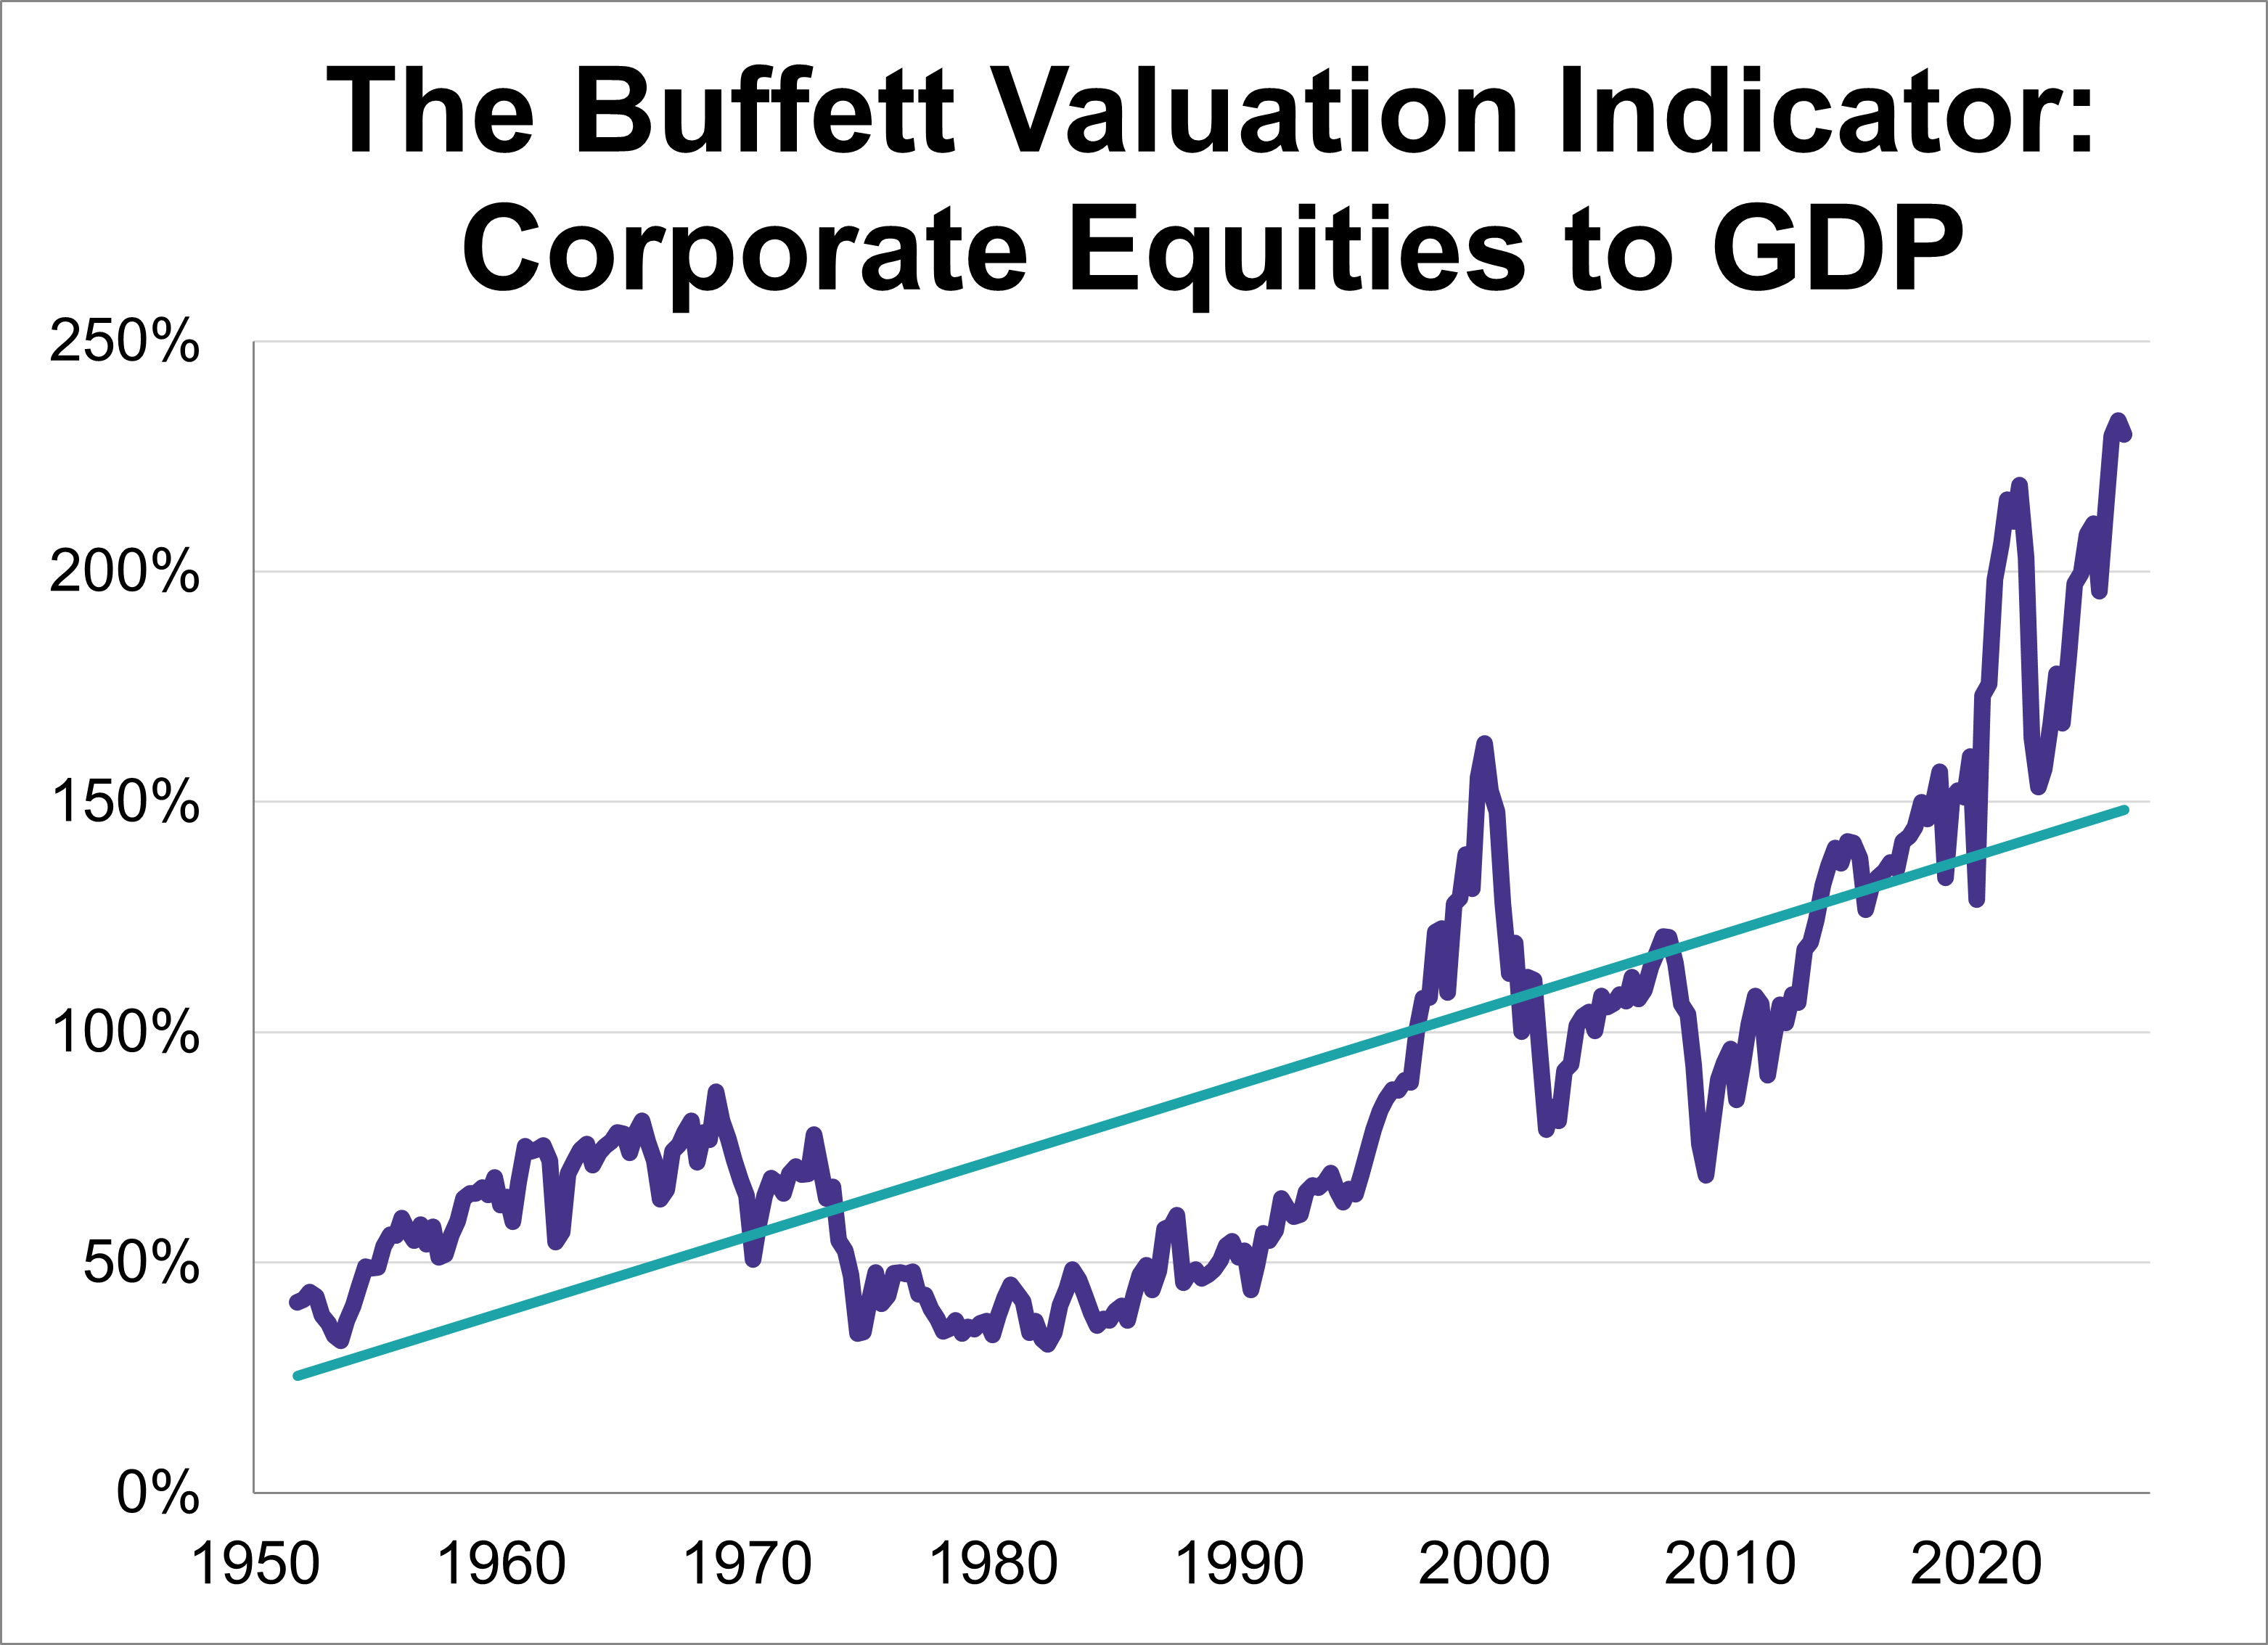
Following the Q1 GDP second estimate, the 'Buffett Indicator'—the ratio of corporate equities to GDP—now stands at 229.7%. This marks the second-highest reading in history, eclipsed only by the previous quarter.
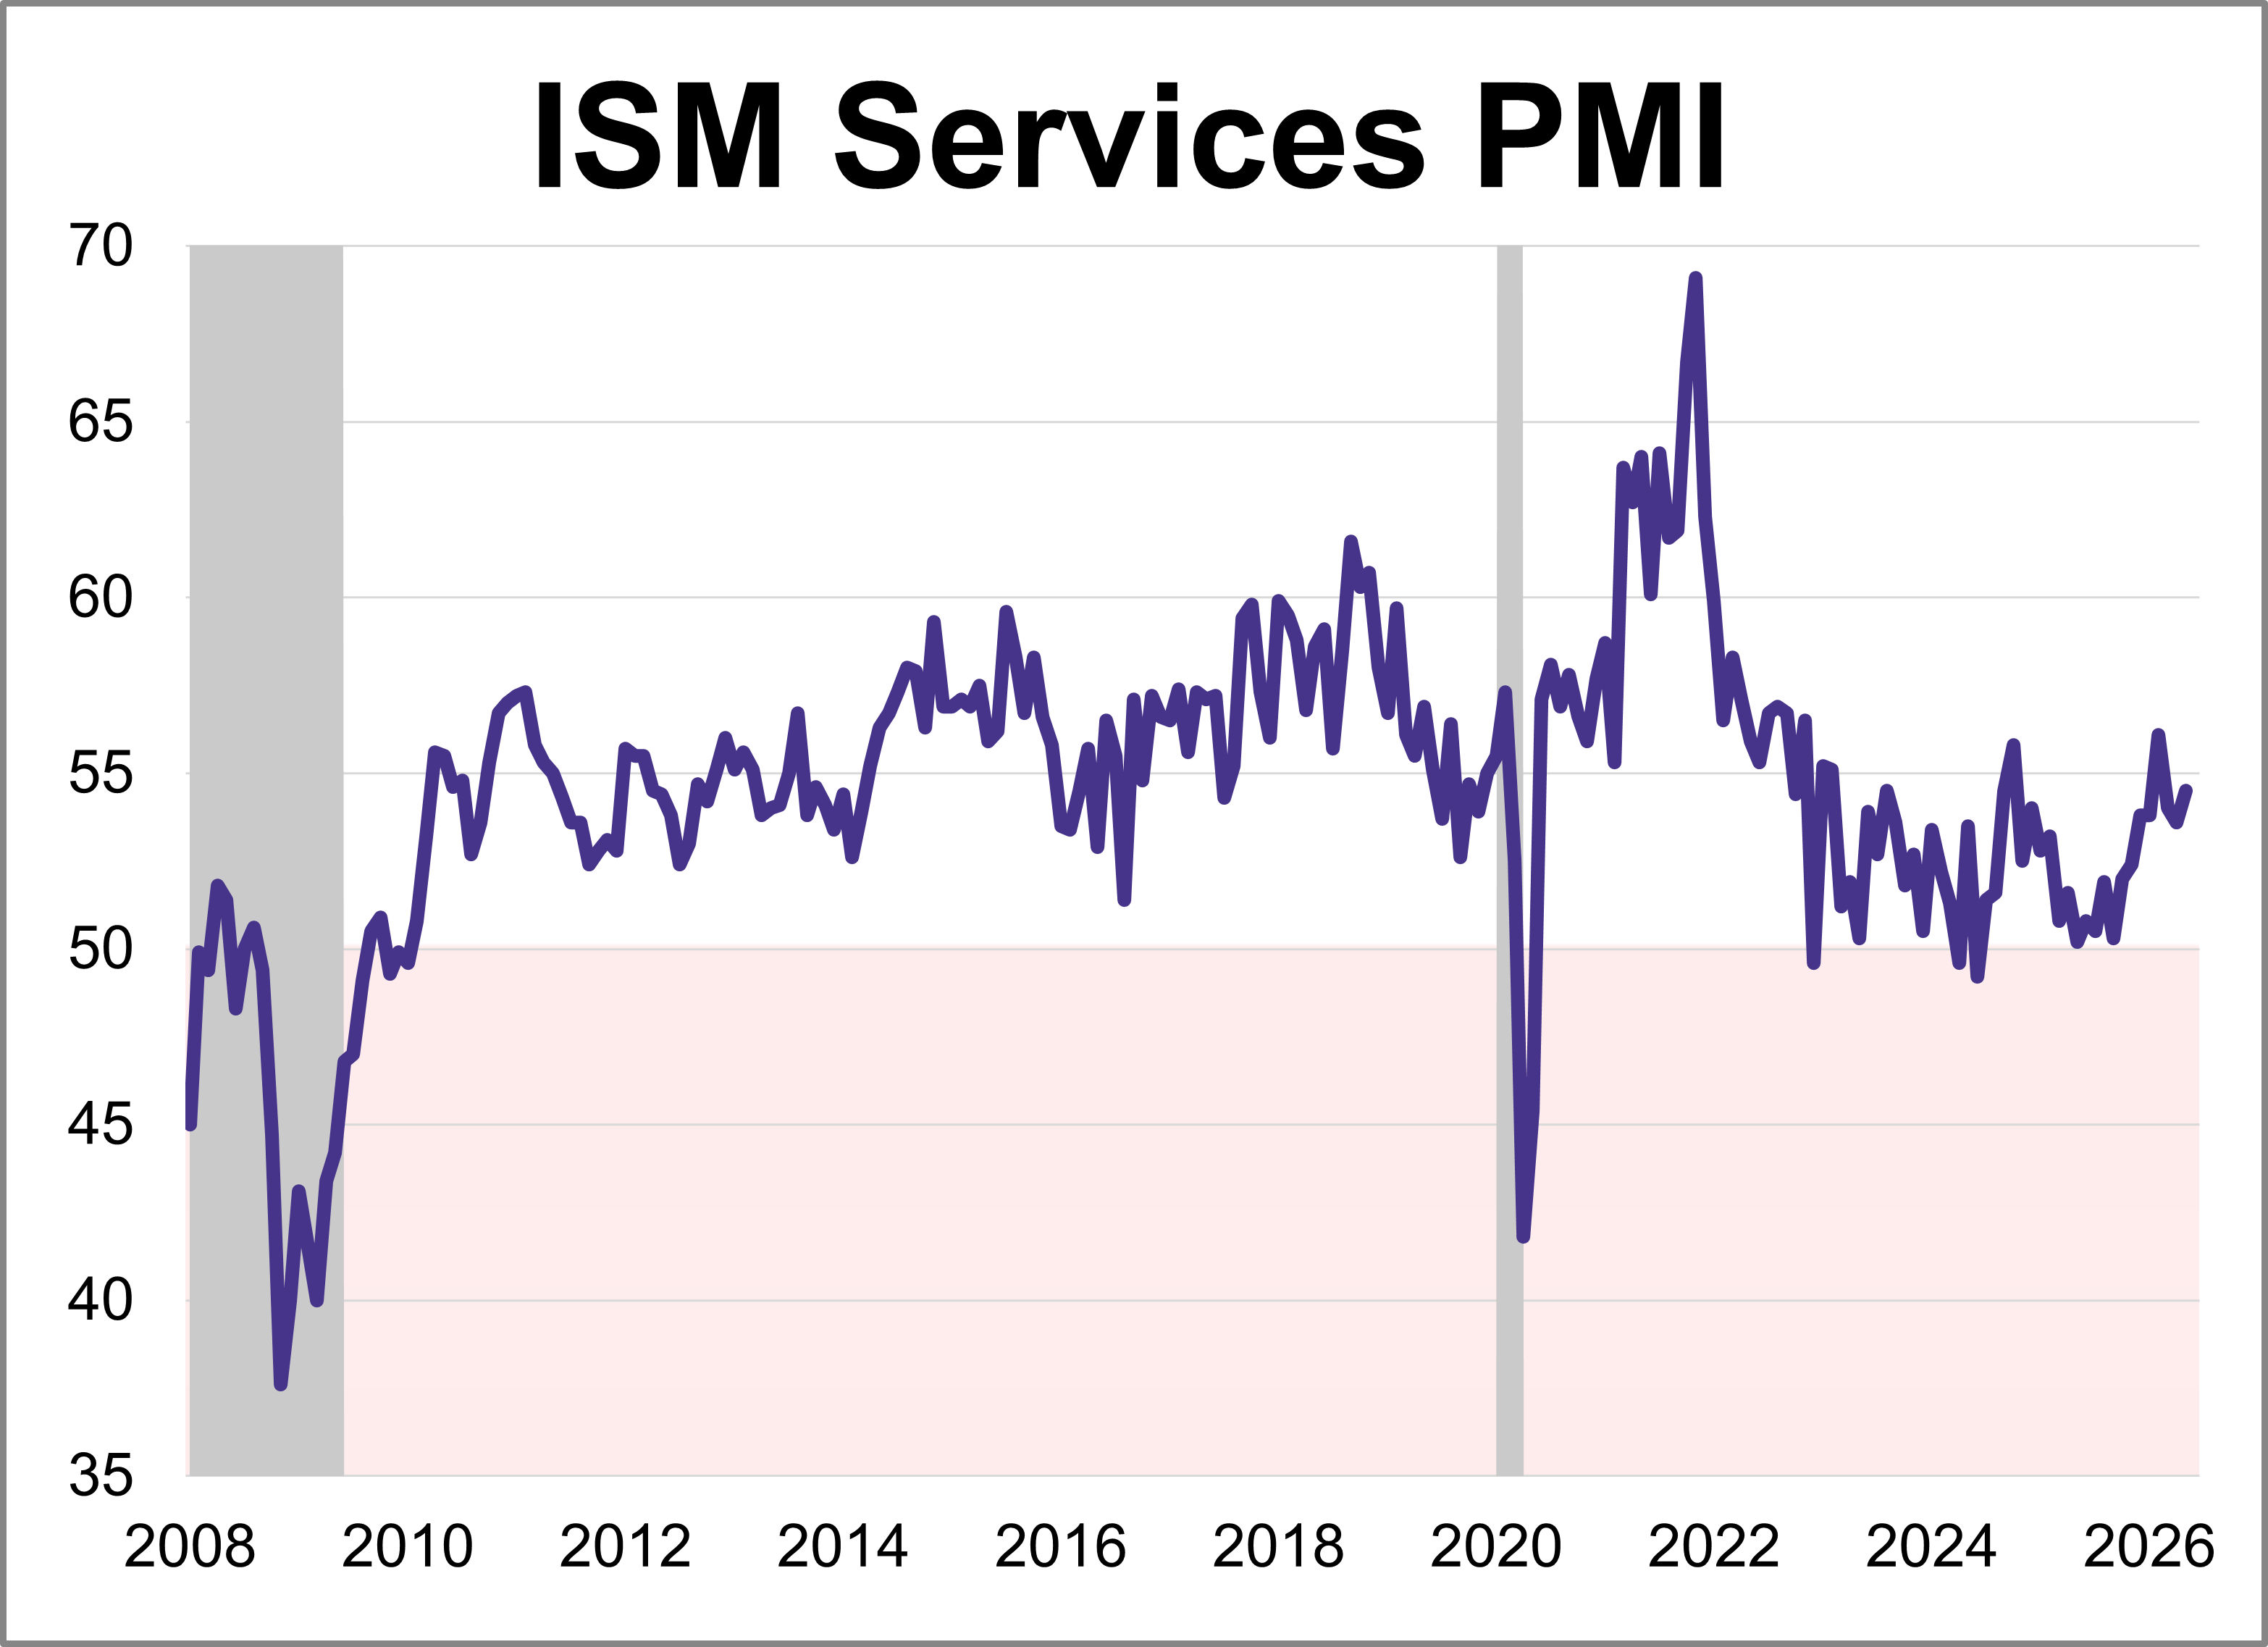
The Institute for Supply Management (ISM) released its May Services Purchasing Managers' Index (PMI), with the headline composite index at 54.5. This was higher than the forecast of 53.7 and keeps the index in expansion territory for a 23rd consecutive month.
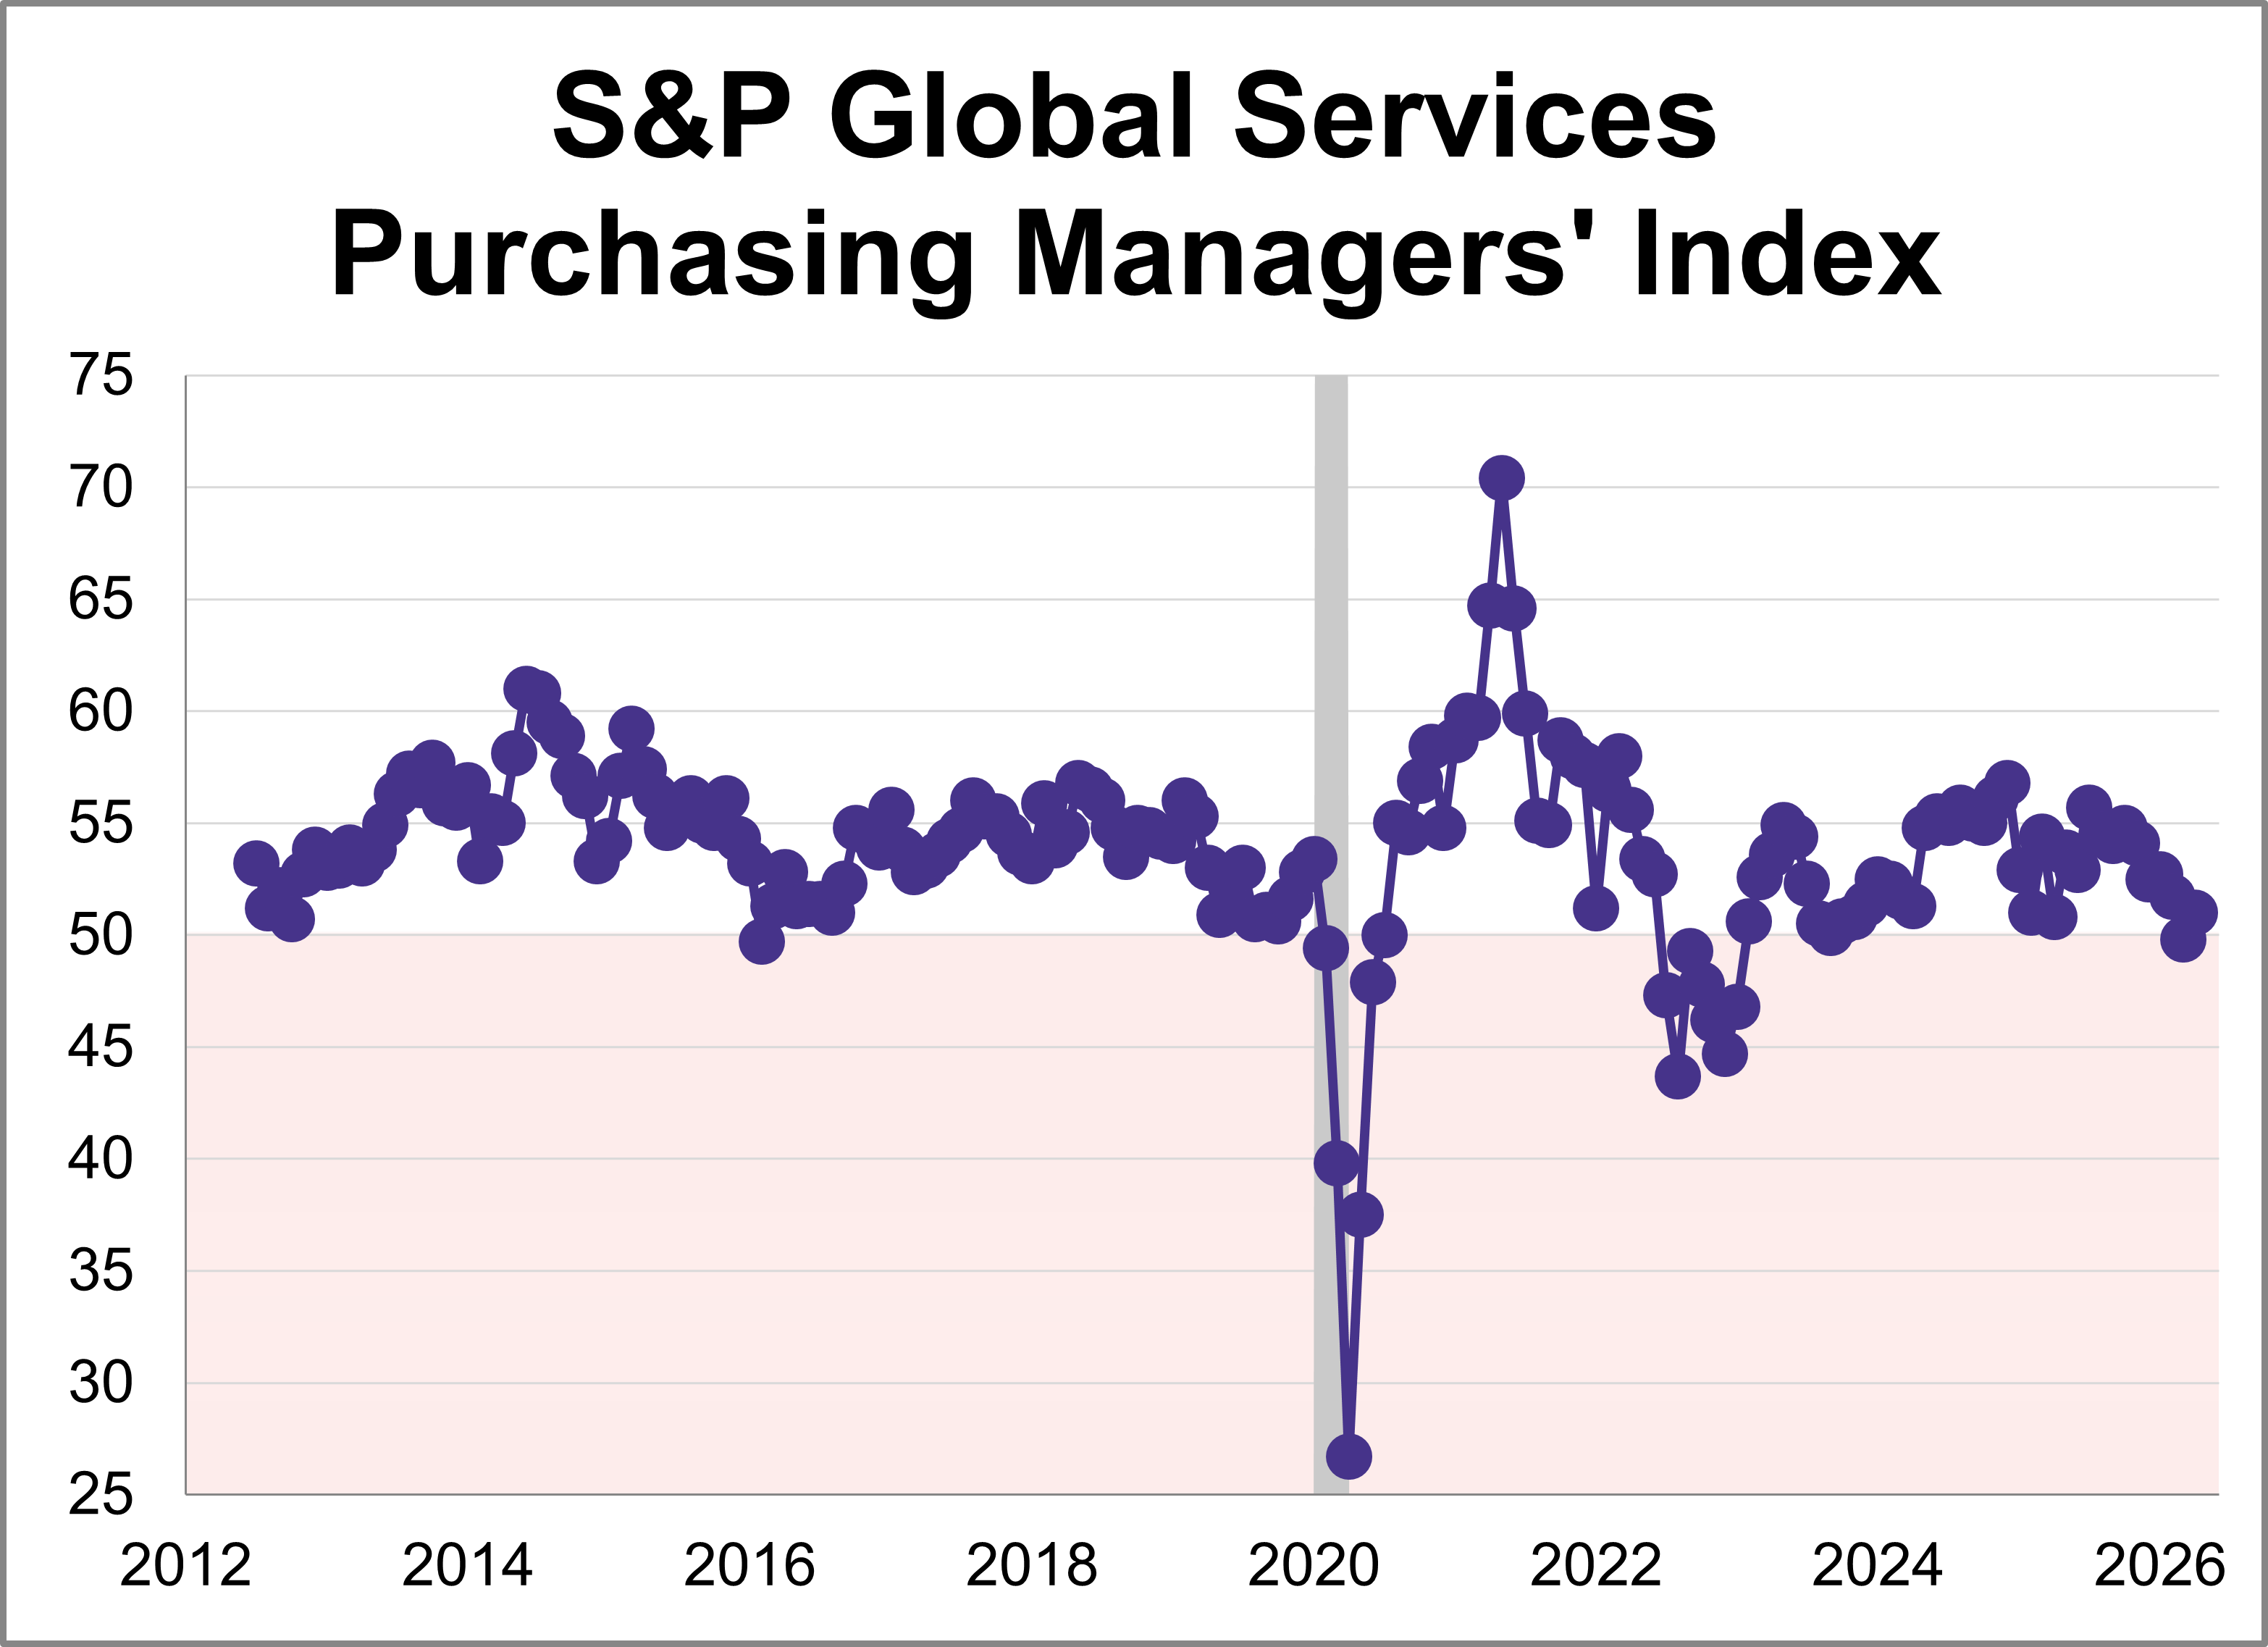
The May U.S. Services Purchasing Managers' Index (PMI) from S&P Global inched down 0.3 points to 50.7, indicating slower expansion in the services sector. The latest reading was lower than the forecast of 50.9 and was among the weakest months of expansion in the past 2.5 years.
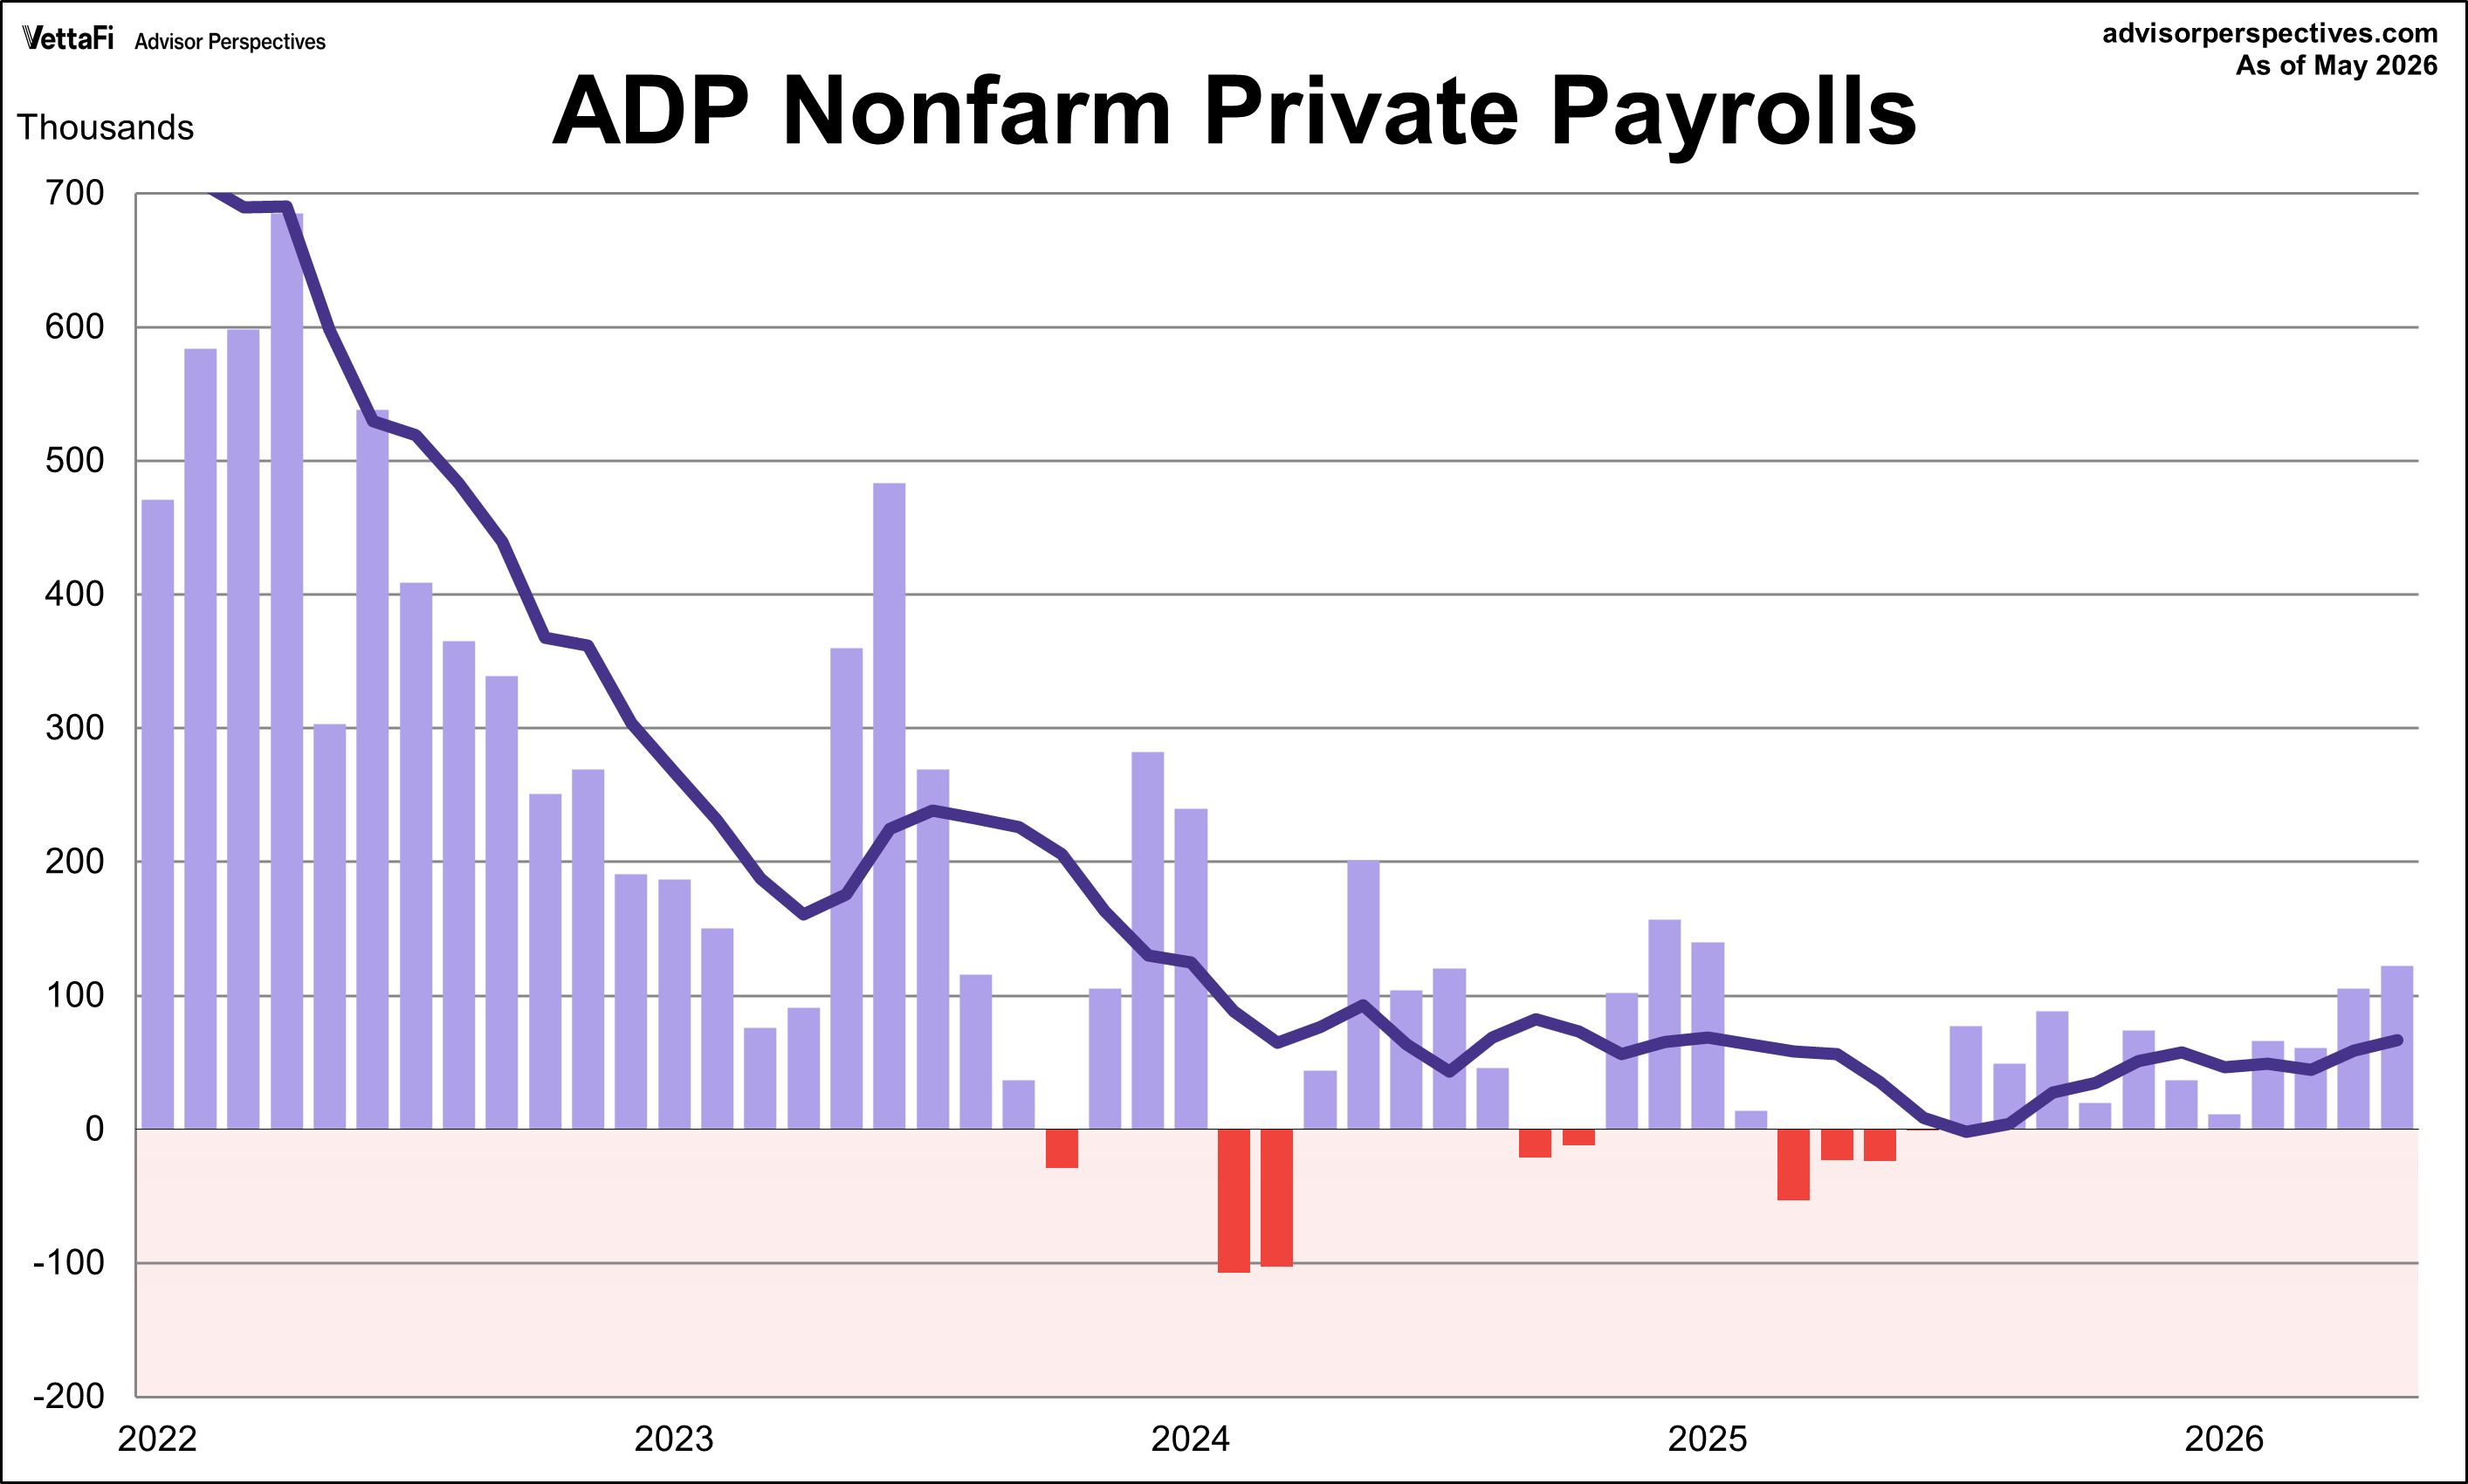
The ADP employment report revealed that 122,000 nonfarm private jobs were added in May, the largest monthly growth since January 2025. The latest figure was just above the projected 118,000 addition.
Here is a summary of the four market valuation indicators we update on a monthly basis.
Based on May's S&P 500 average of daily closes, the Crestmont P/E of 43.8 is 185% above its arithmetic mean, 213% above its geometric mean, and is in the 100th percentile of this 14-plus-decade series.
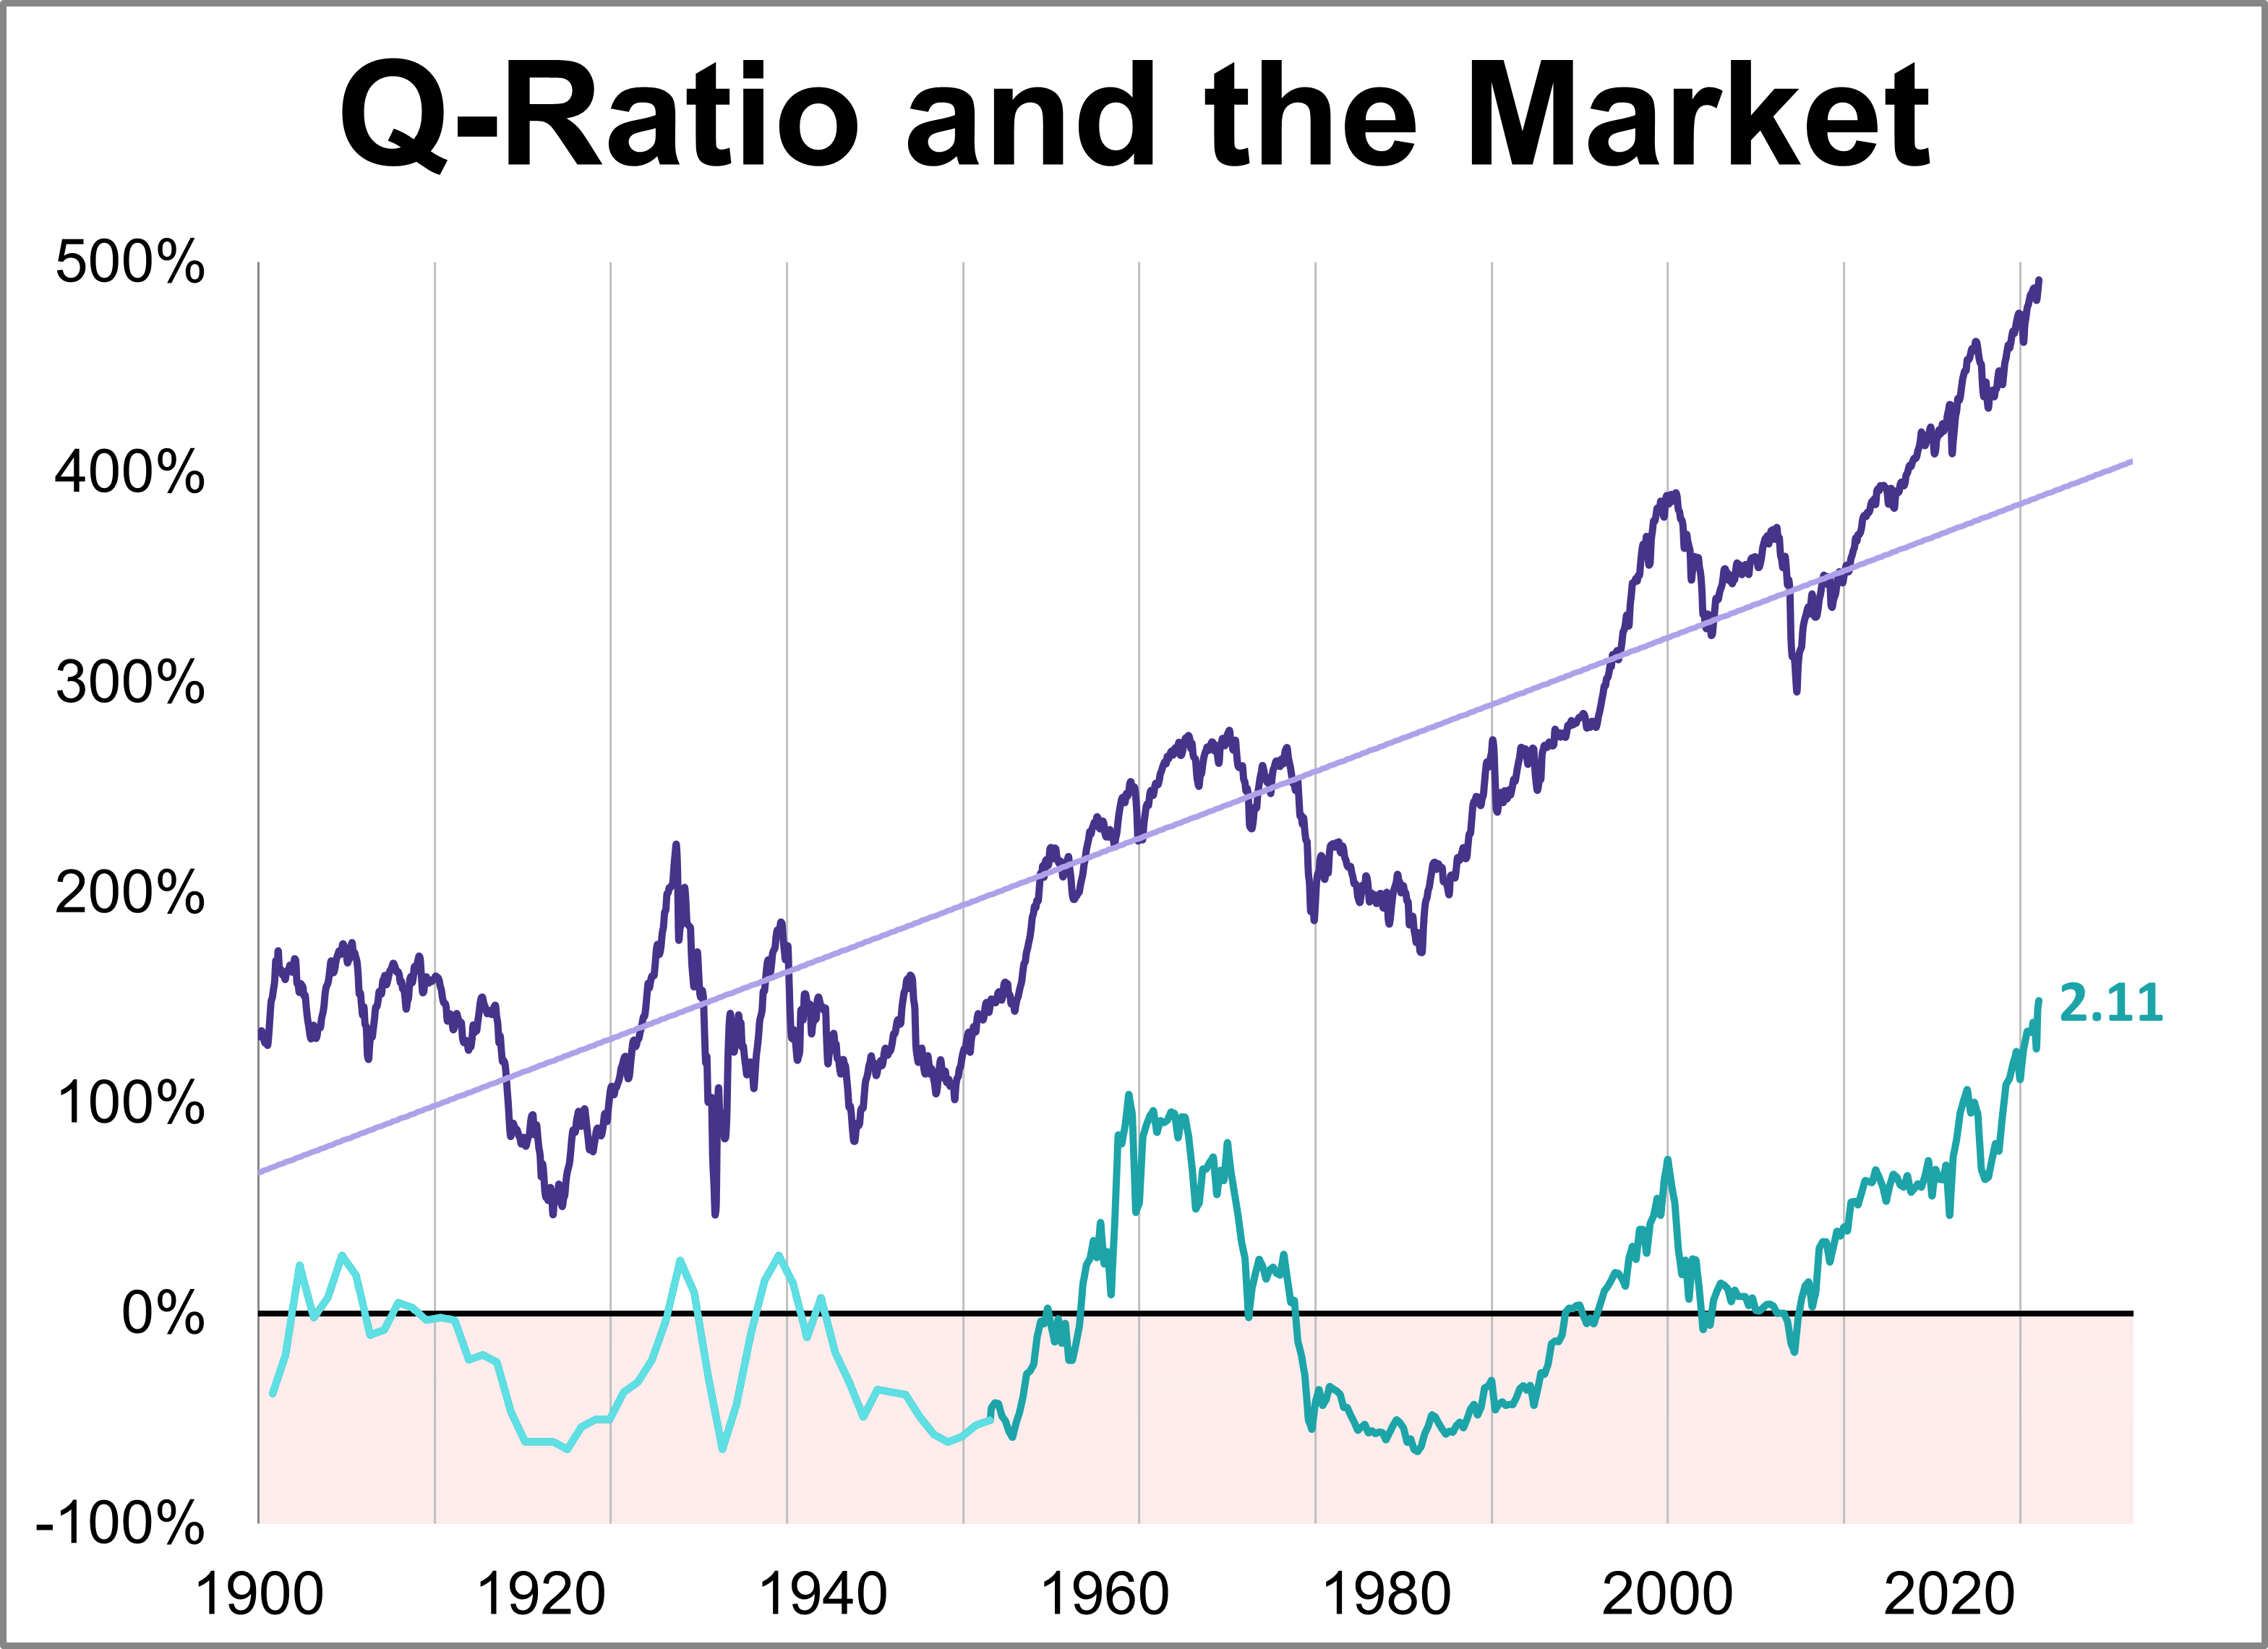
The Q Ratio is the total price of the market divided by the replacement cost of all its companies. As of May 2026, the latest Q-ratio is at 2.11, the highest level in history.
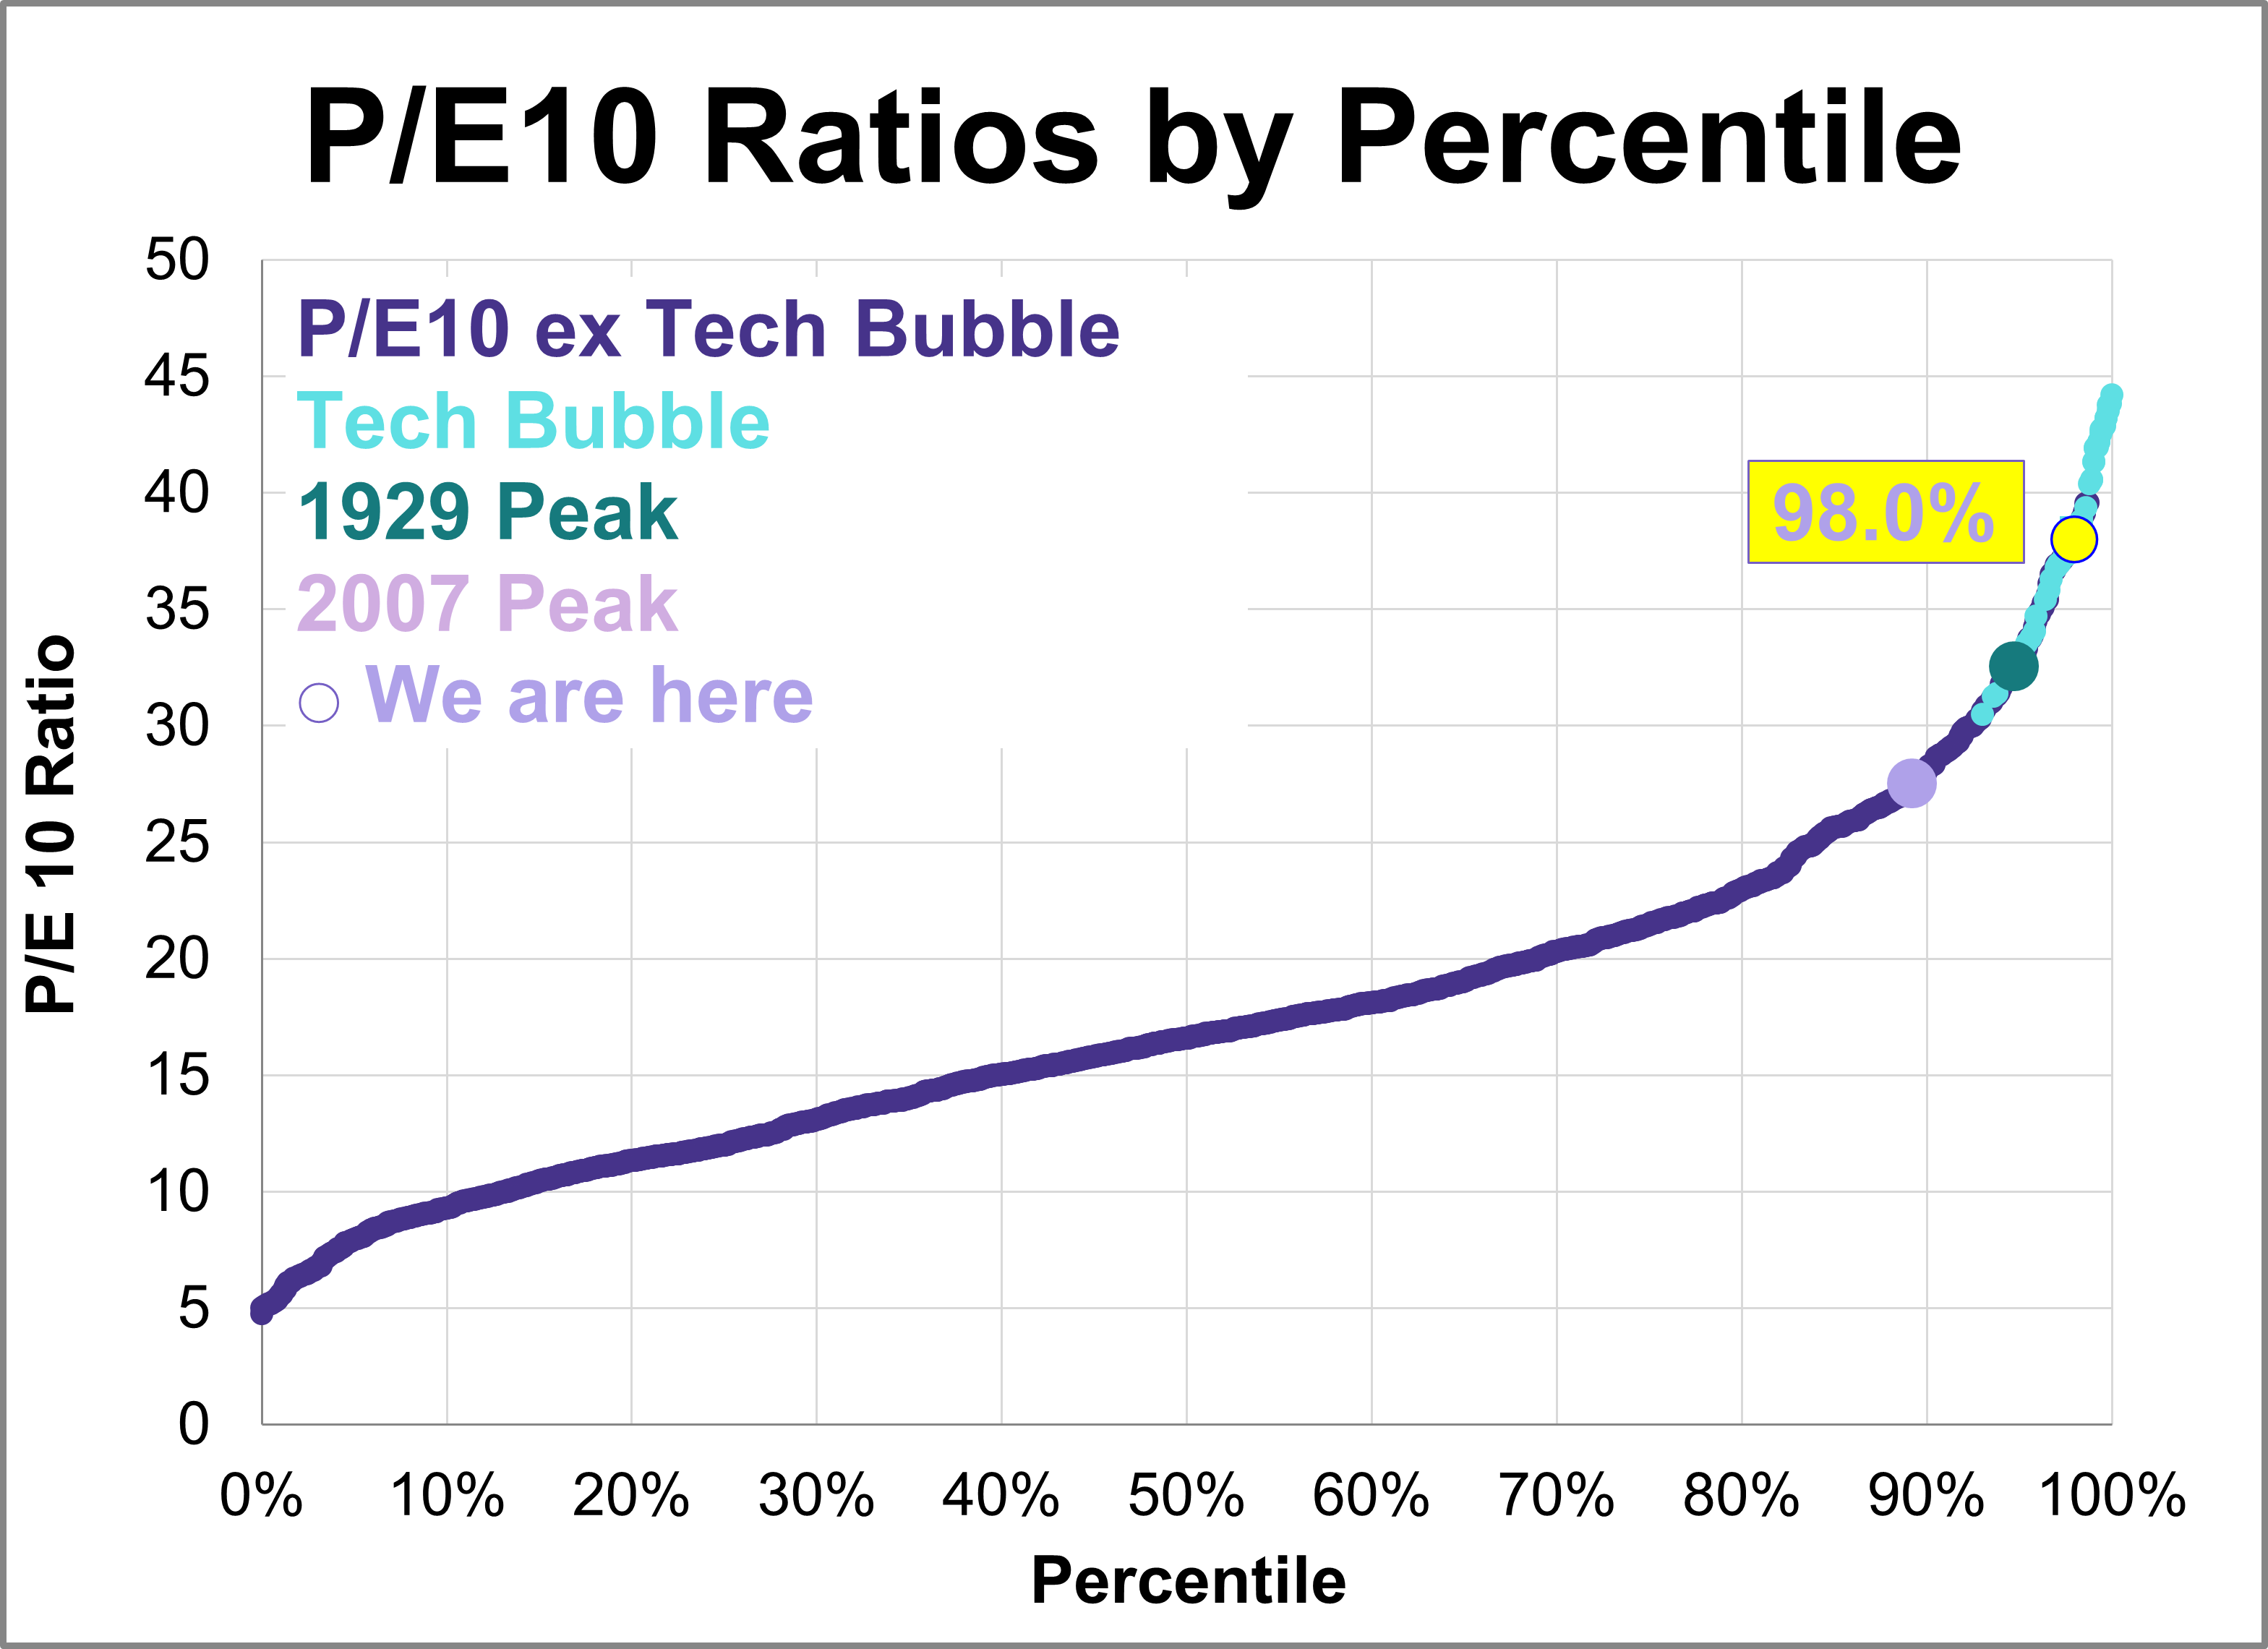
Here is the latest update of a popular market valuation method, Price-to-Earnings (P/E) ratio, using the most recent Standard & Poor's "as reported" earnings and earnings estimates, and the index monthly average of daily closes for the past month. The latest trailing twelve months (TTM) P/E ratio is 25.9 and the latest P/E10 ratio is 39.9, the highest level since 2000.
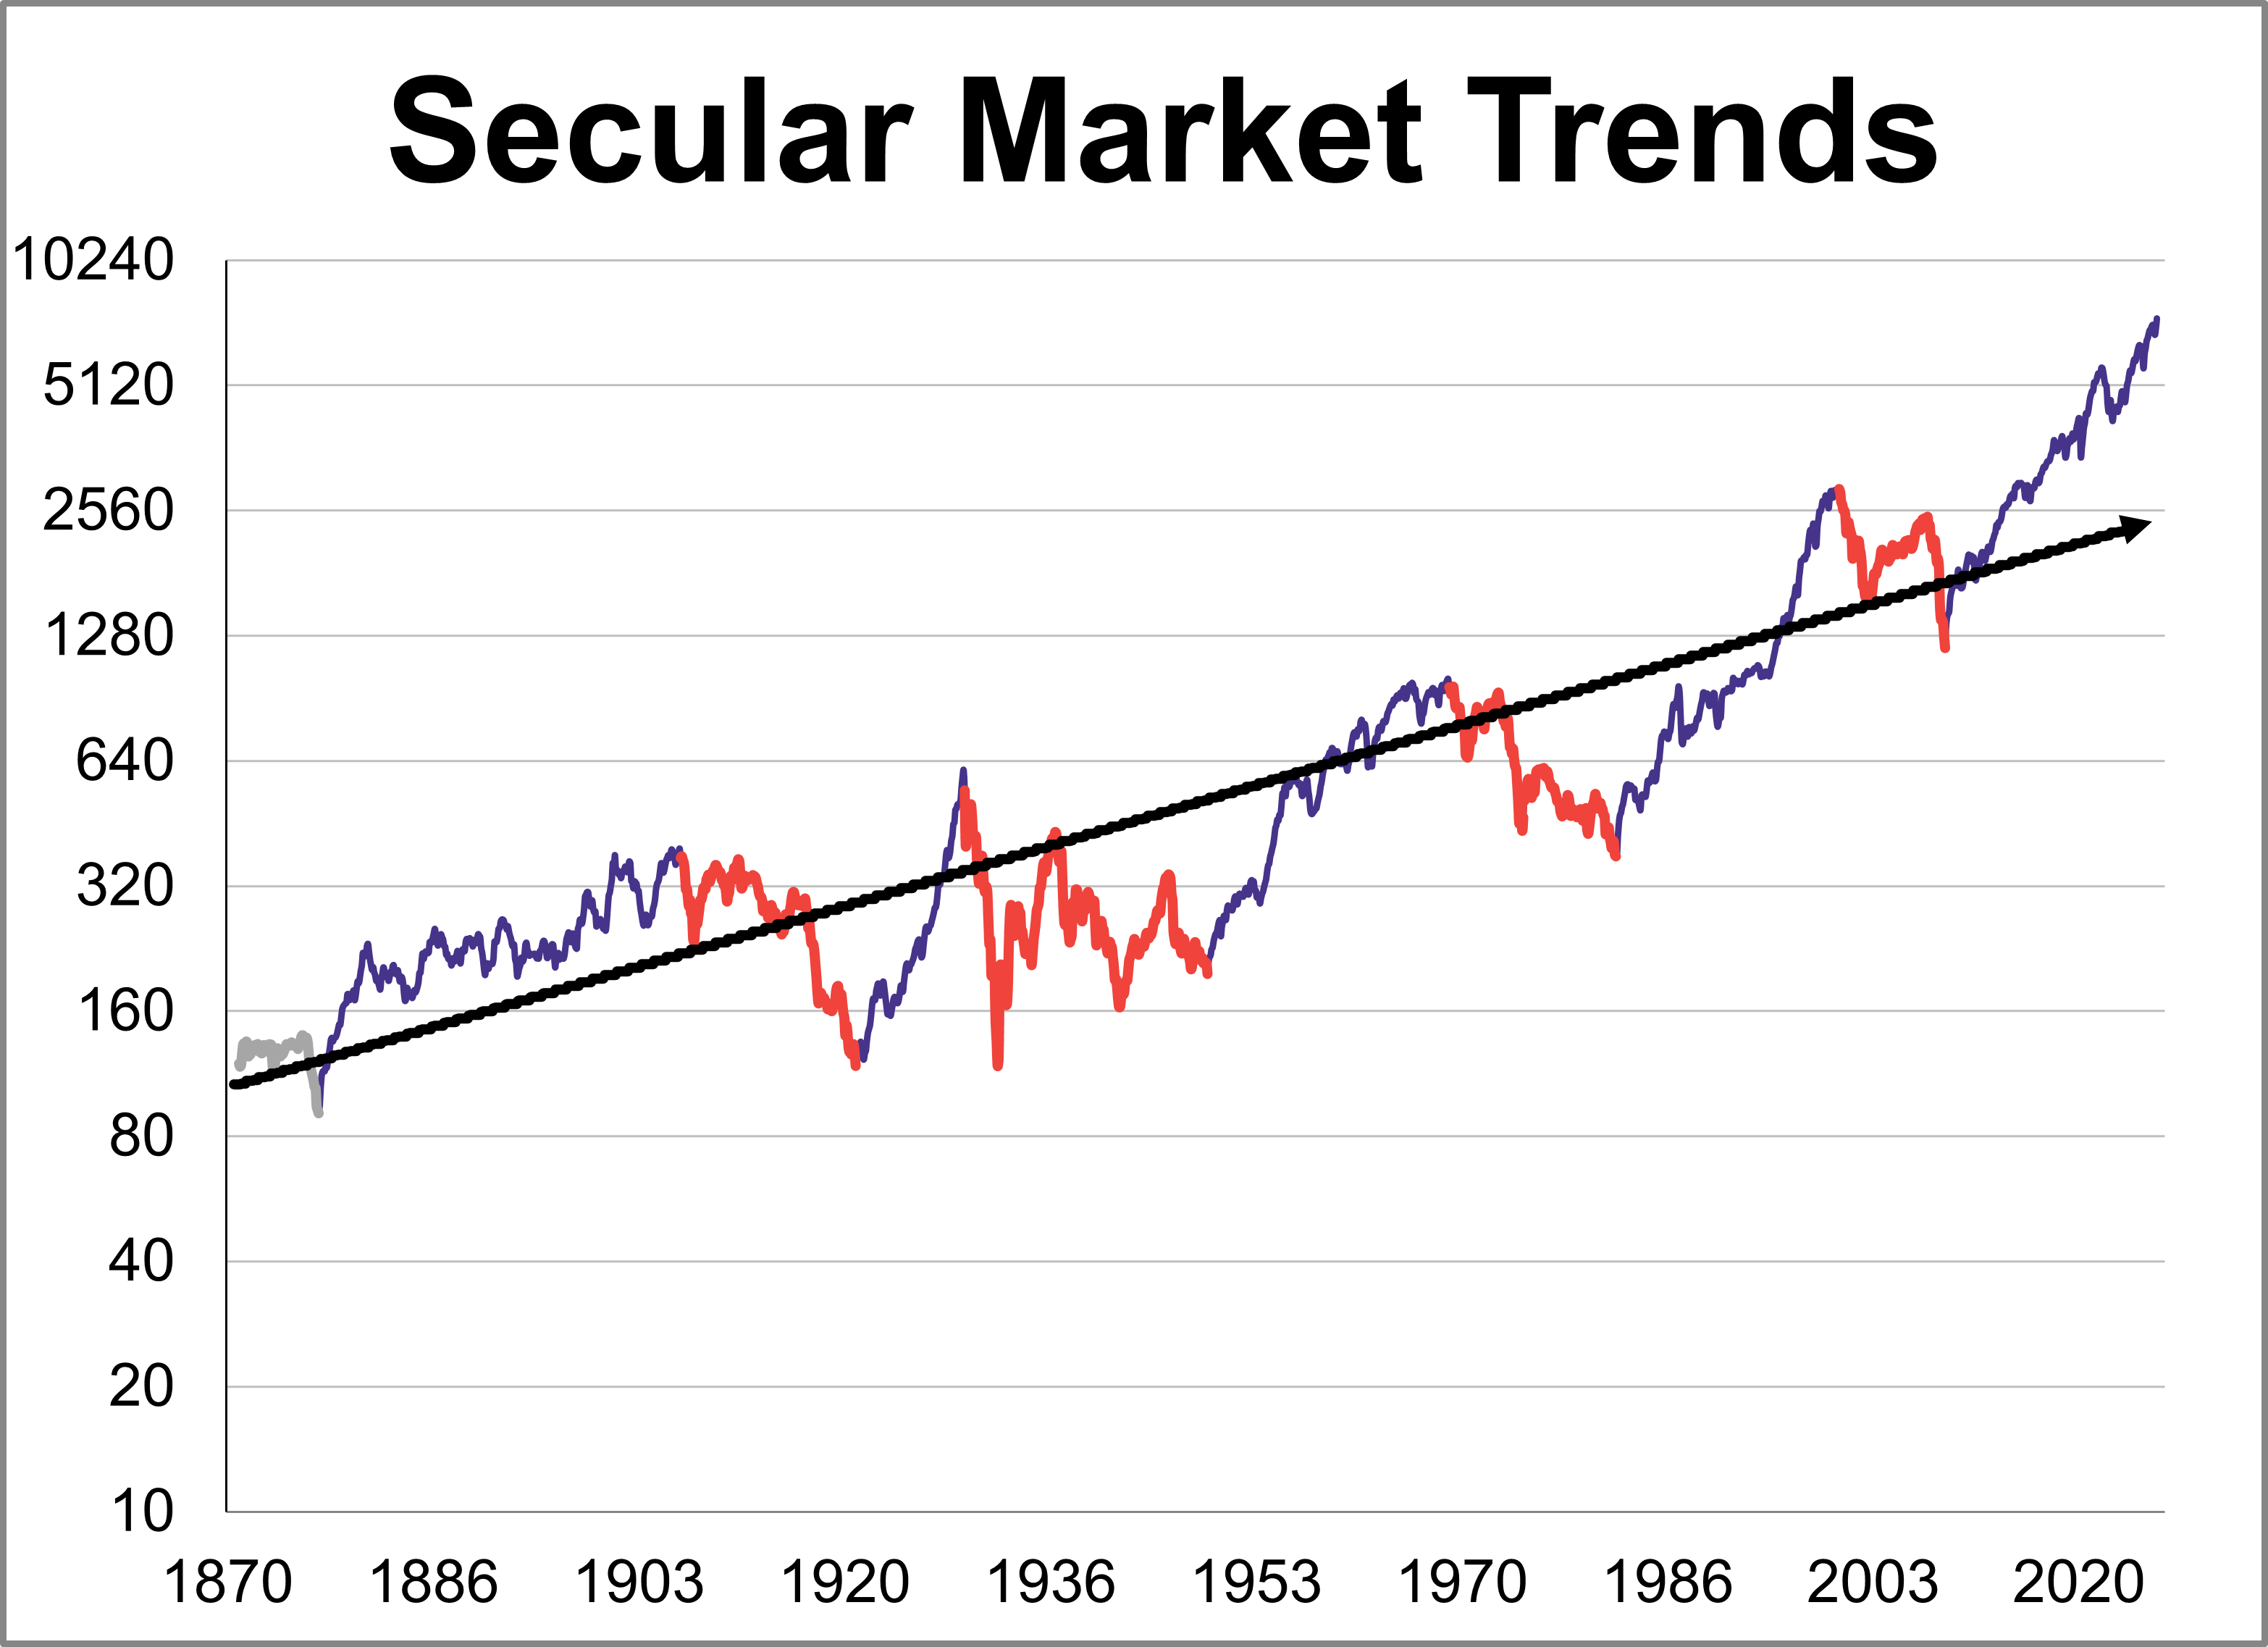
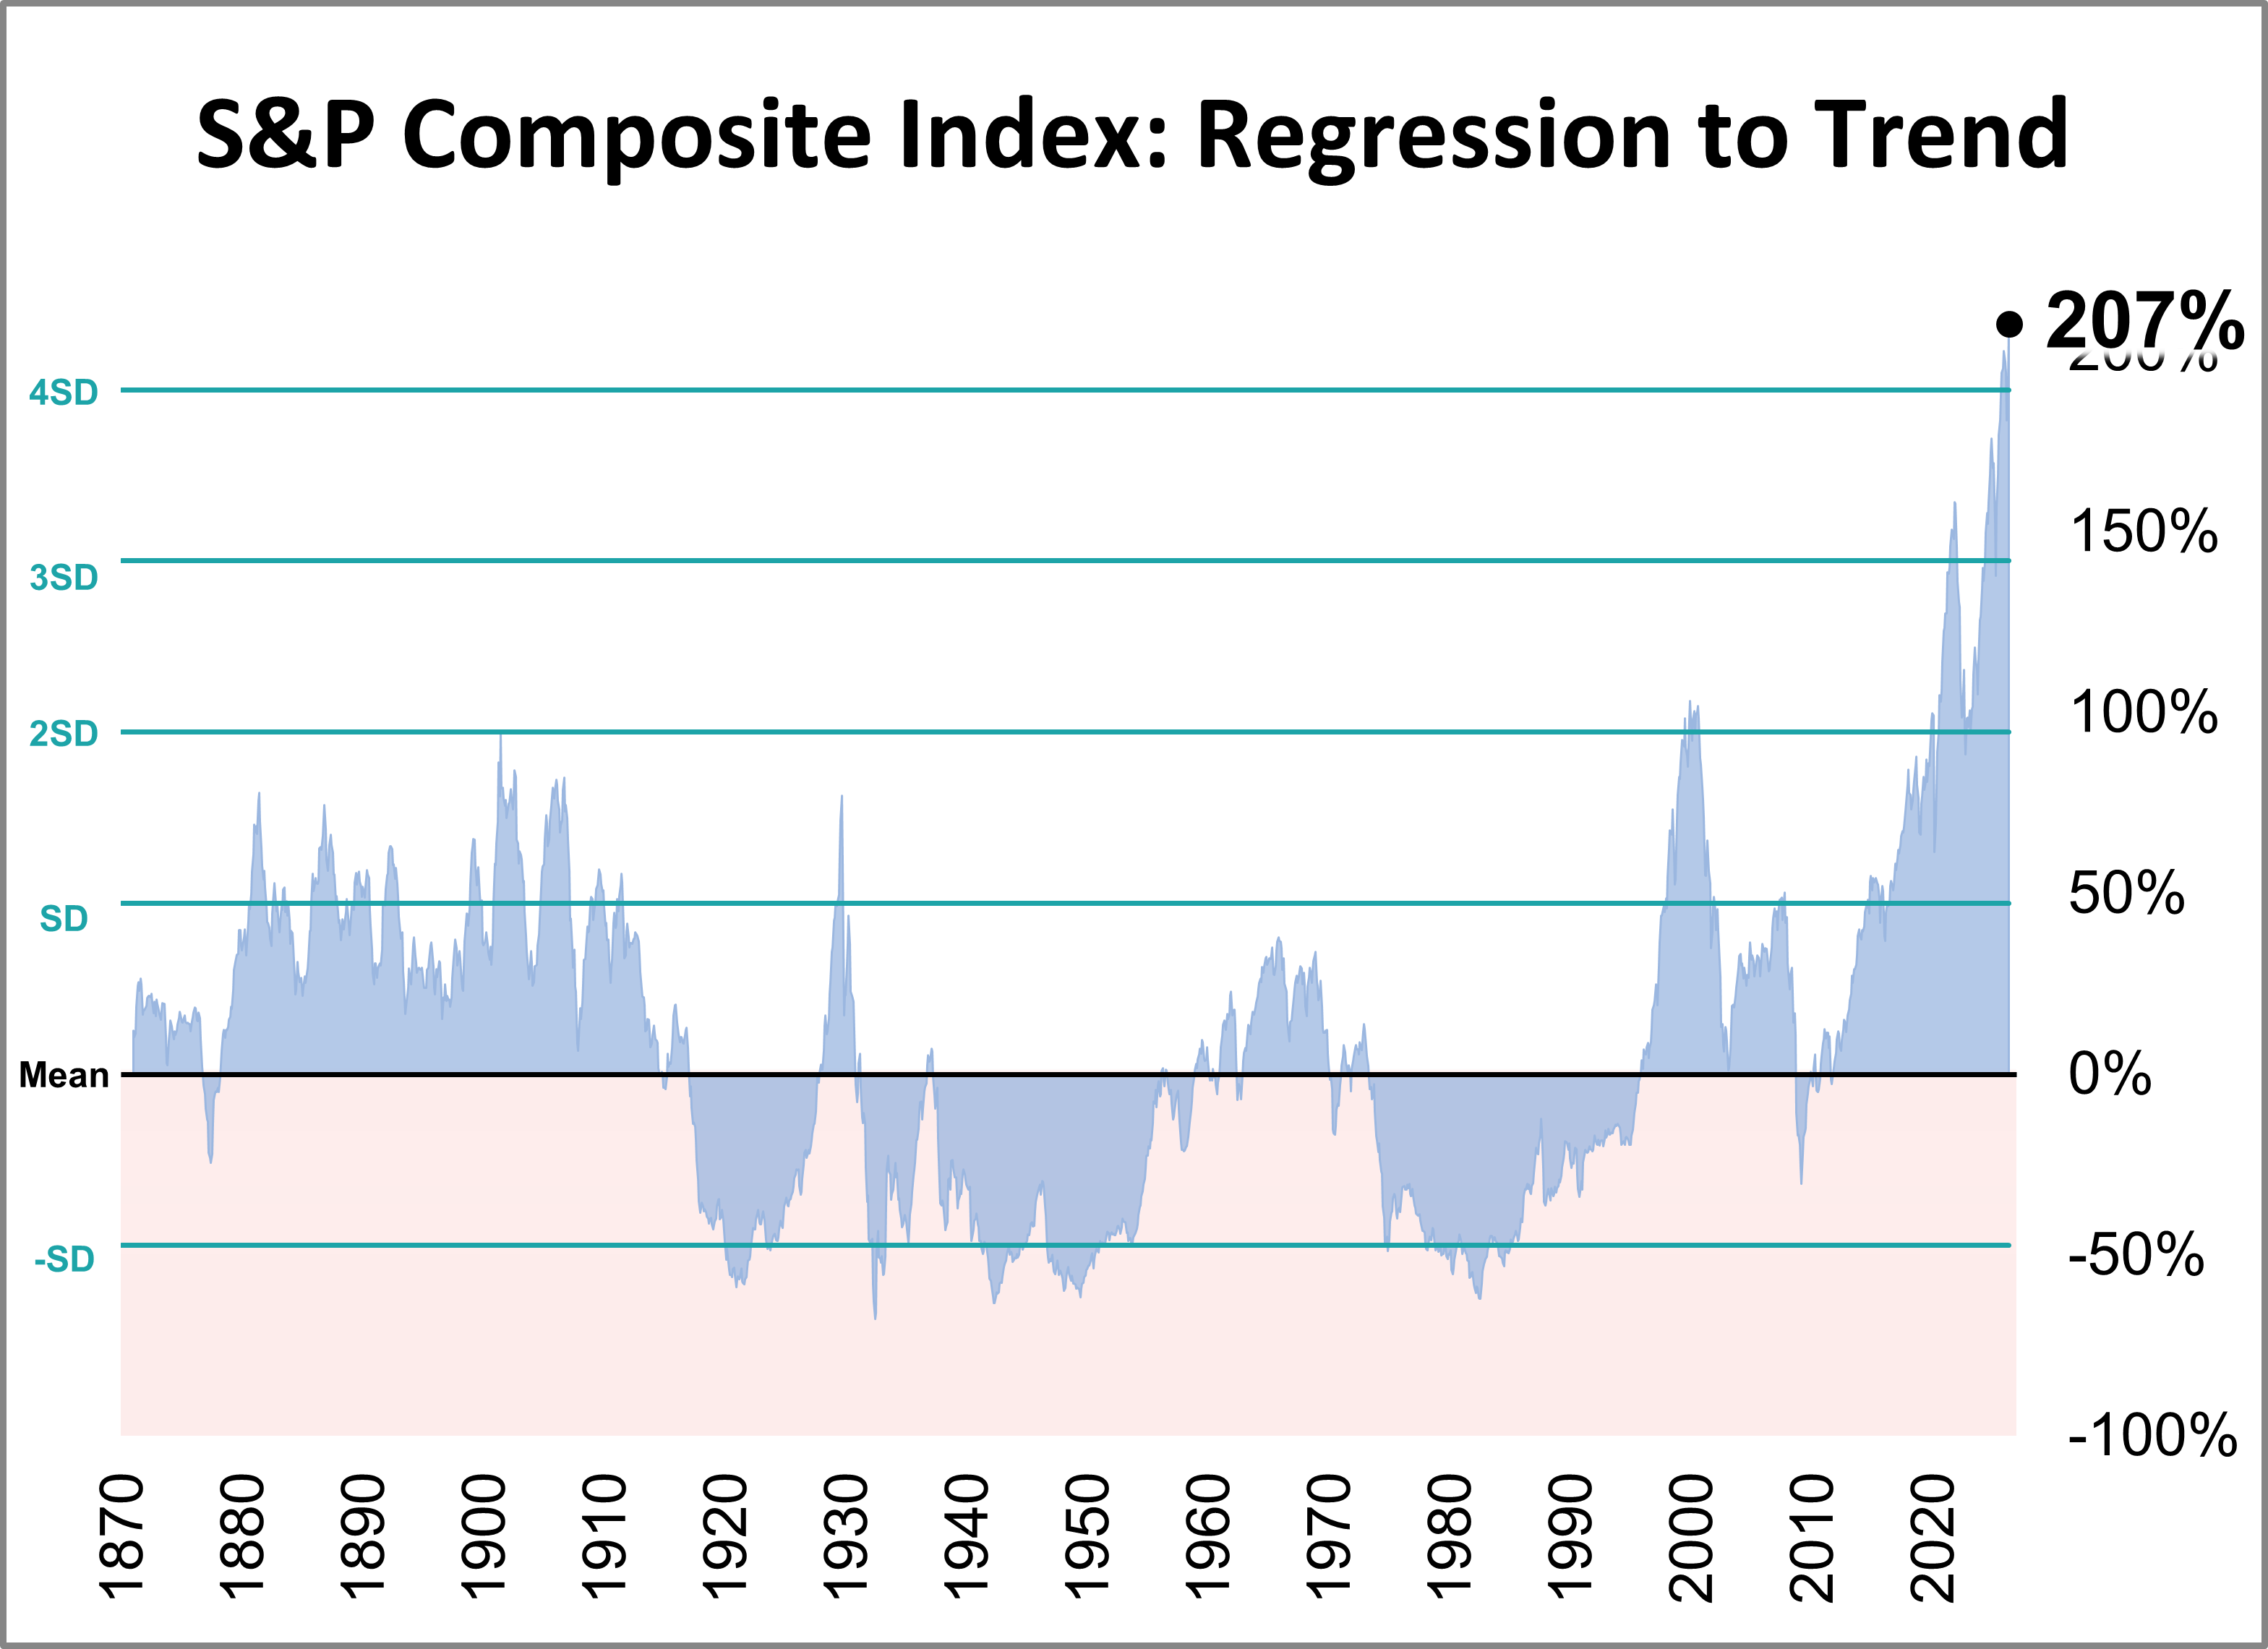
The inflation-adjusted S&P Composite Index was 207% above its long-term trend at the end of May.
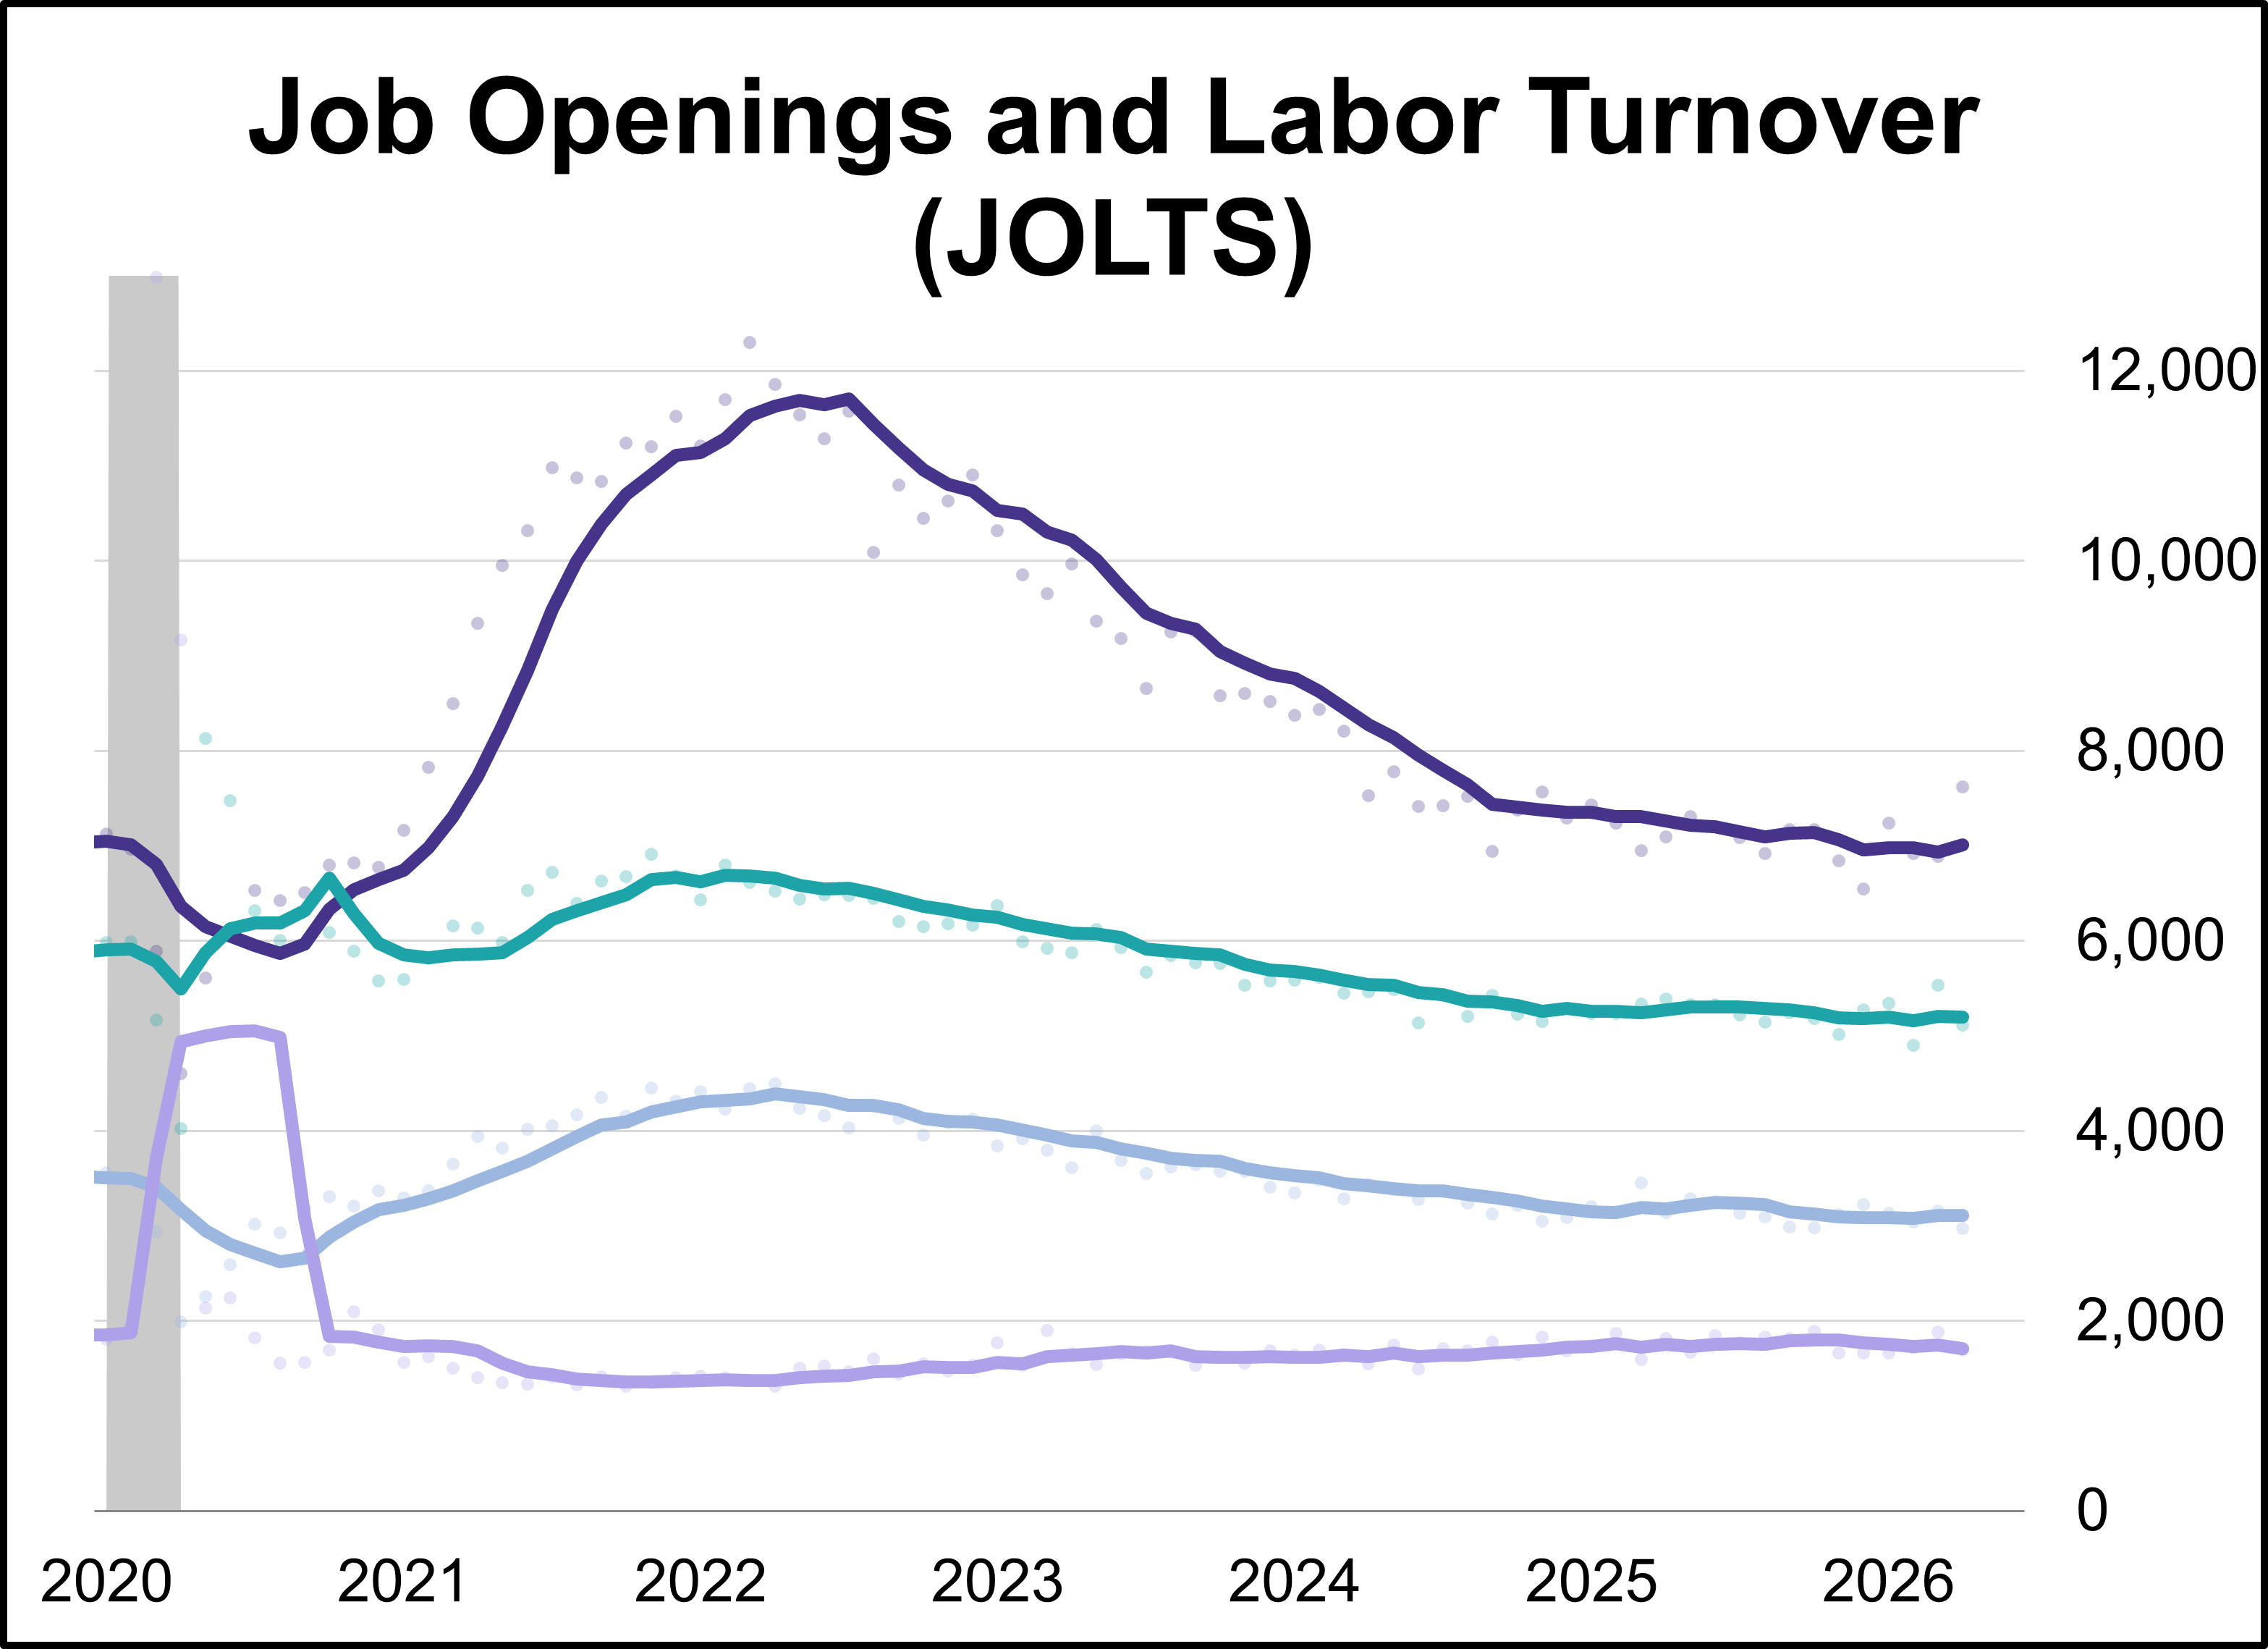
Job openings jumped to their highest level in nearly two years in April, reaching 7.618 million vacancies according to the latest Job Openings and Labor Turnover Survey (JOLTS). This represents an increase of 731,000 from the previous month, the largest monthly rise since 2021.
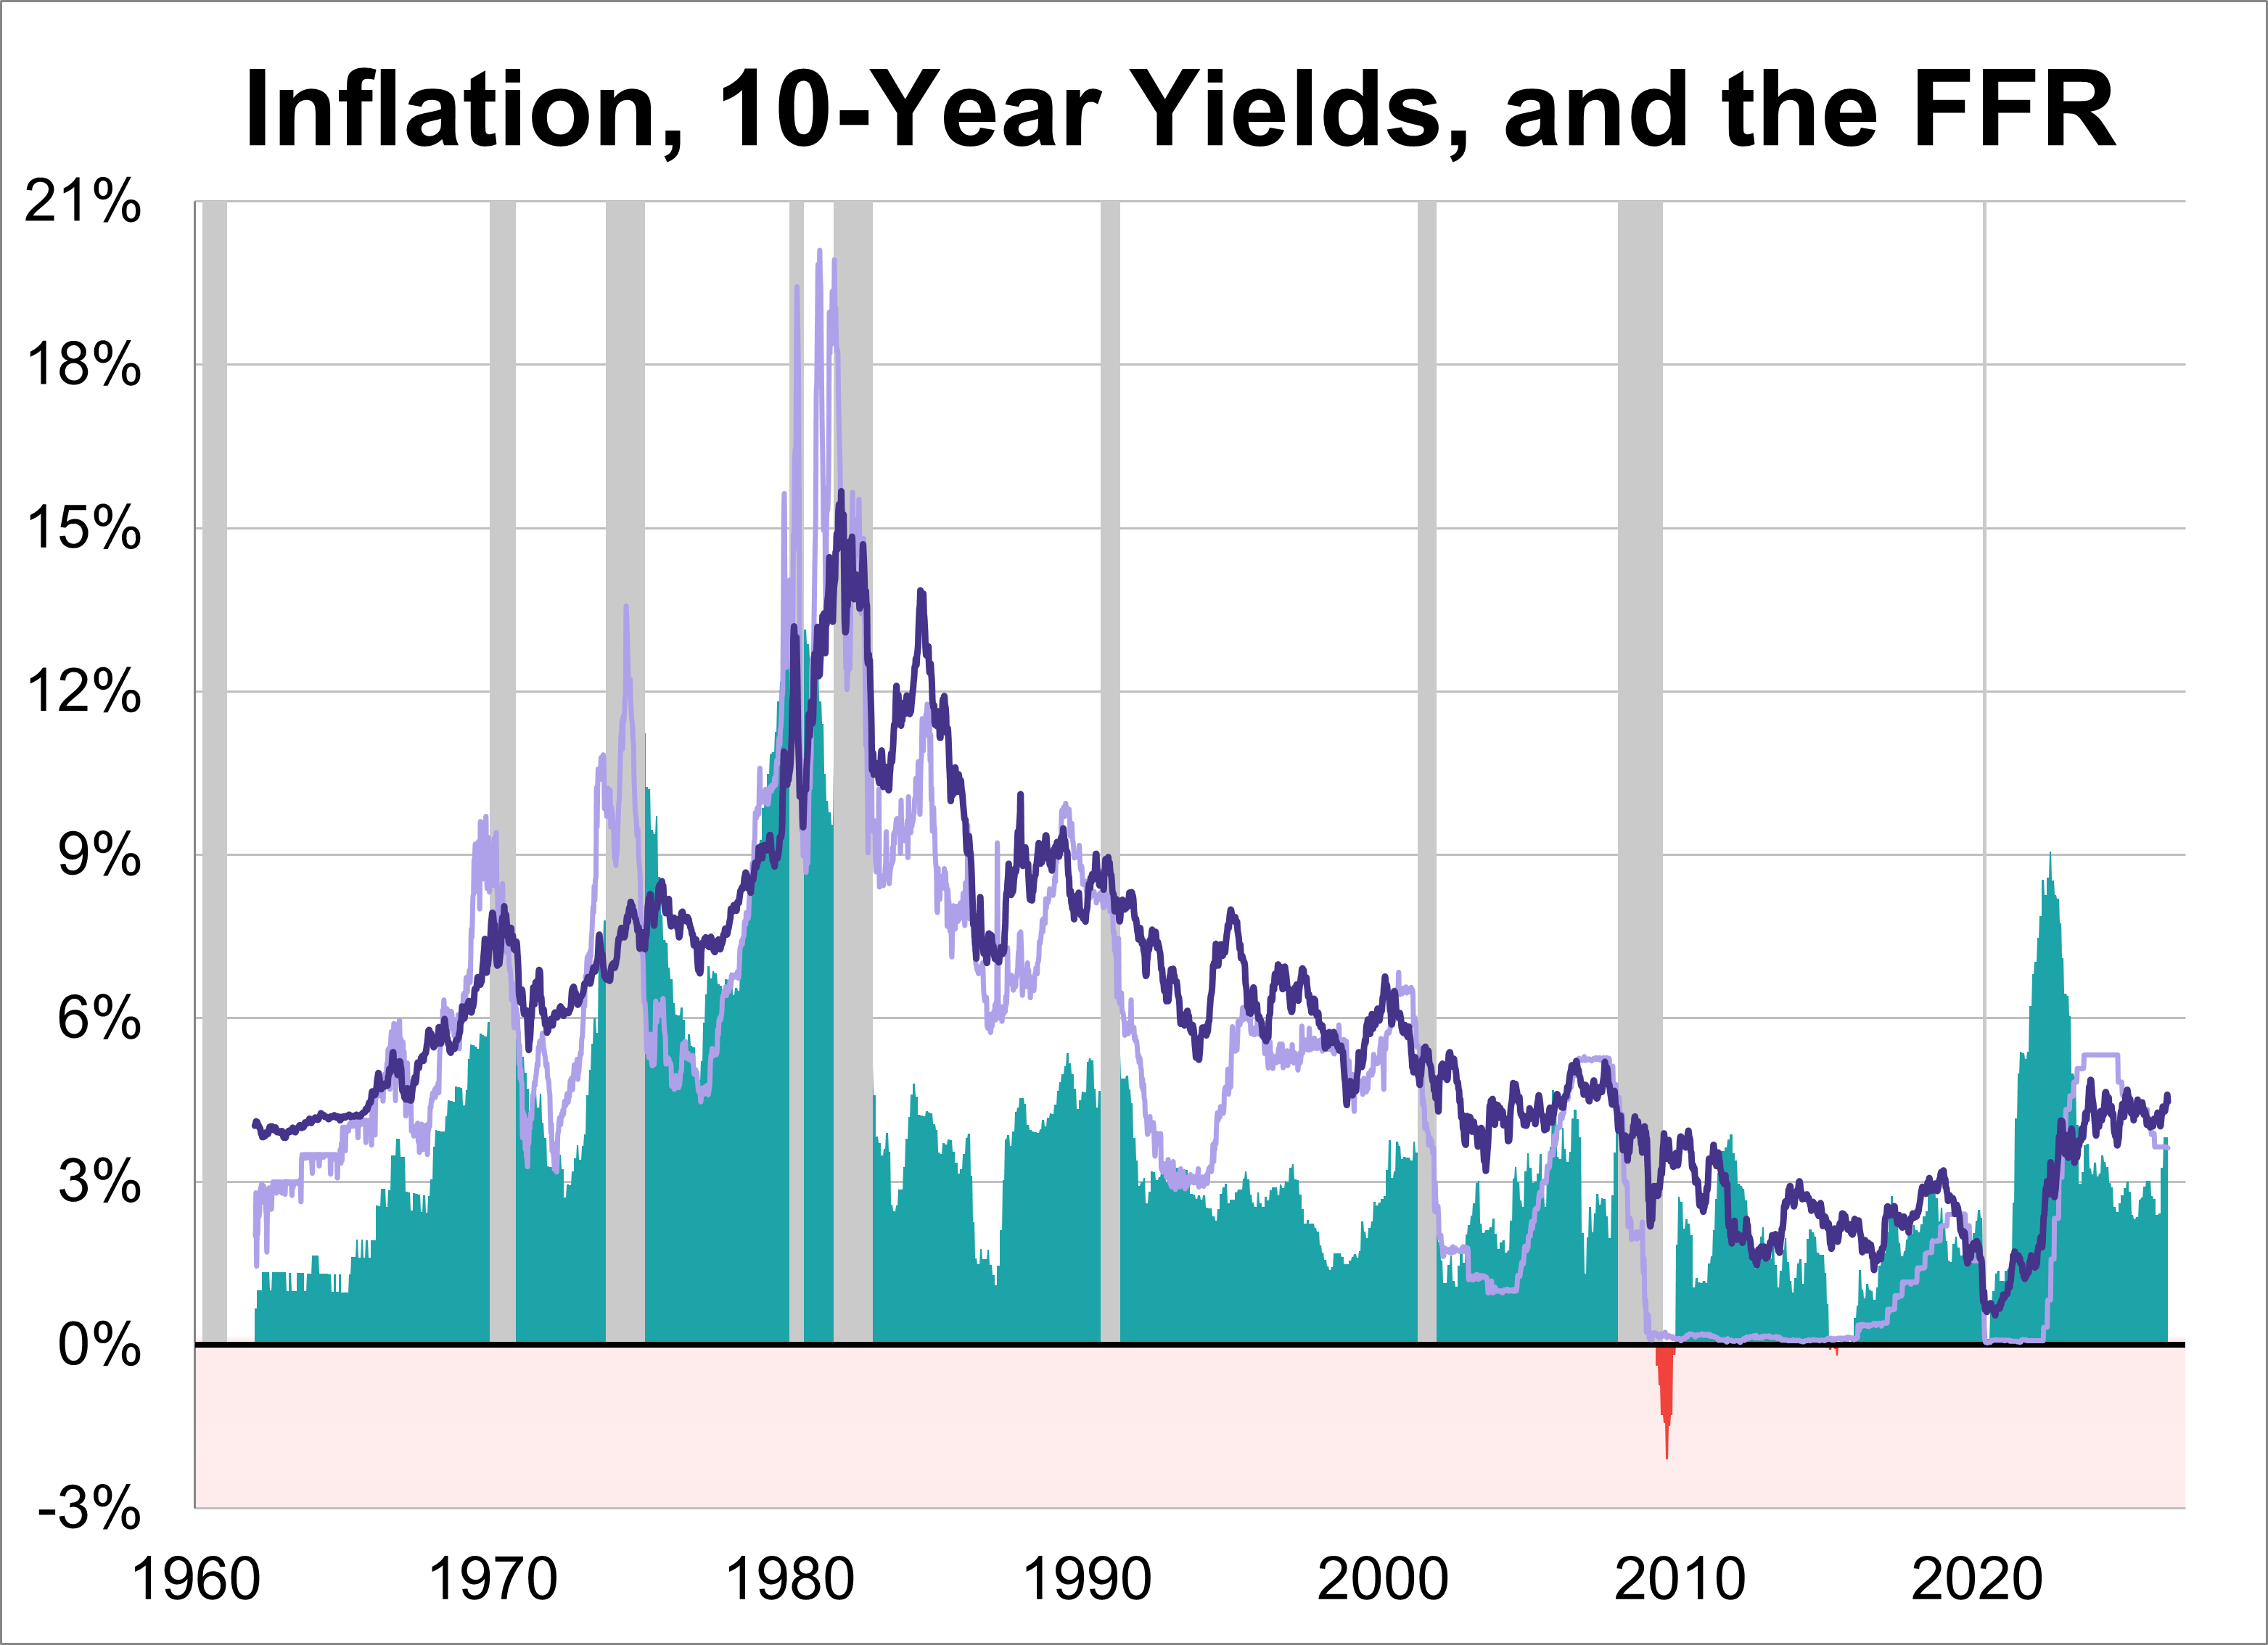
The 10-year Treasury yield has experienced dramatic fluctuations, ranging from a peak of 15.68% in October 1981, during the height of the Volcker era, to a historic low of 0.55% in August 2020, amidst the economic uncertainty of the pandemic. At the end of May 2026, the weekly average stood at 4.47%.
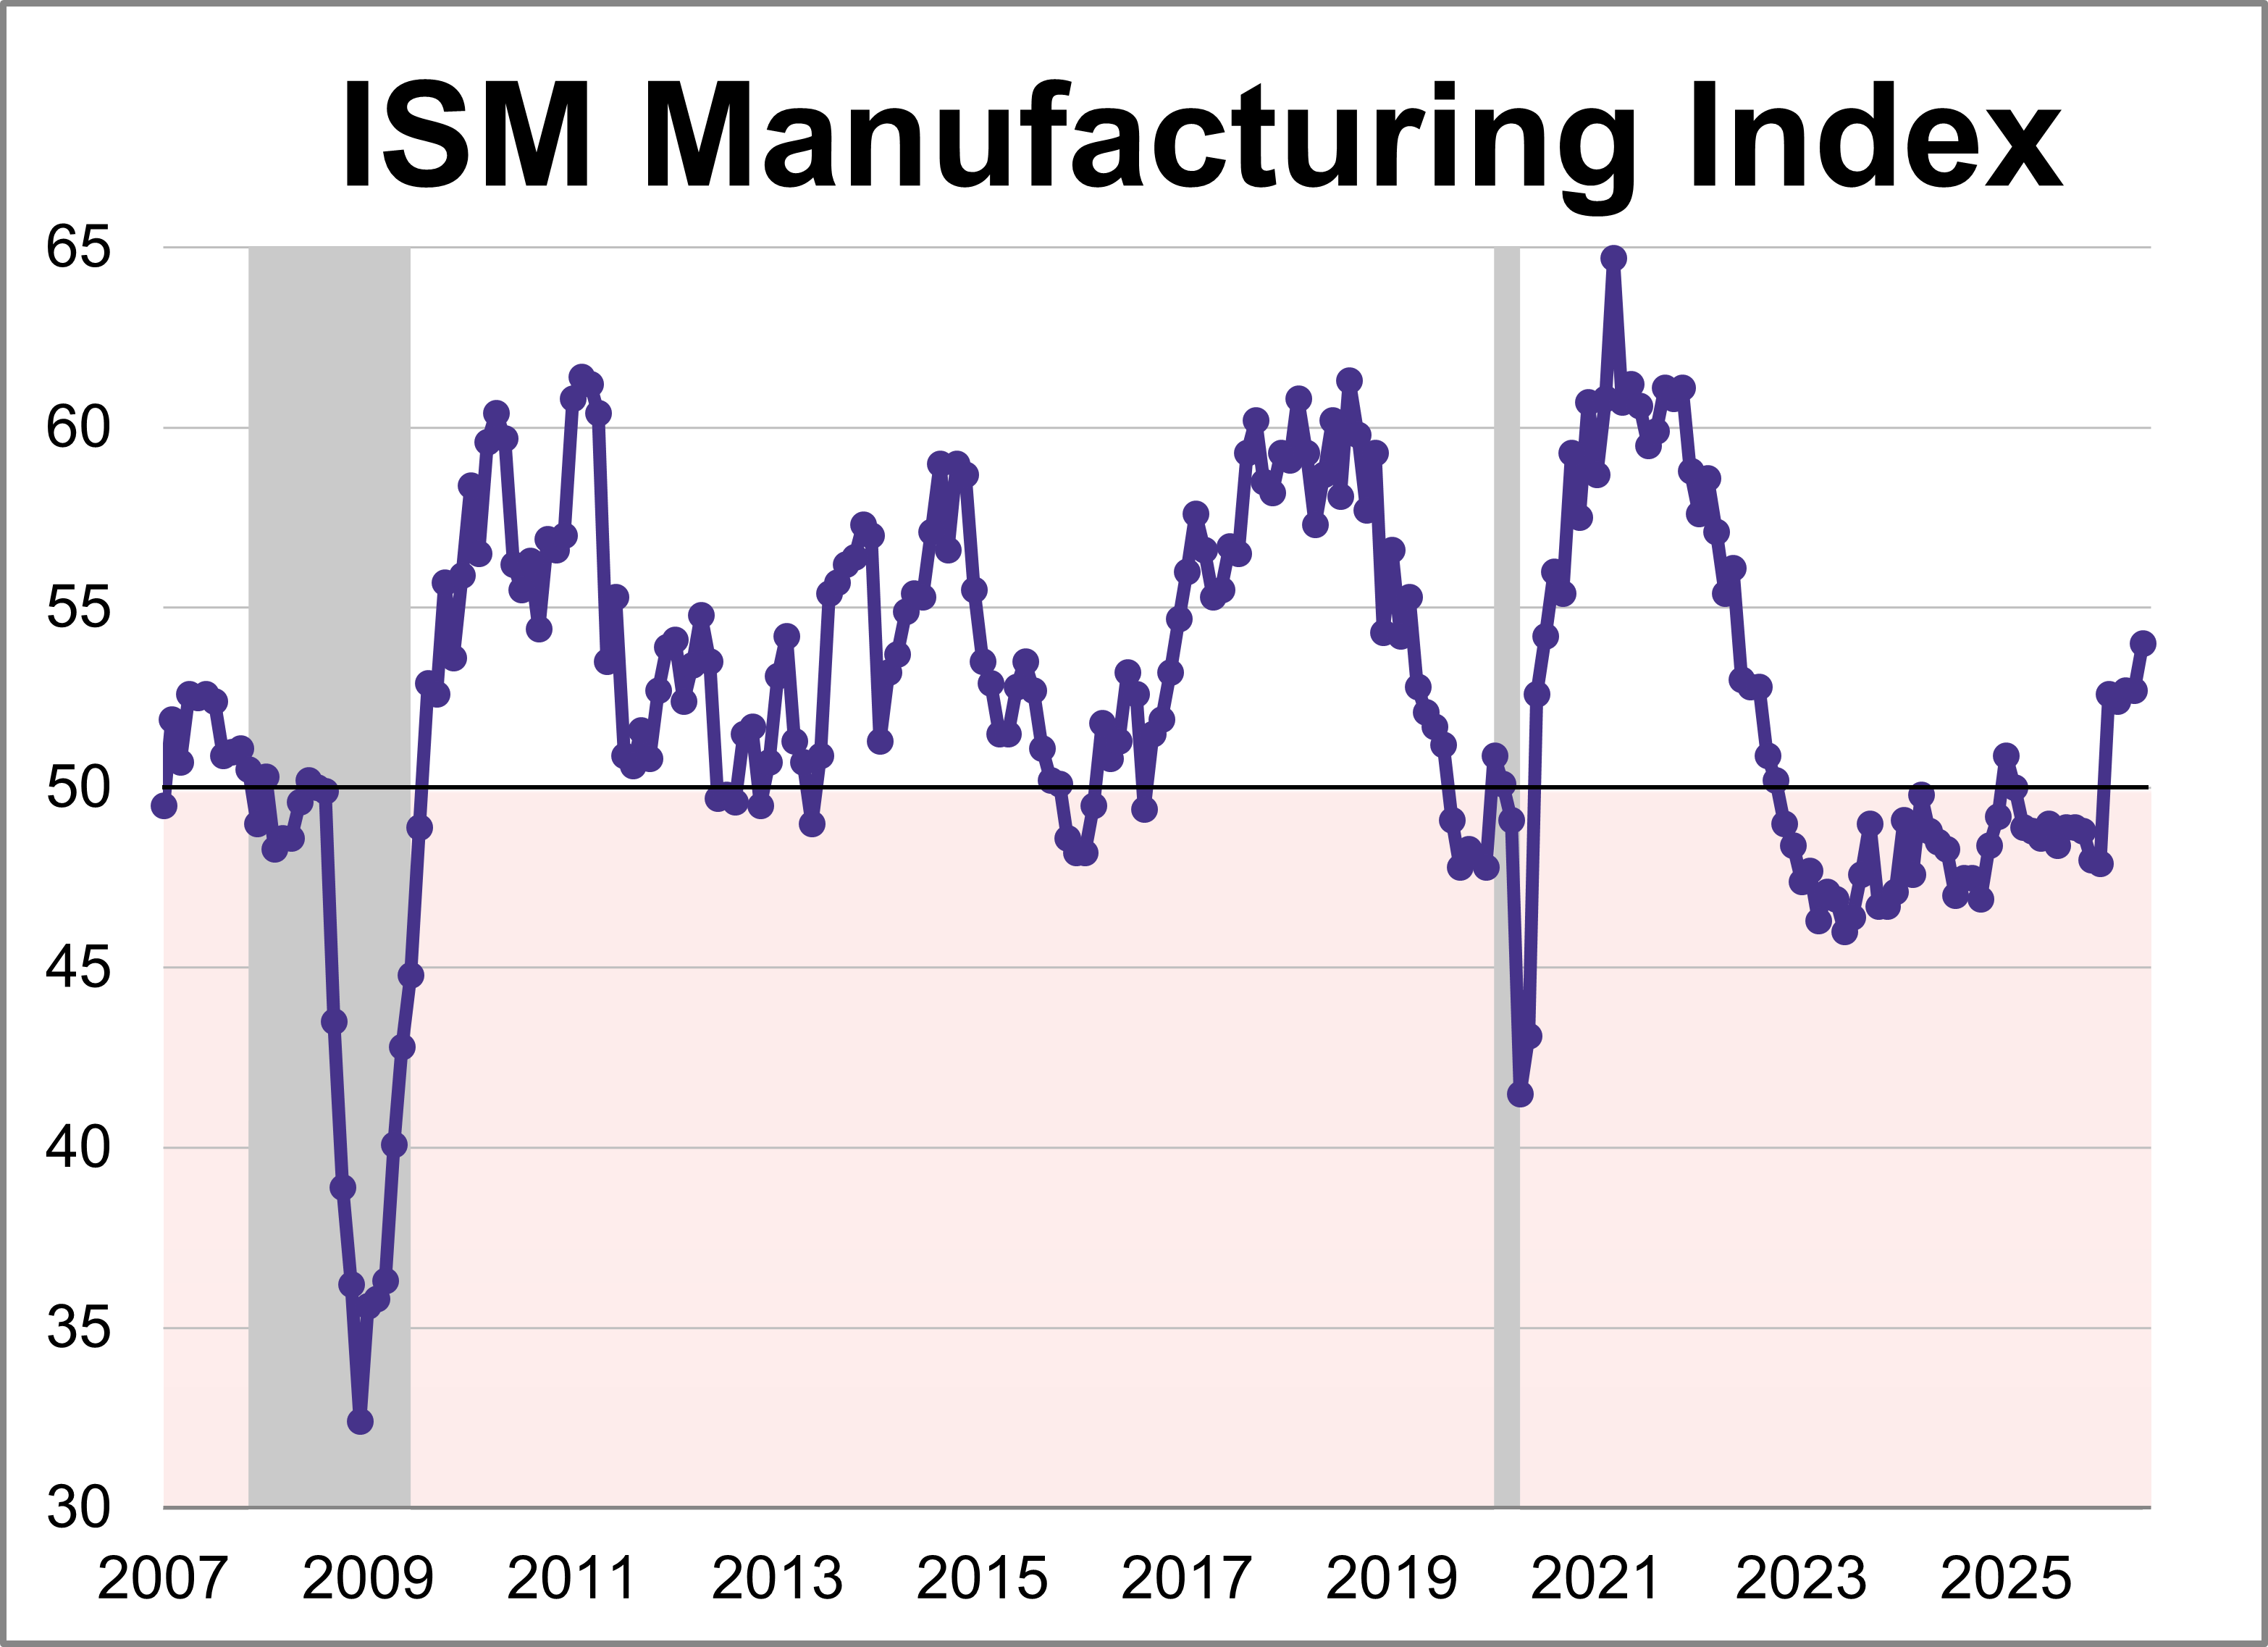
The Institute for Supply Management (ISM) manufacturing purchasing managers index (PMI) came in at 54.0 in May, marking the fastest expansion for the index since May 2022. The latest reading was higher than the 53.3 forecast and is the index's fifth straight month in expansion territory.
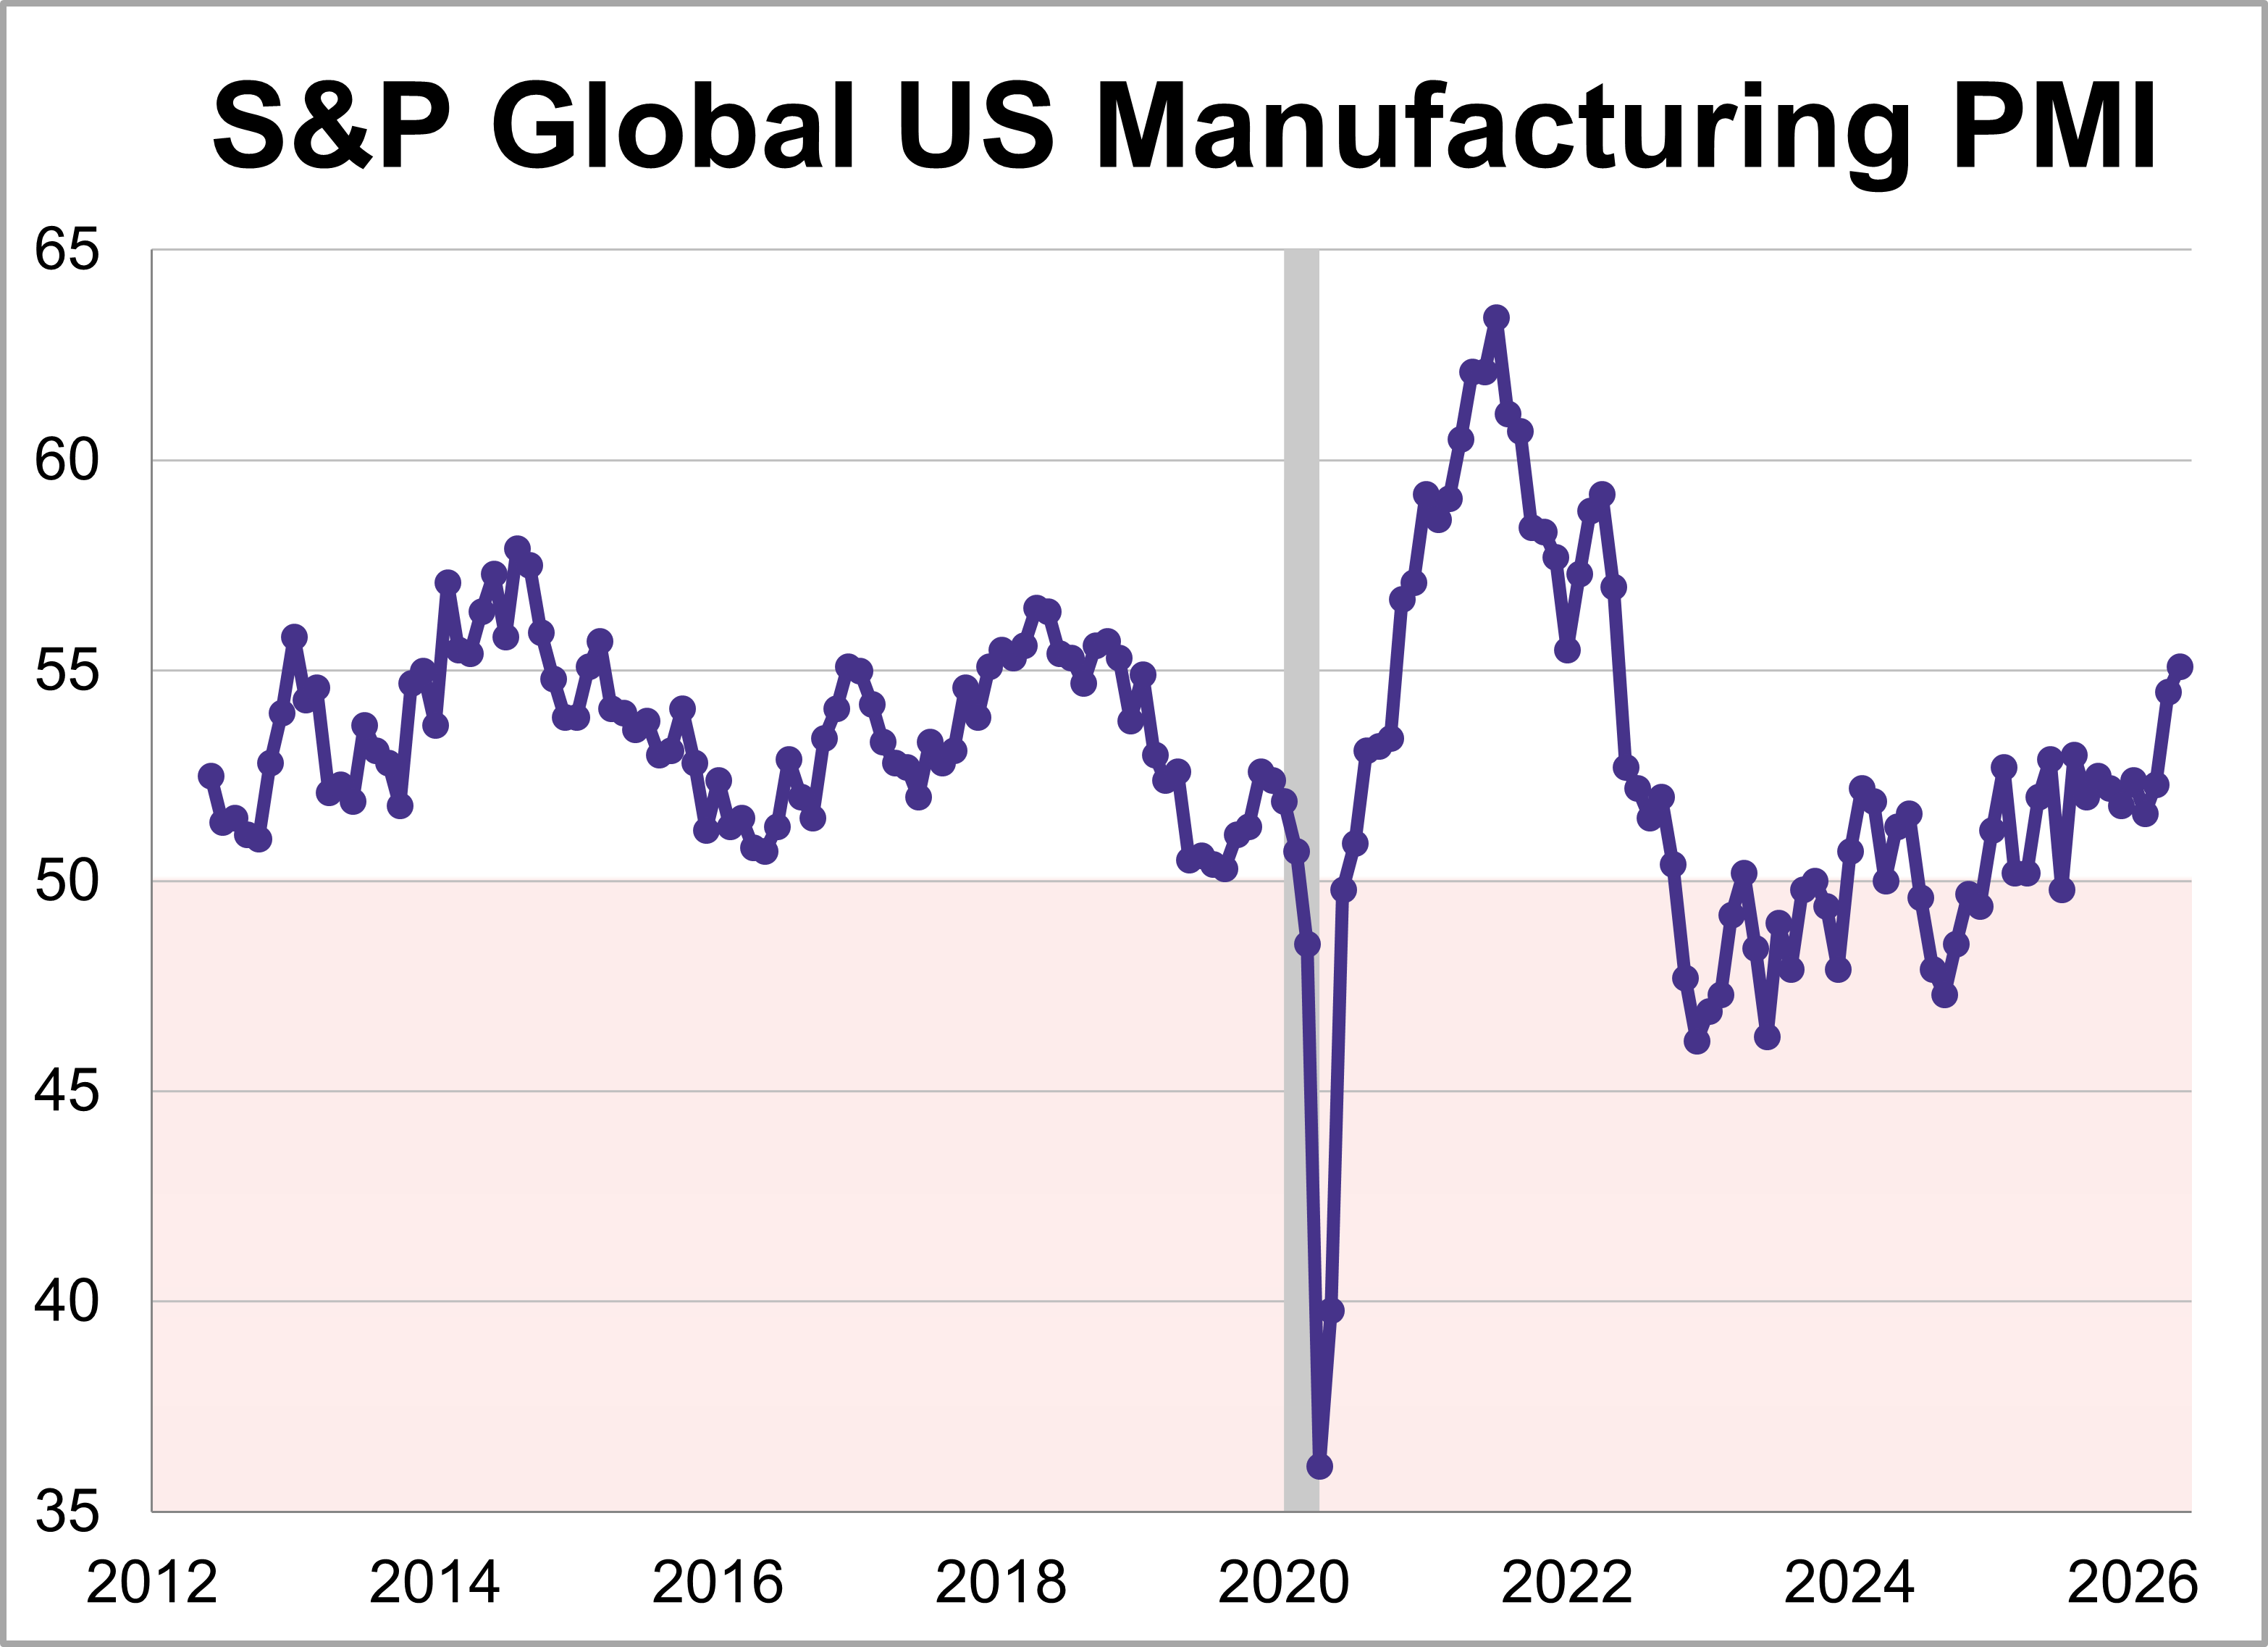
U.S. manufacturing hit its highest level in four years, as the S&P Global PMI climbed 0.6 points to 55.1 in May. For a second straight month, the expansion was largely driven by defensive stockpiling as companies continue bracing for supply disruptions and price hikes linked to conflict in the Middle East.
Last week’s data tracked a shifting economic trajectory over the last several months. While the latest reading on first-quarter GDP confirms the economy started the year with steady growth, subsequent inflation metrics moved higher and ultimately weighed on consumer confidence.
Valid until the market close on June 30, 2026
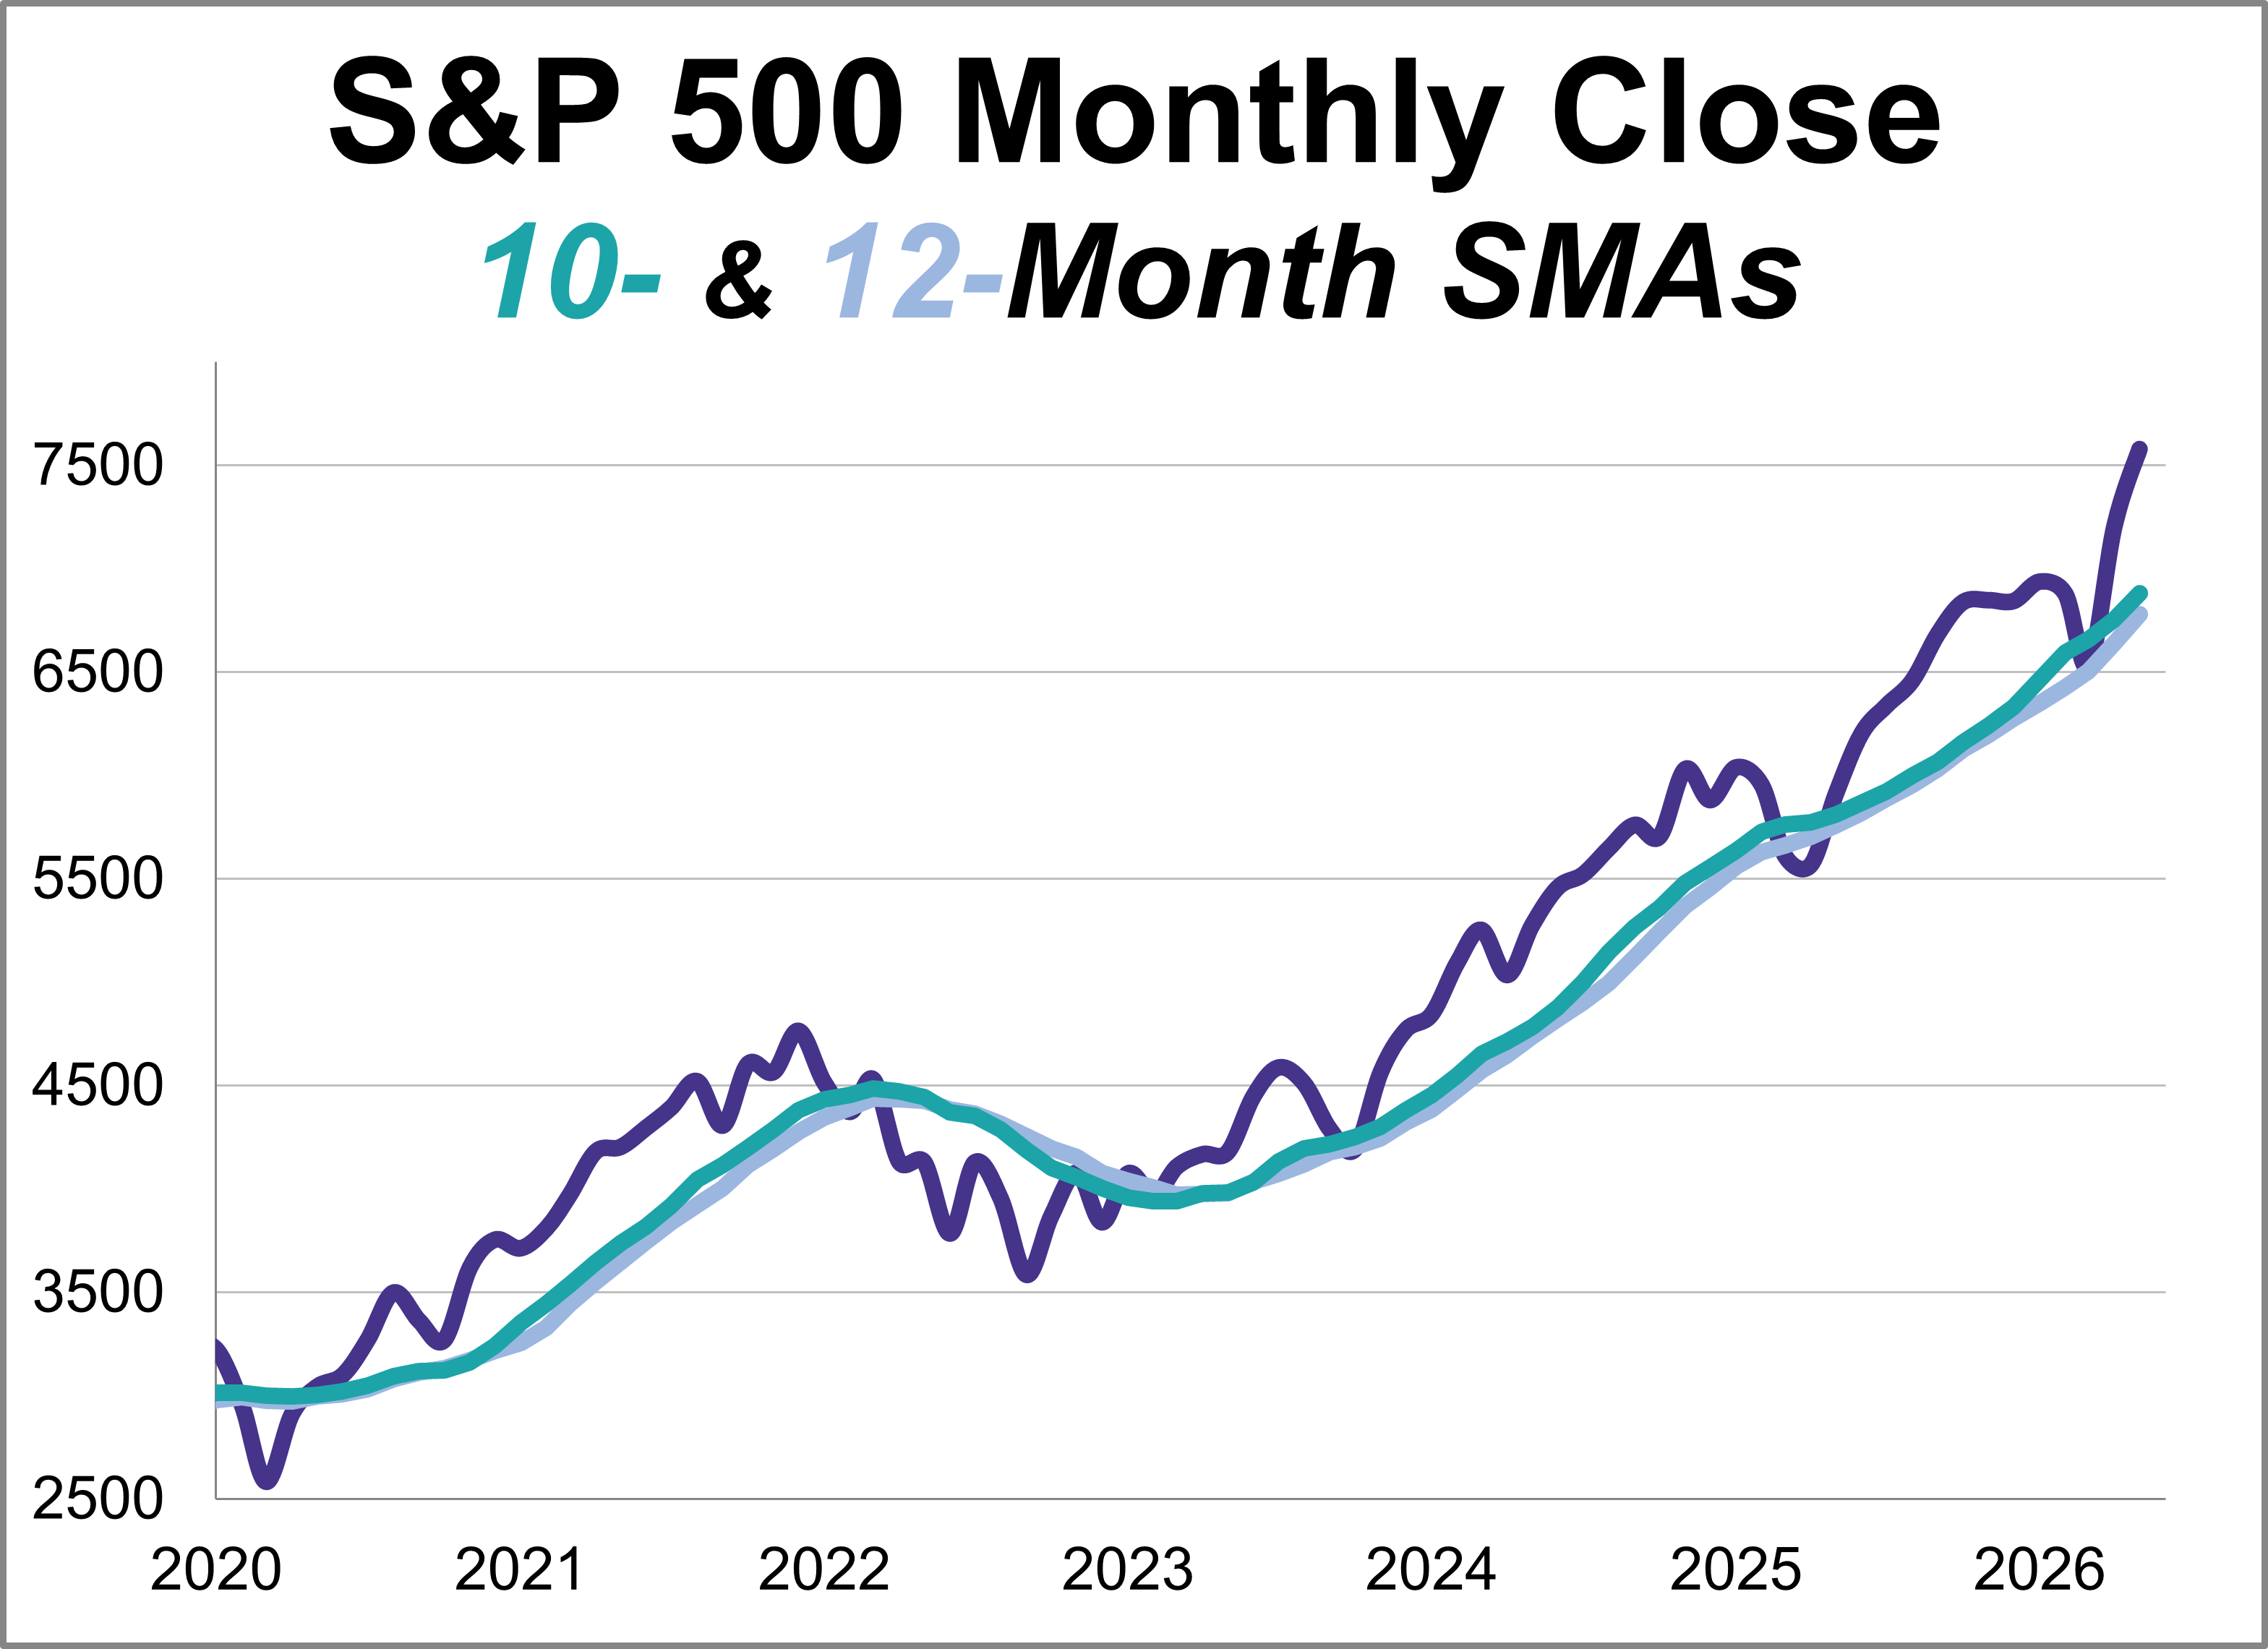
This article provides an update on the monthly moving averages we track for the S&P 500 and the Ivy Portfolio after the close of the last business day of the month.
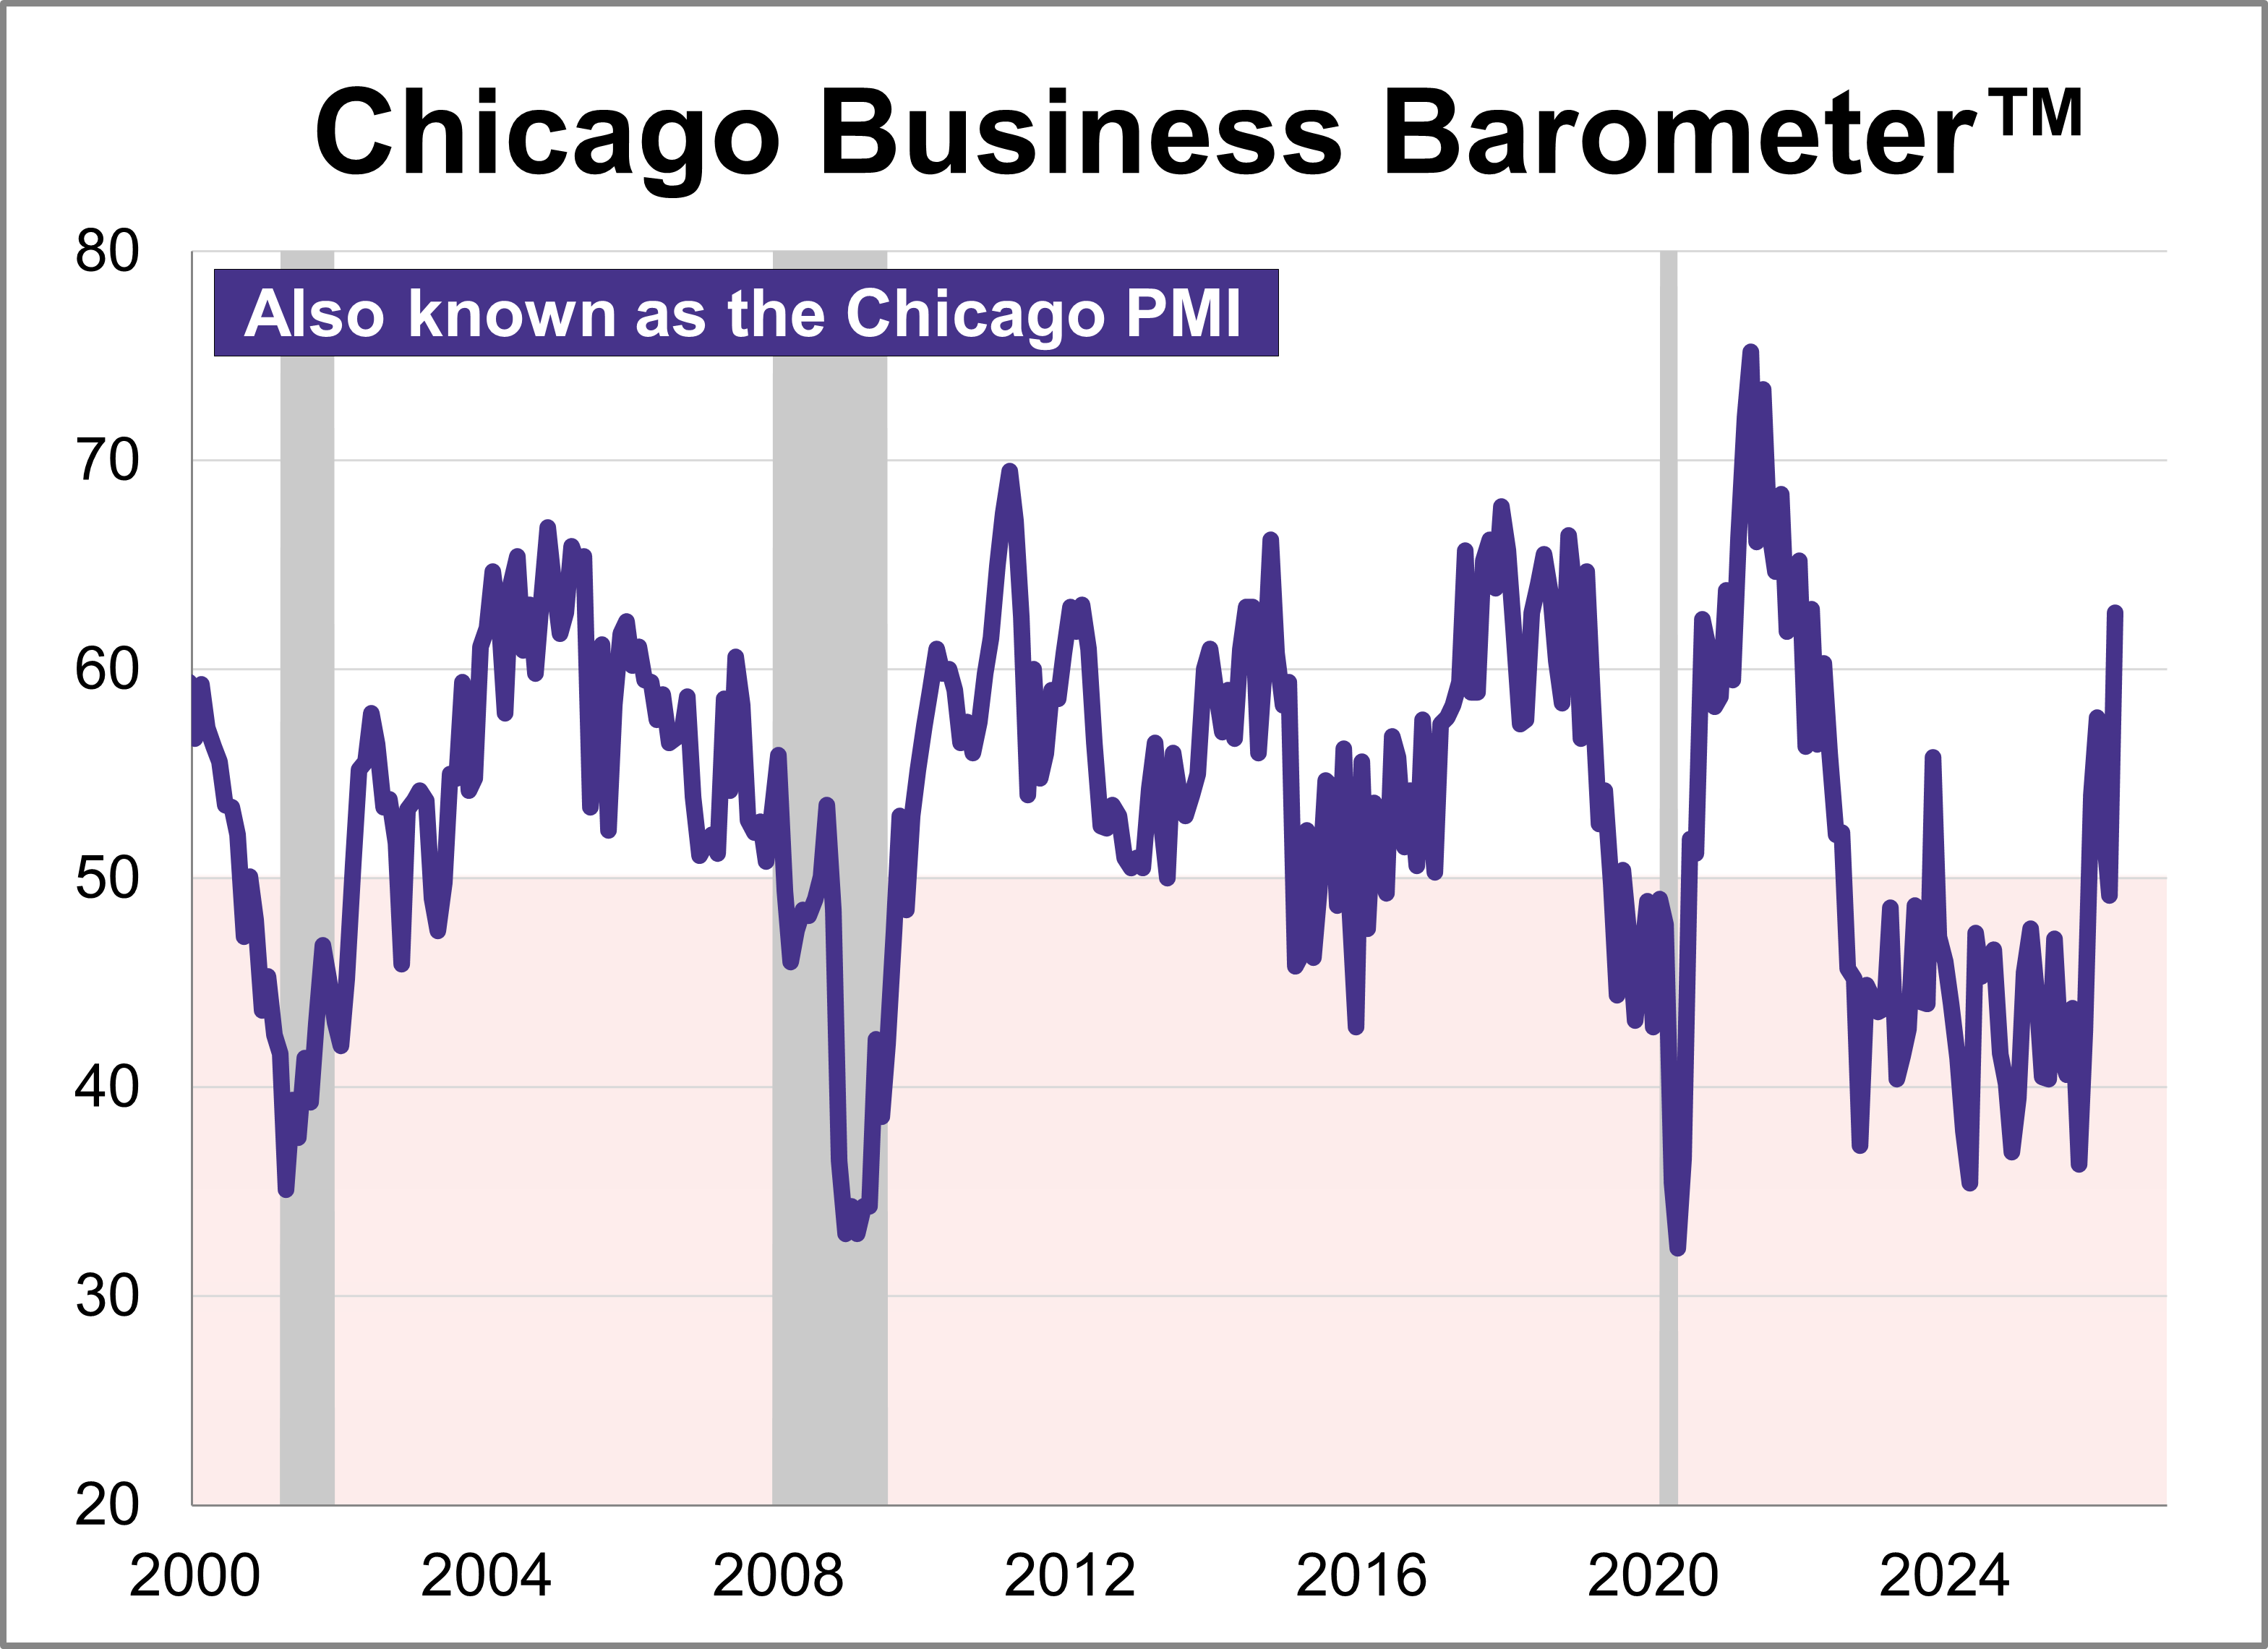
The Chicago Purchasing Managers’ Index surged 13.5 points in May to a four-year high of 62.7, signaling an expansion in regional business activity. This marks the largest monthly increase since 2020 and was significantly higher than the projected 50.6.
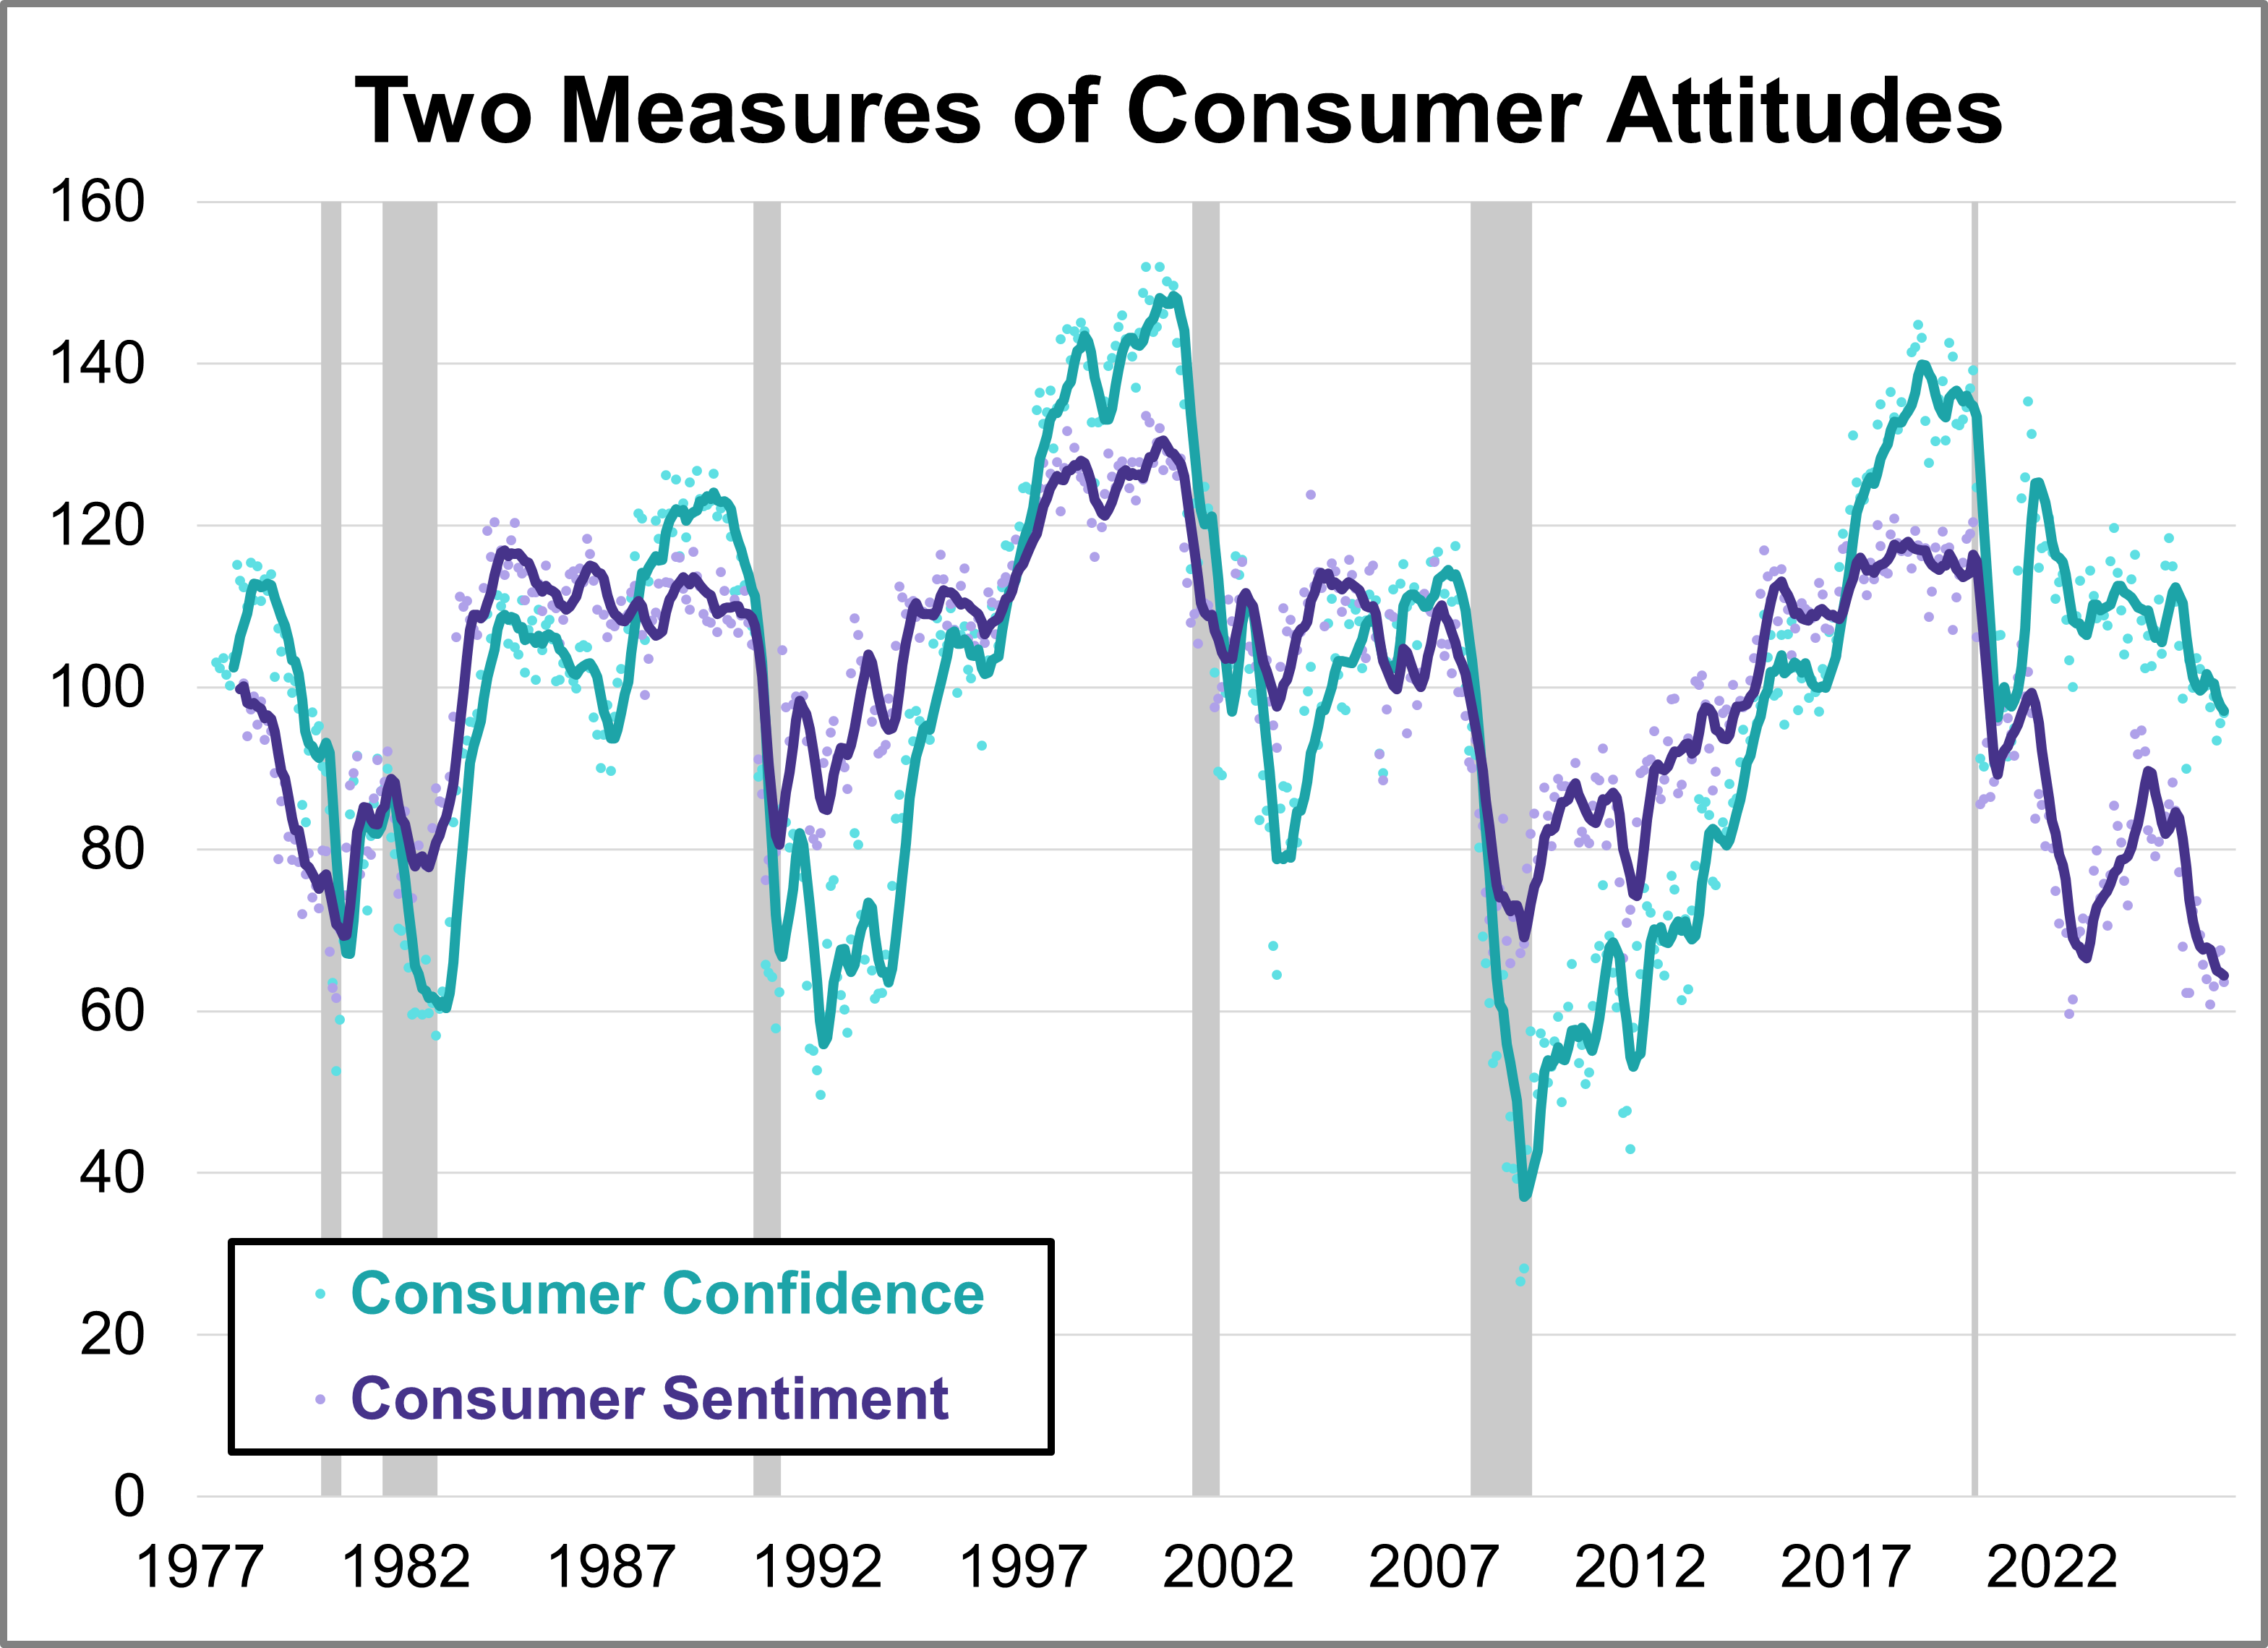
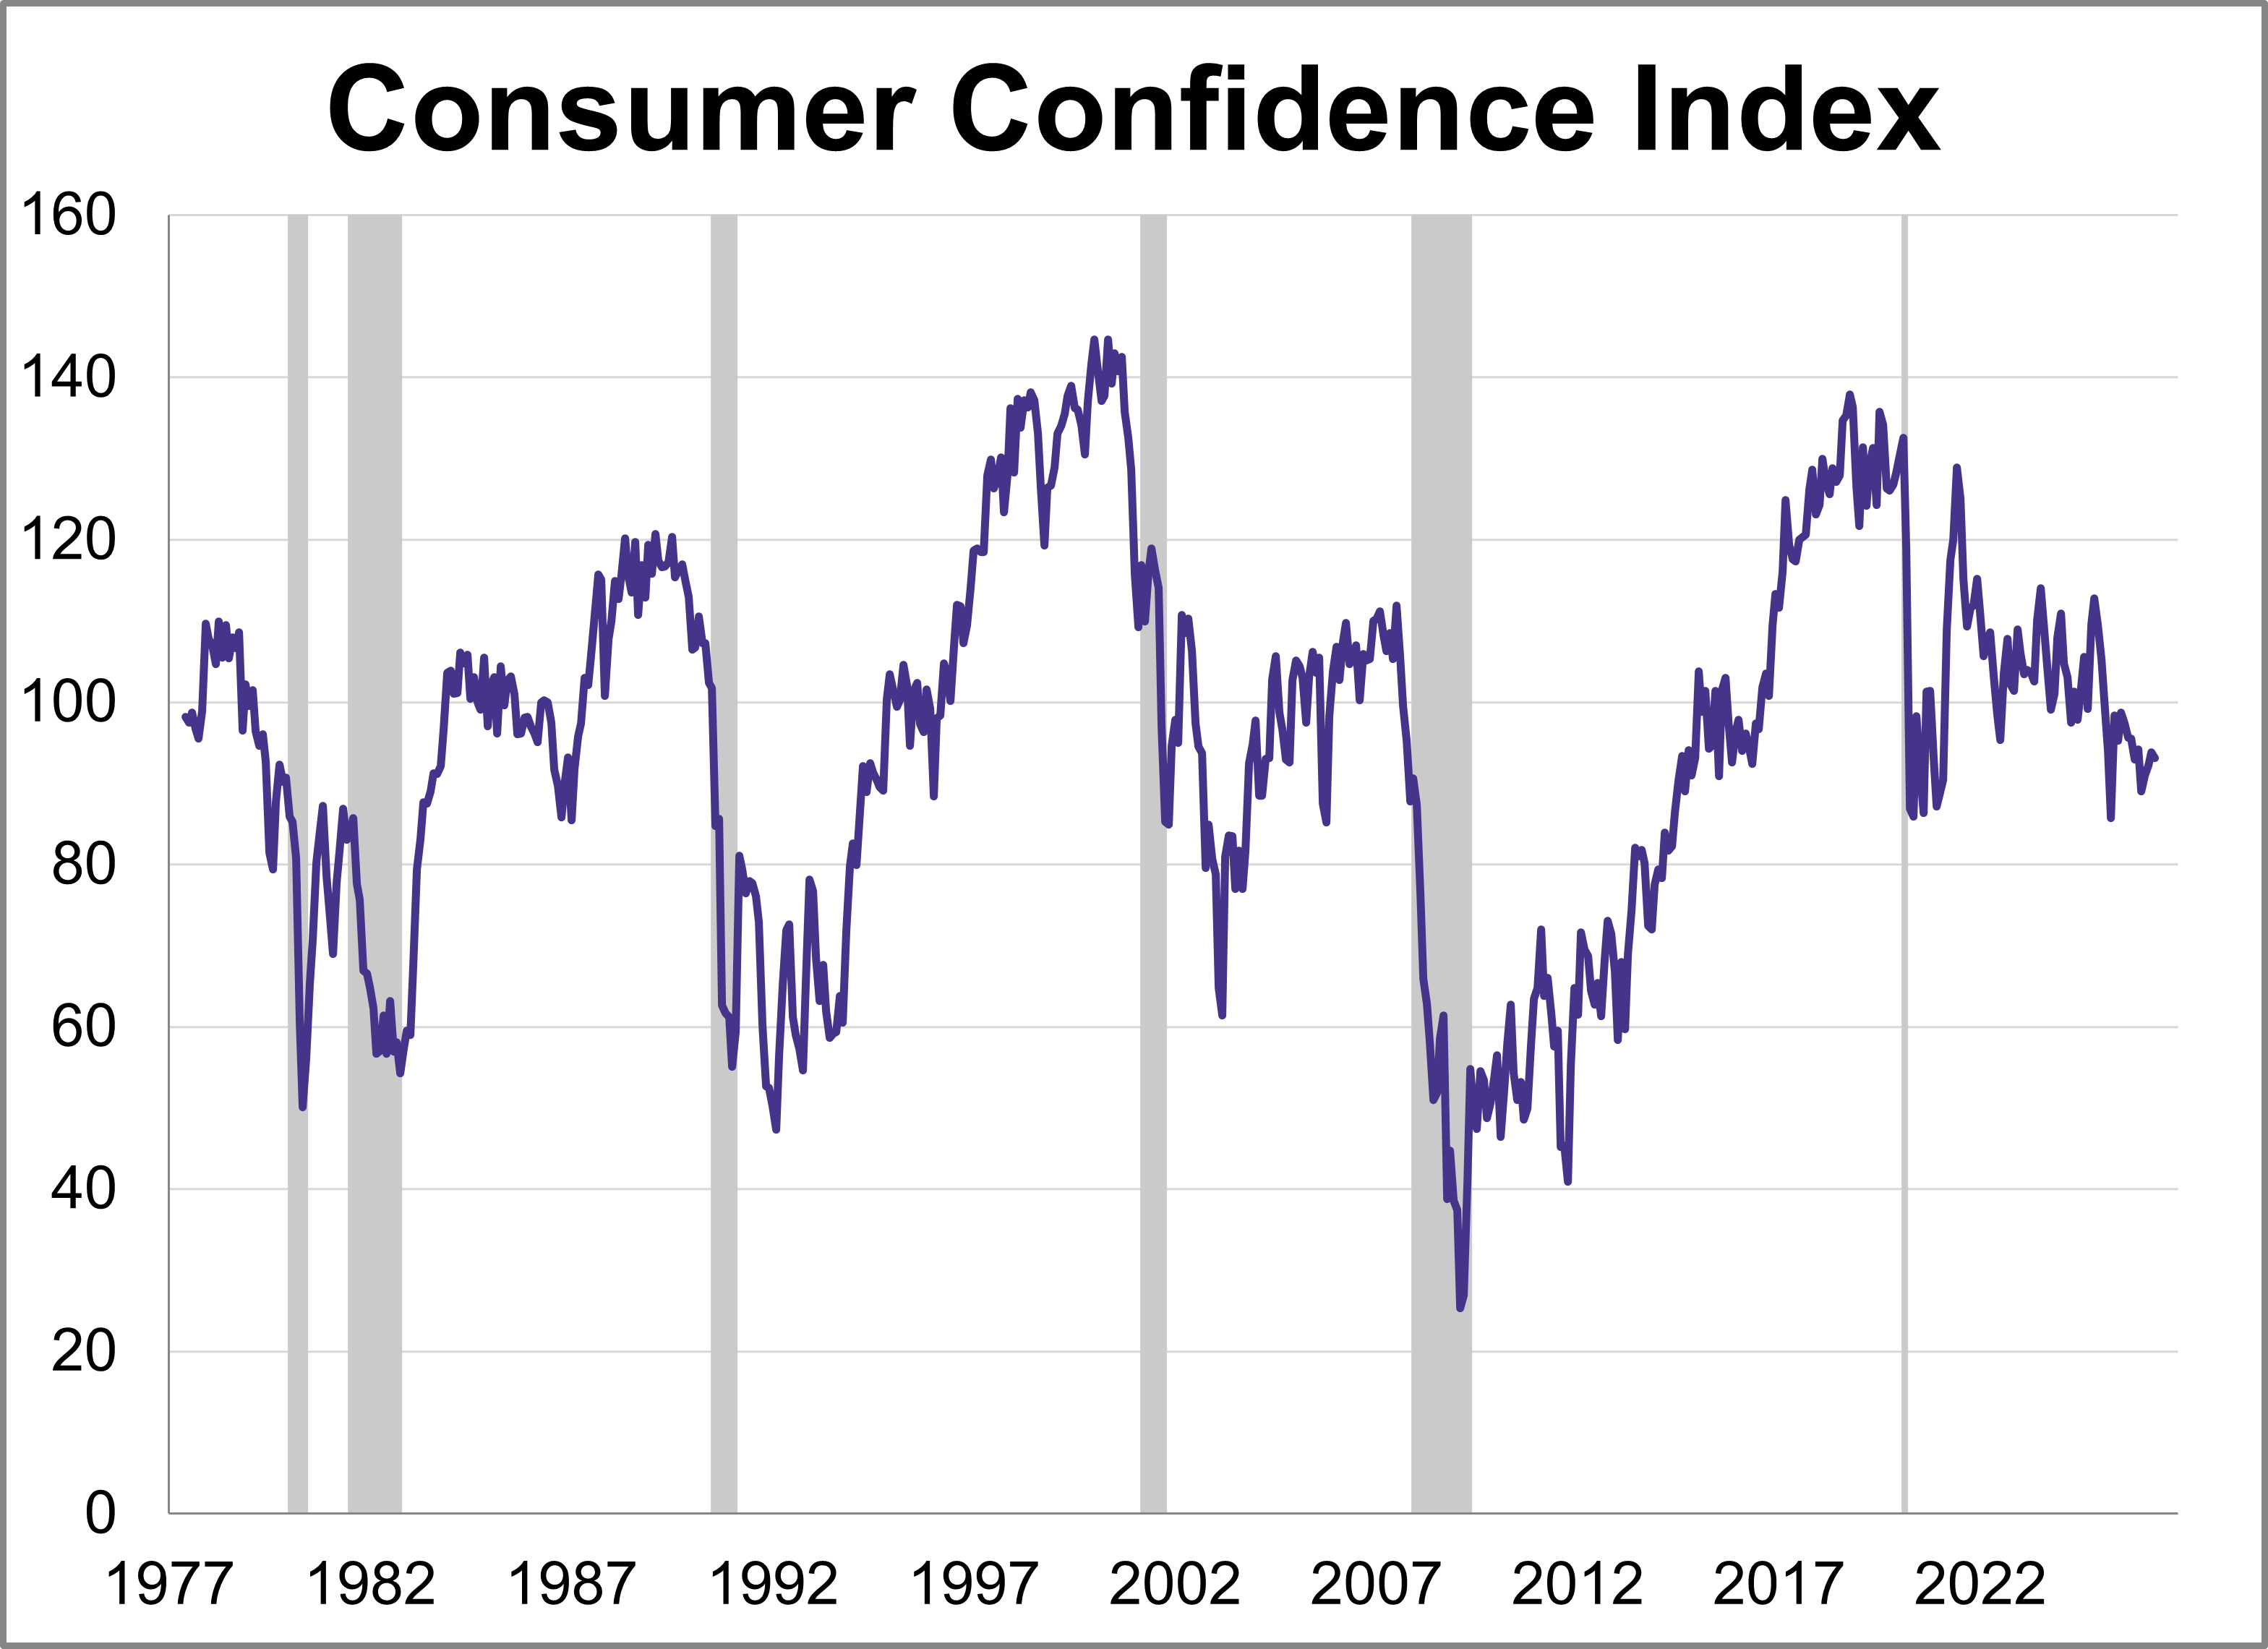
What are consumers thinking about the economy? Their collective mood offers crucial clues for businesses, investors, and policymakers alike. In May, the two leading benchmarks, the University of Michigan’s Consumer Sentiment Index (MCSI) and the Conference Board’s Consumer Confidence Index (CCI), offered similar views with both retreating amid ongoing inflation concerns.
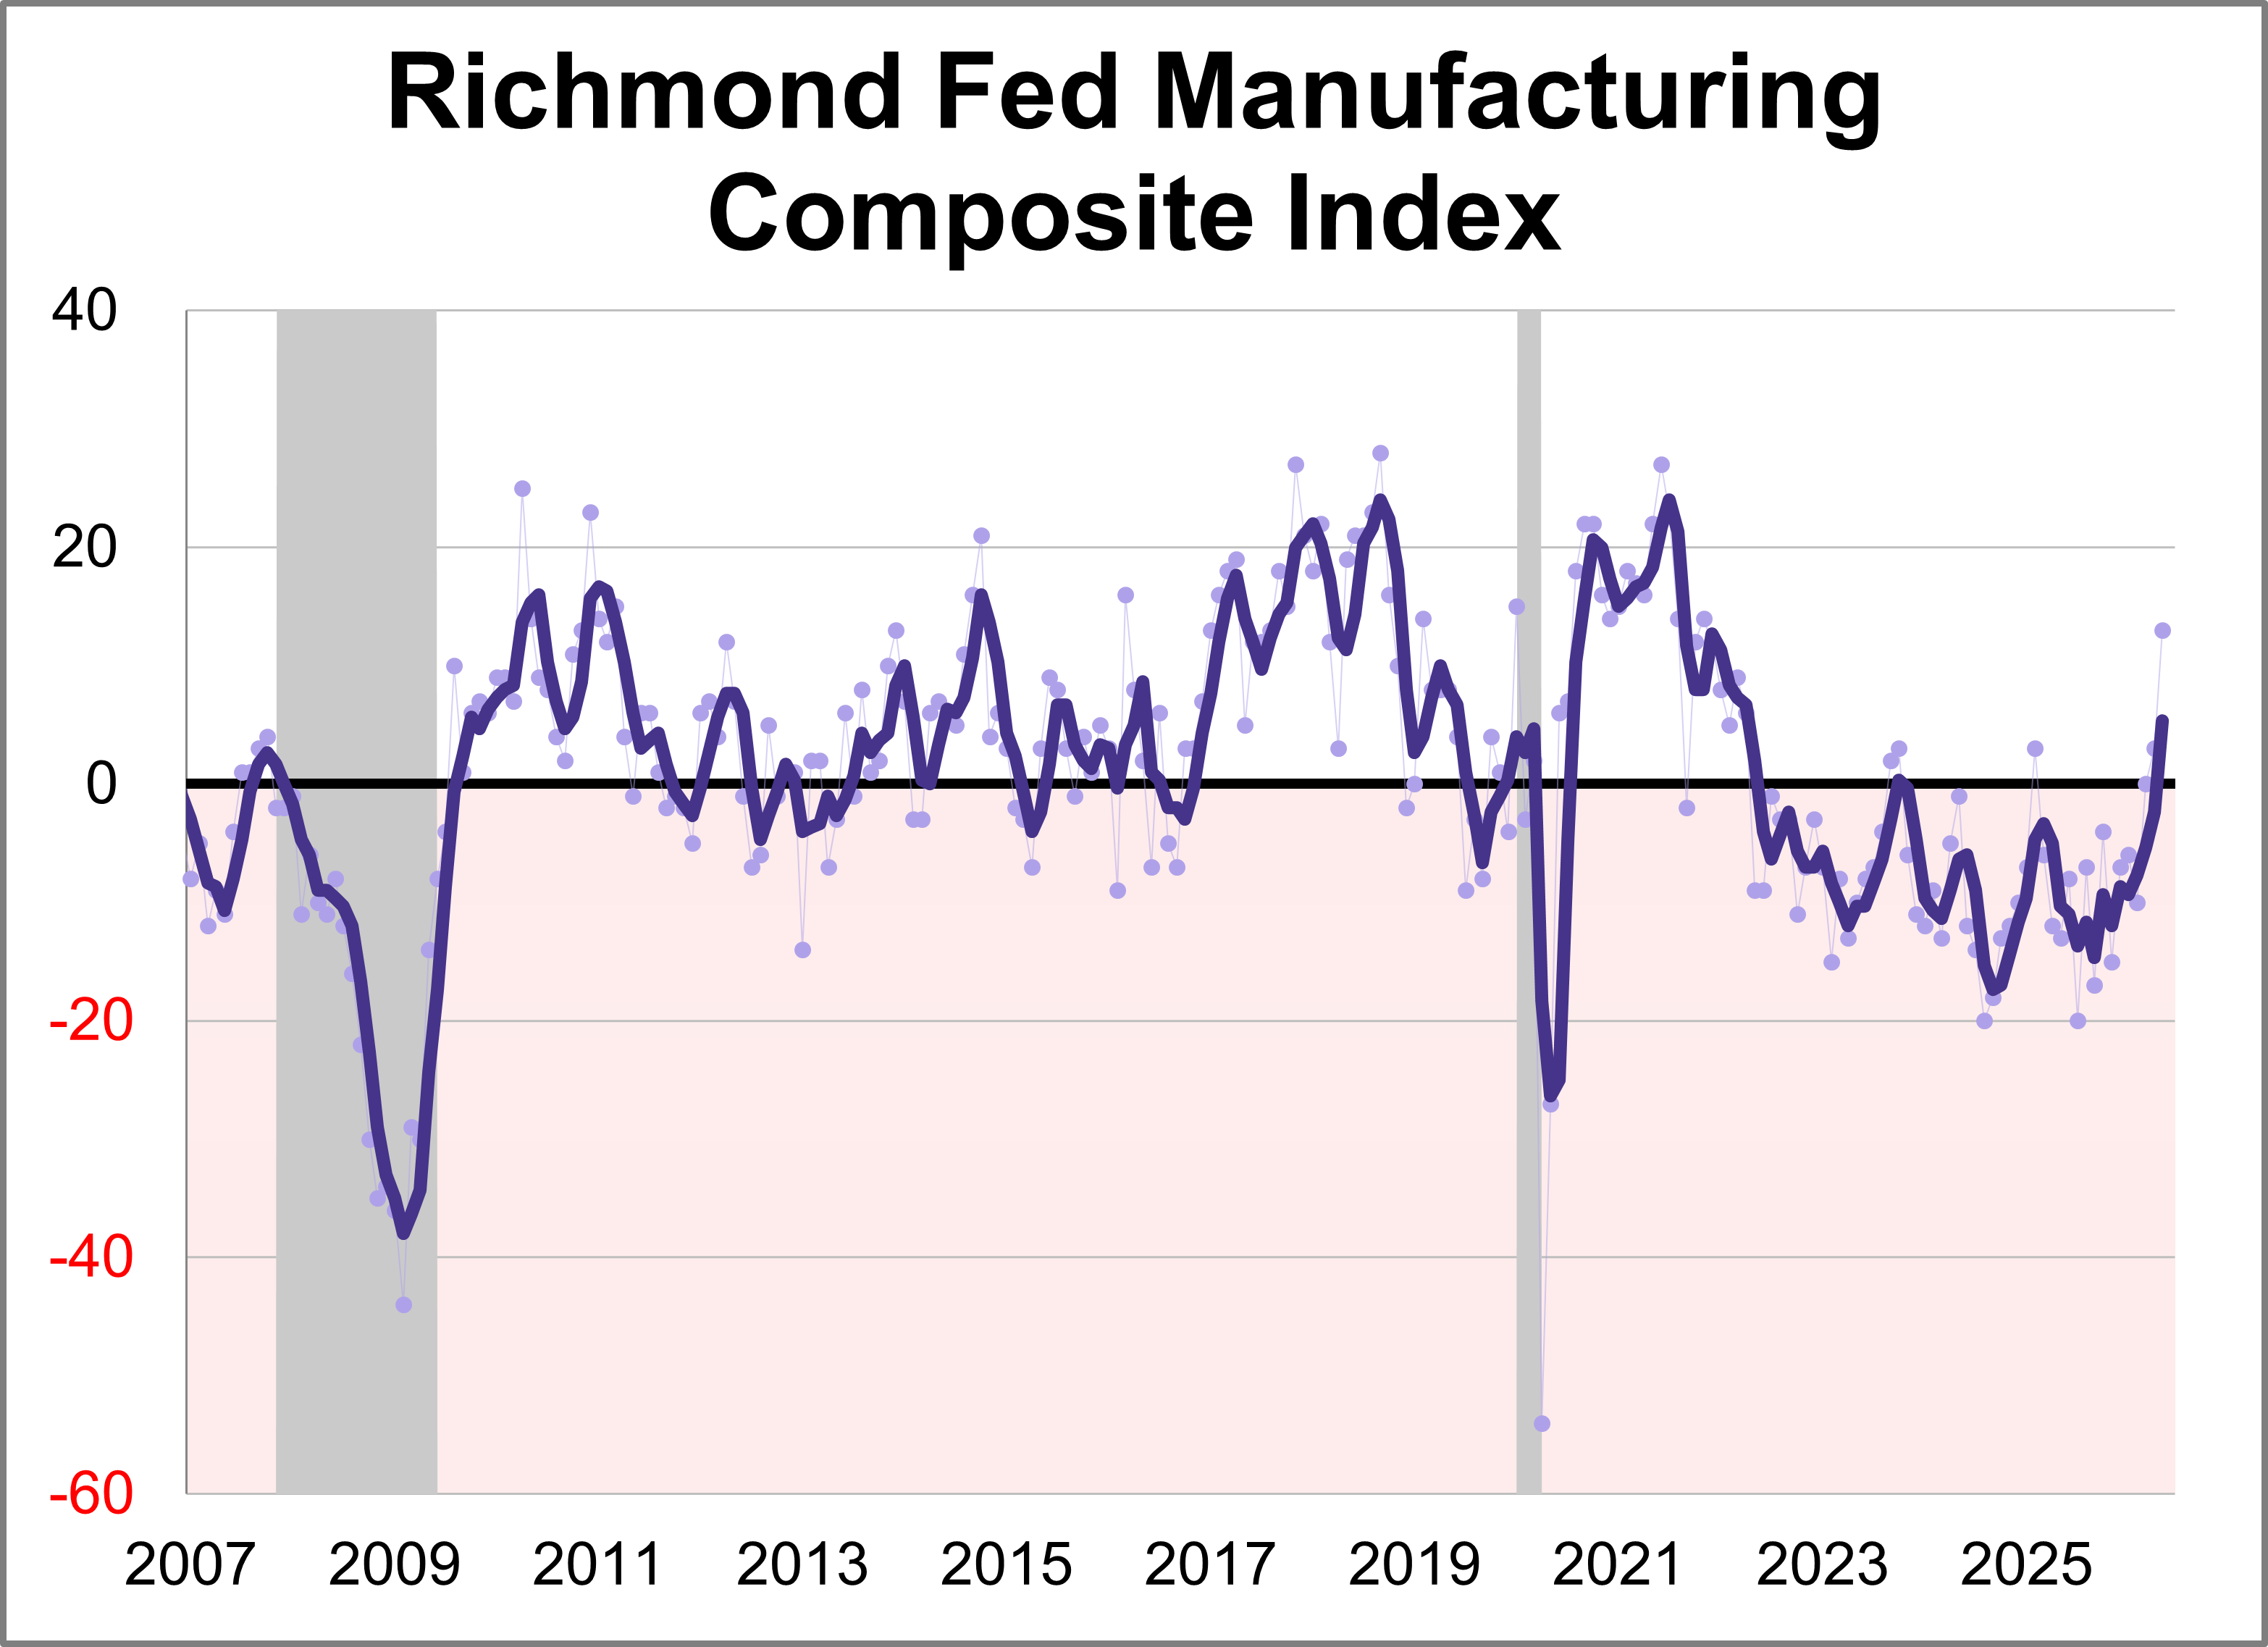
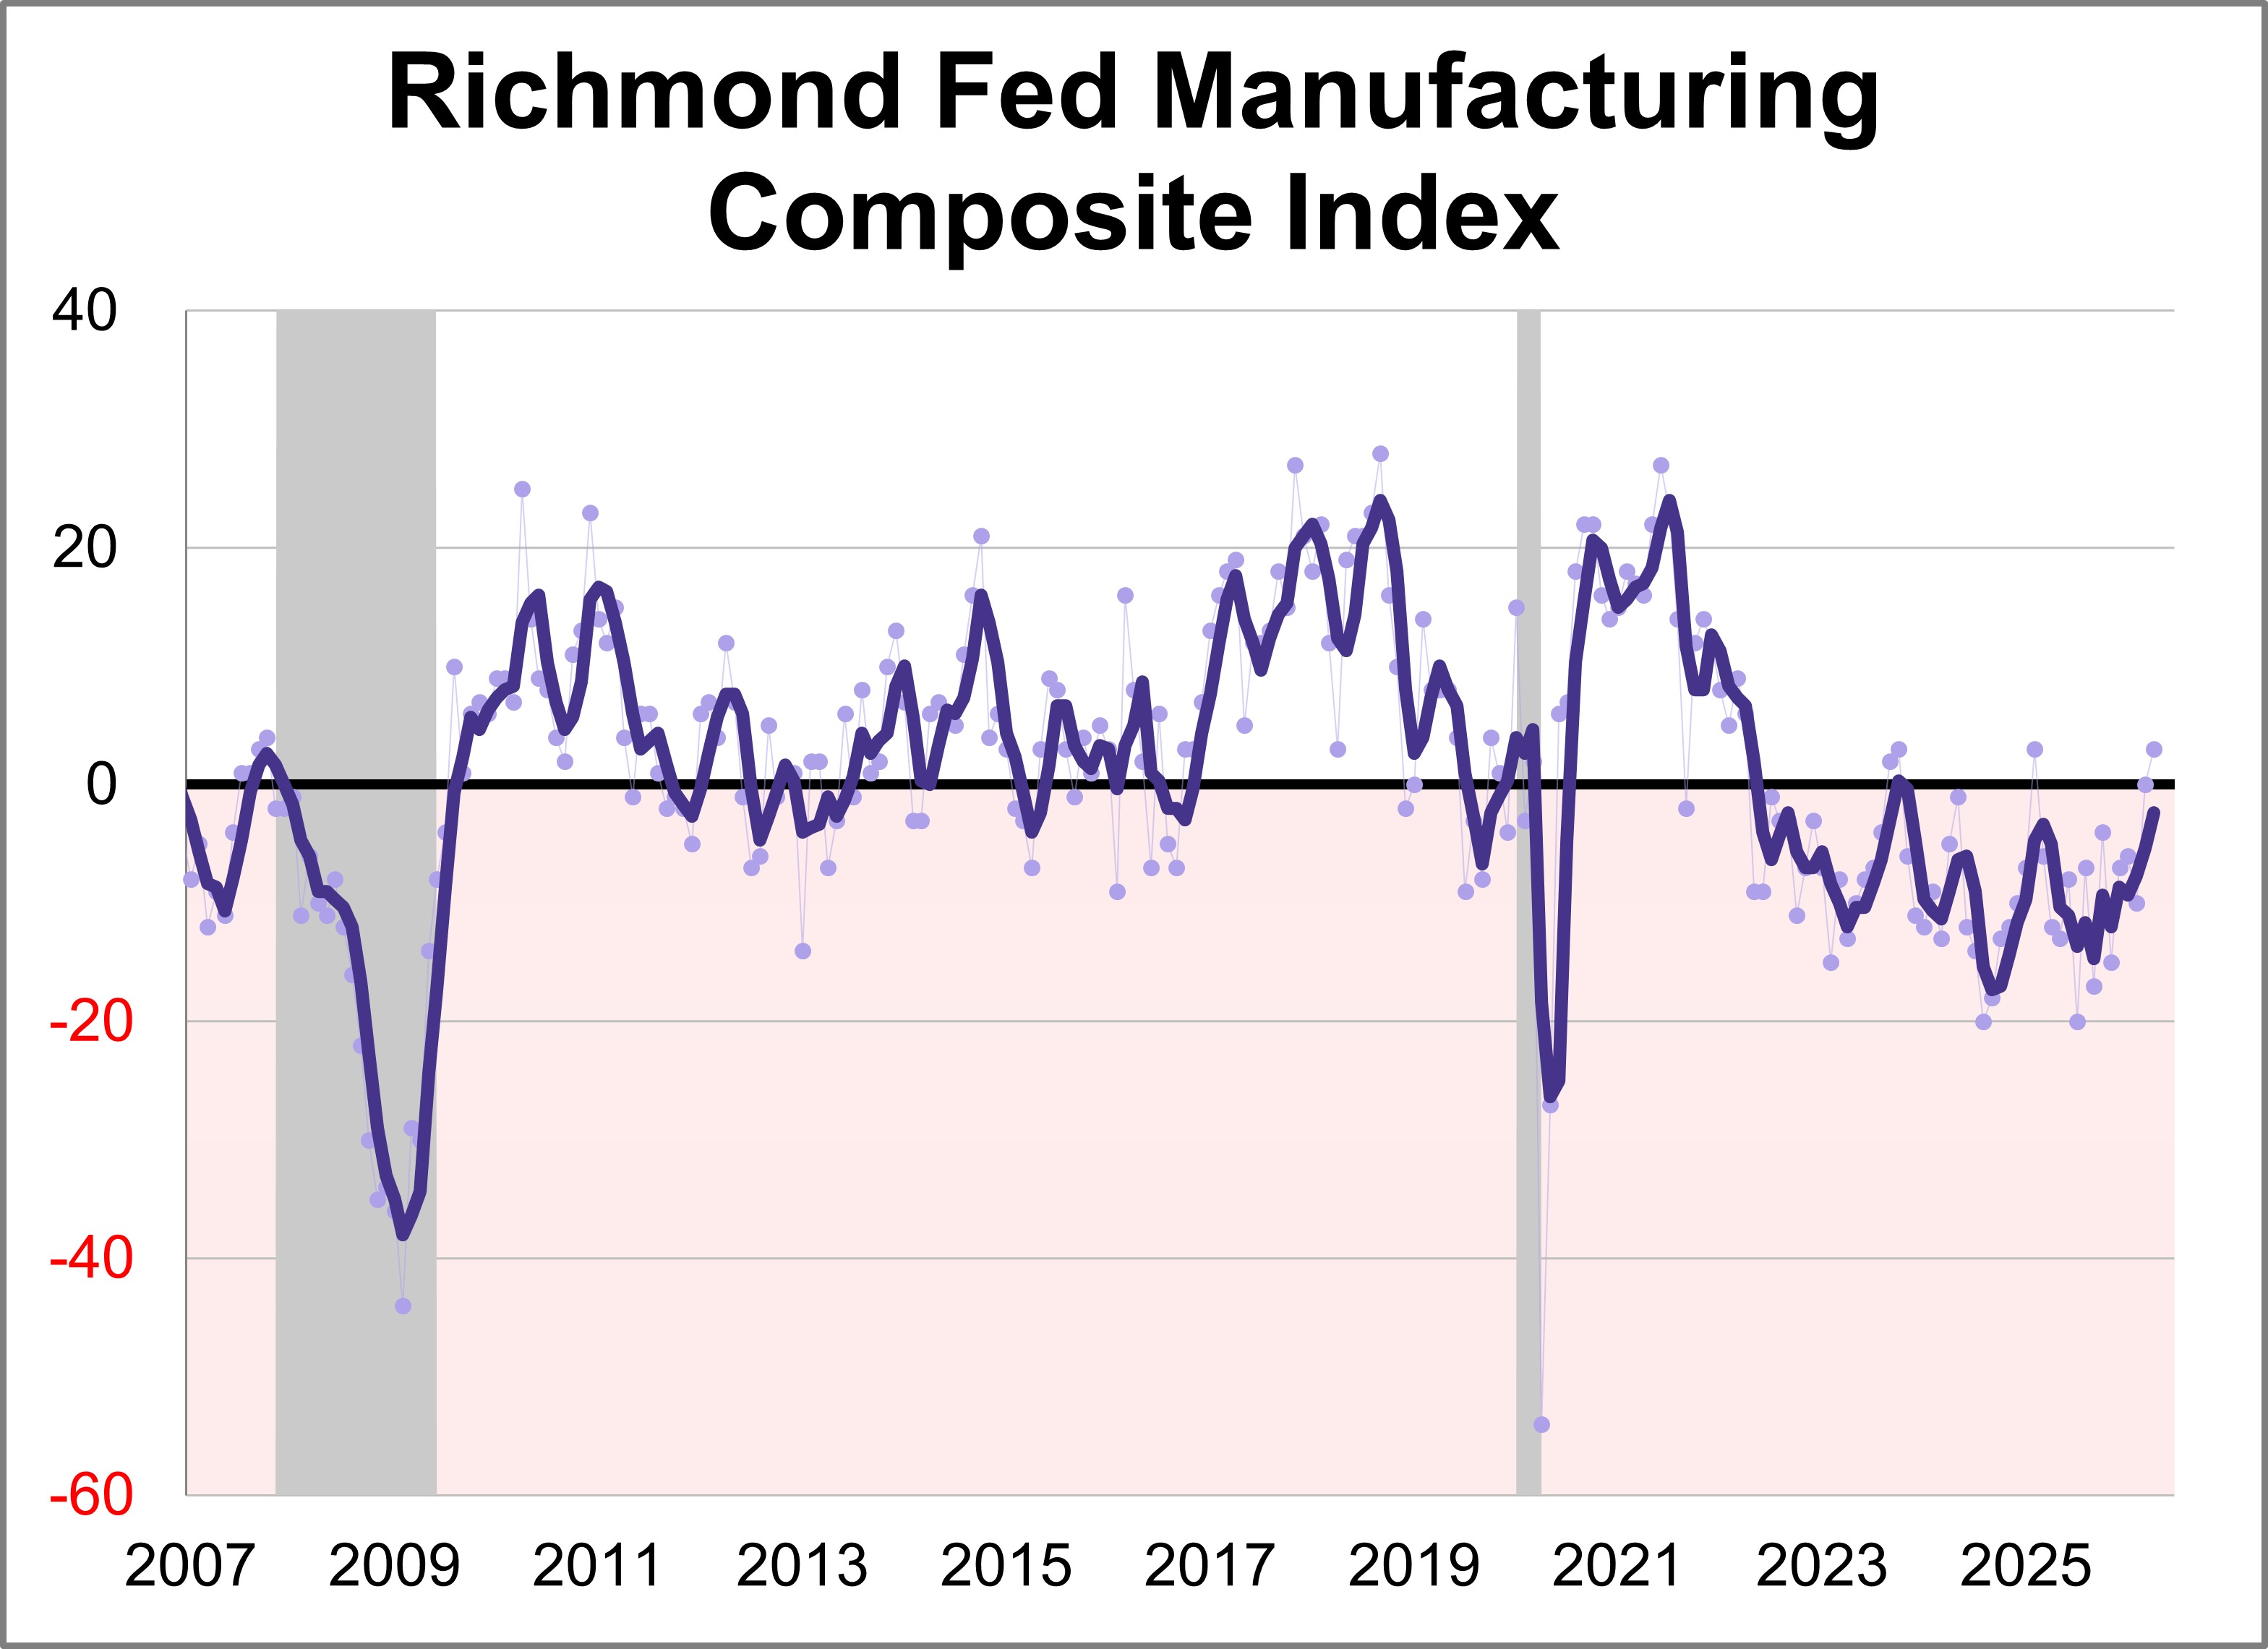
Fifth district manufacturing activity increased in May according to the most recent survey from the Federal Reserve Bank of Richmond. The composite manufacturing index rose ten points points to 13, marking the highest level in nearly five years. This month's reading was above the forecast of 4.
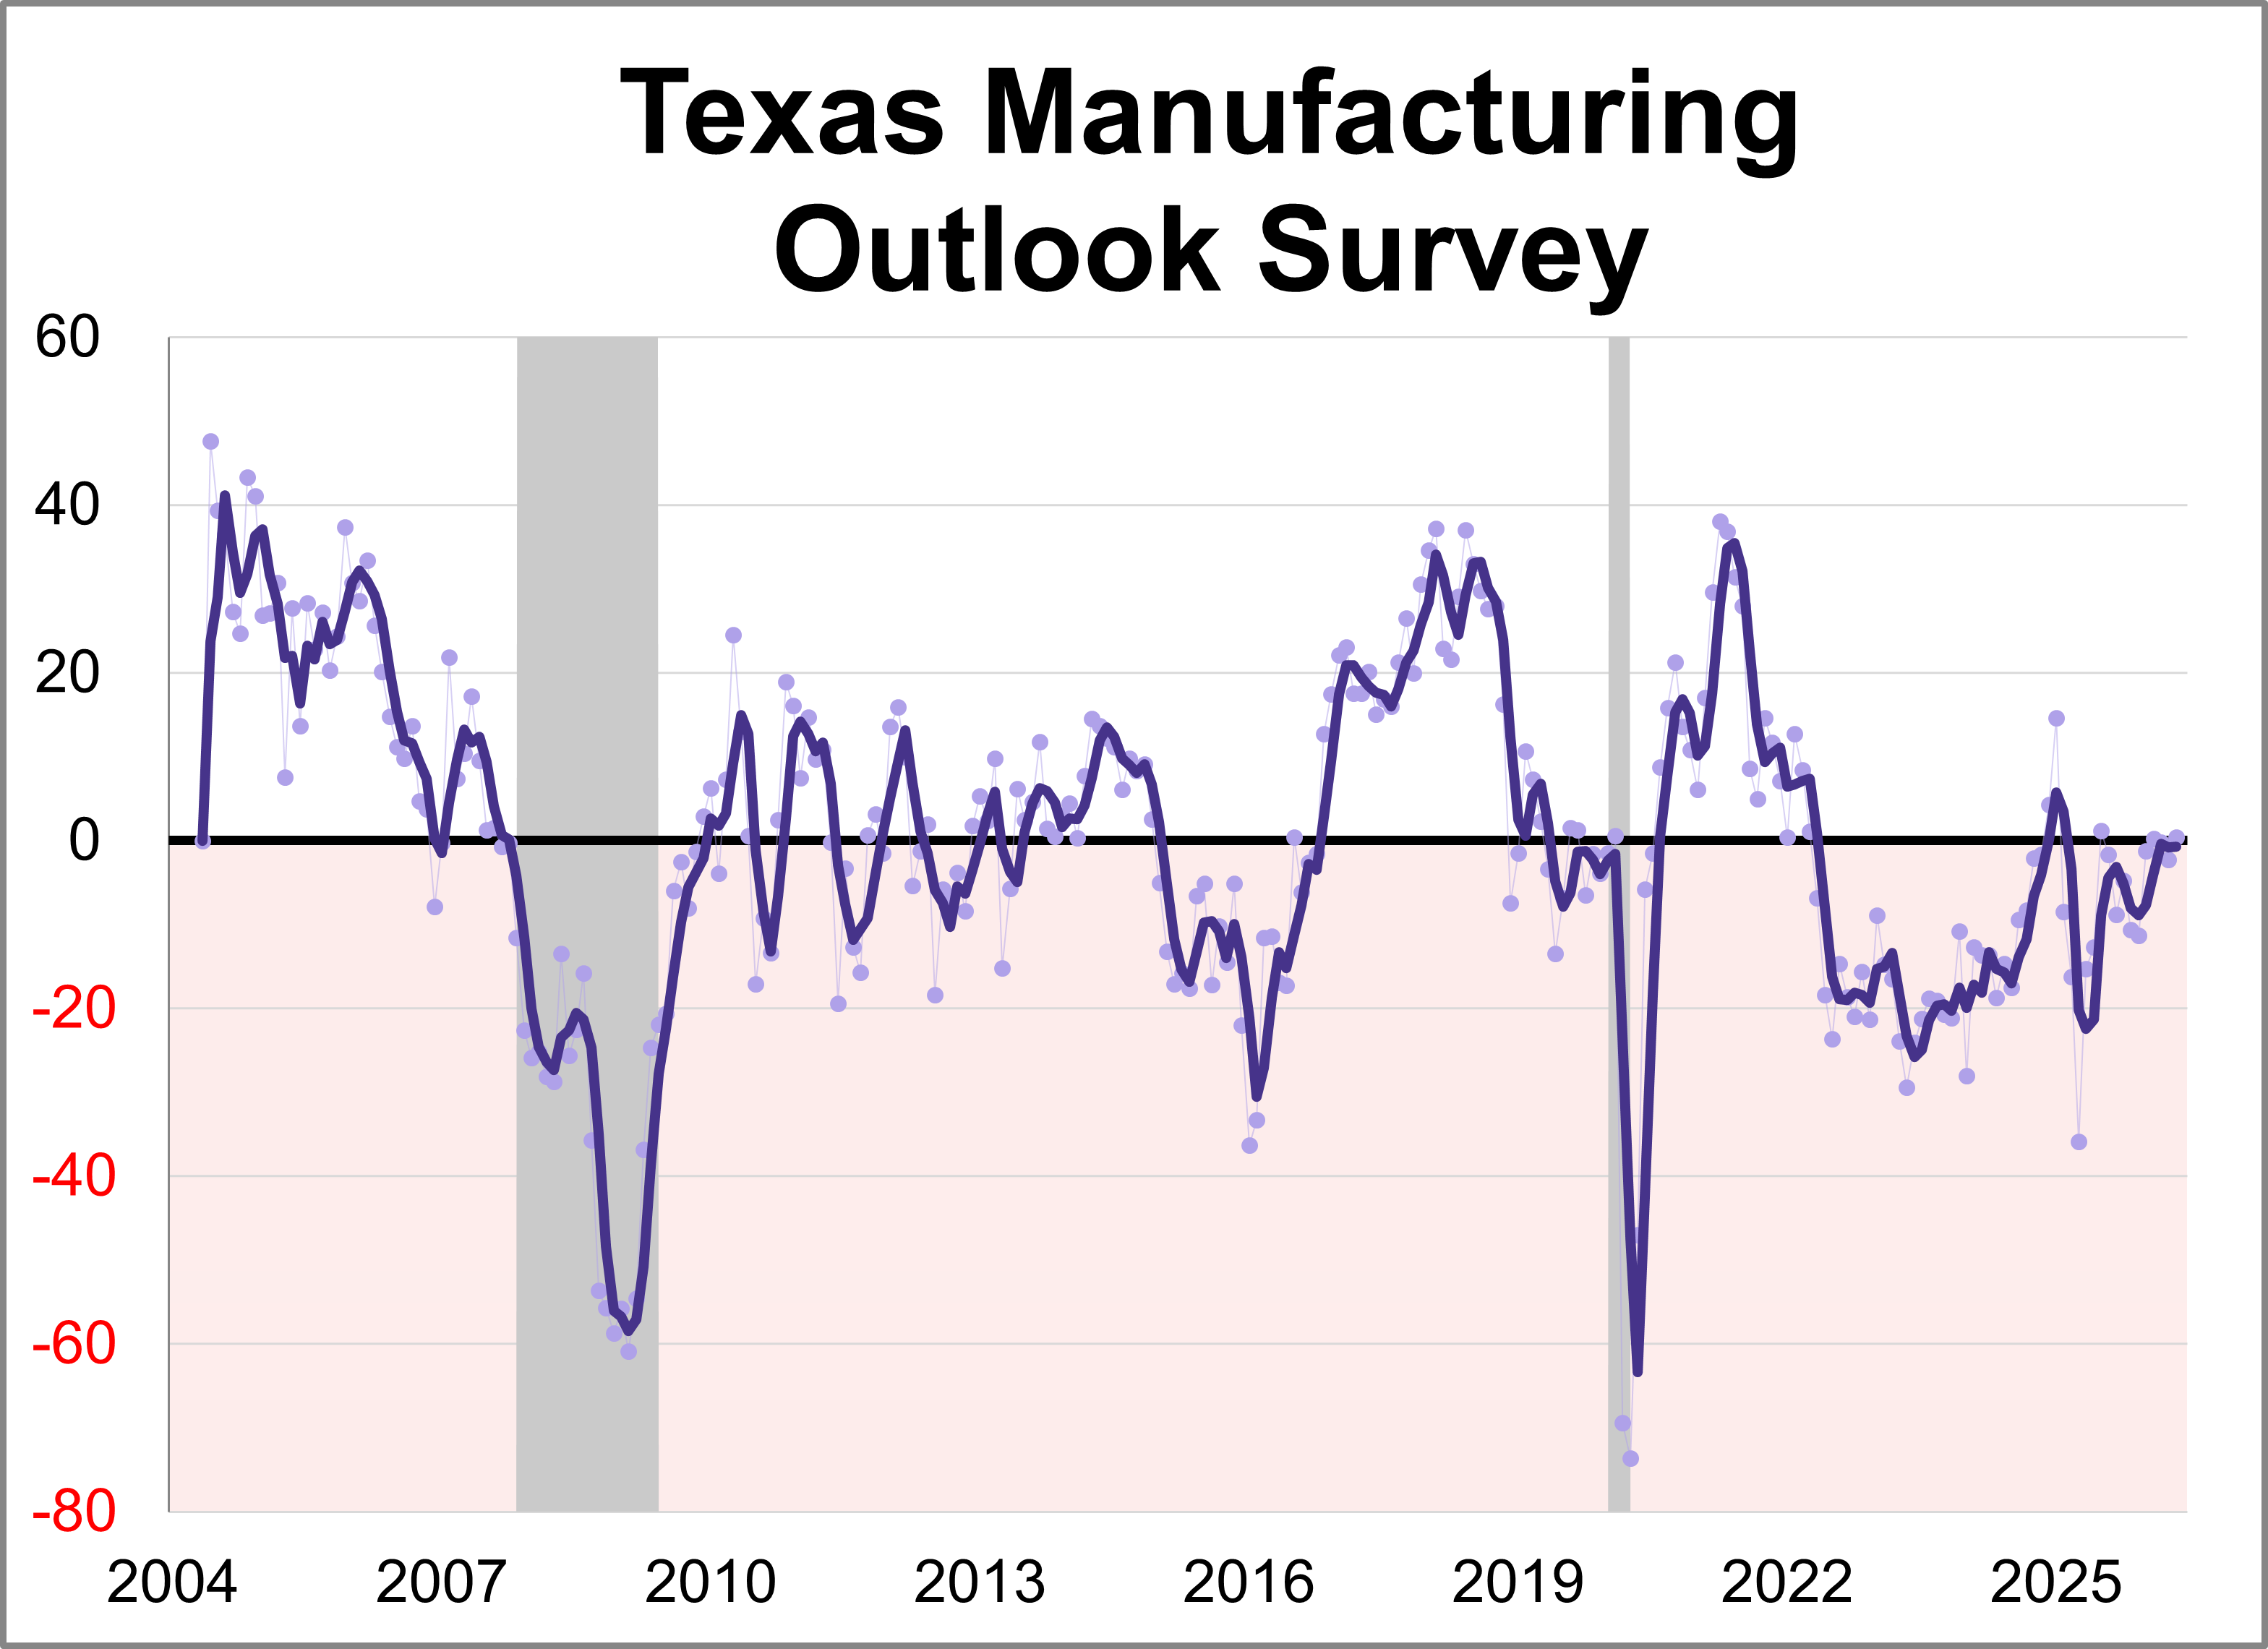
The Dallas Fed released its Texas Manufacturing Outlook Survey (TMOS) for May. The general business activity index rose 2.7 points to 0.4, indicating slower growth of manufacturing activity and stable business conditions perceptions.
The Conference Board's Consumer Confidence Index® fell for the first time in four months in May, dropping 0.7 points to 93.1. Despite the slight dip, the index came in above the forecast of 91.9.
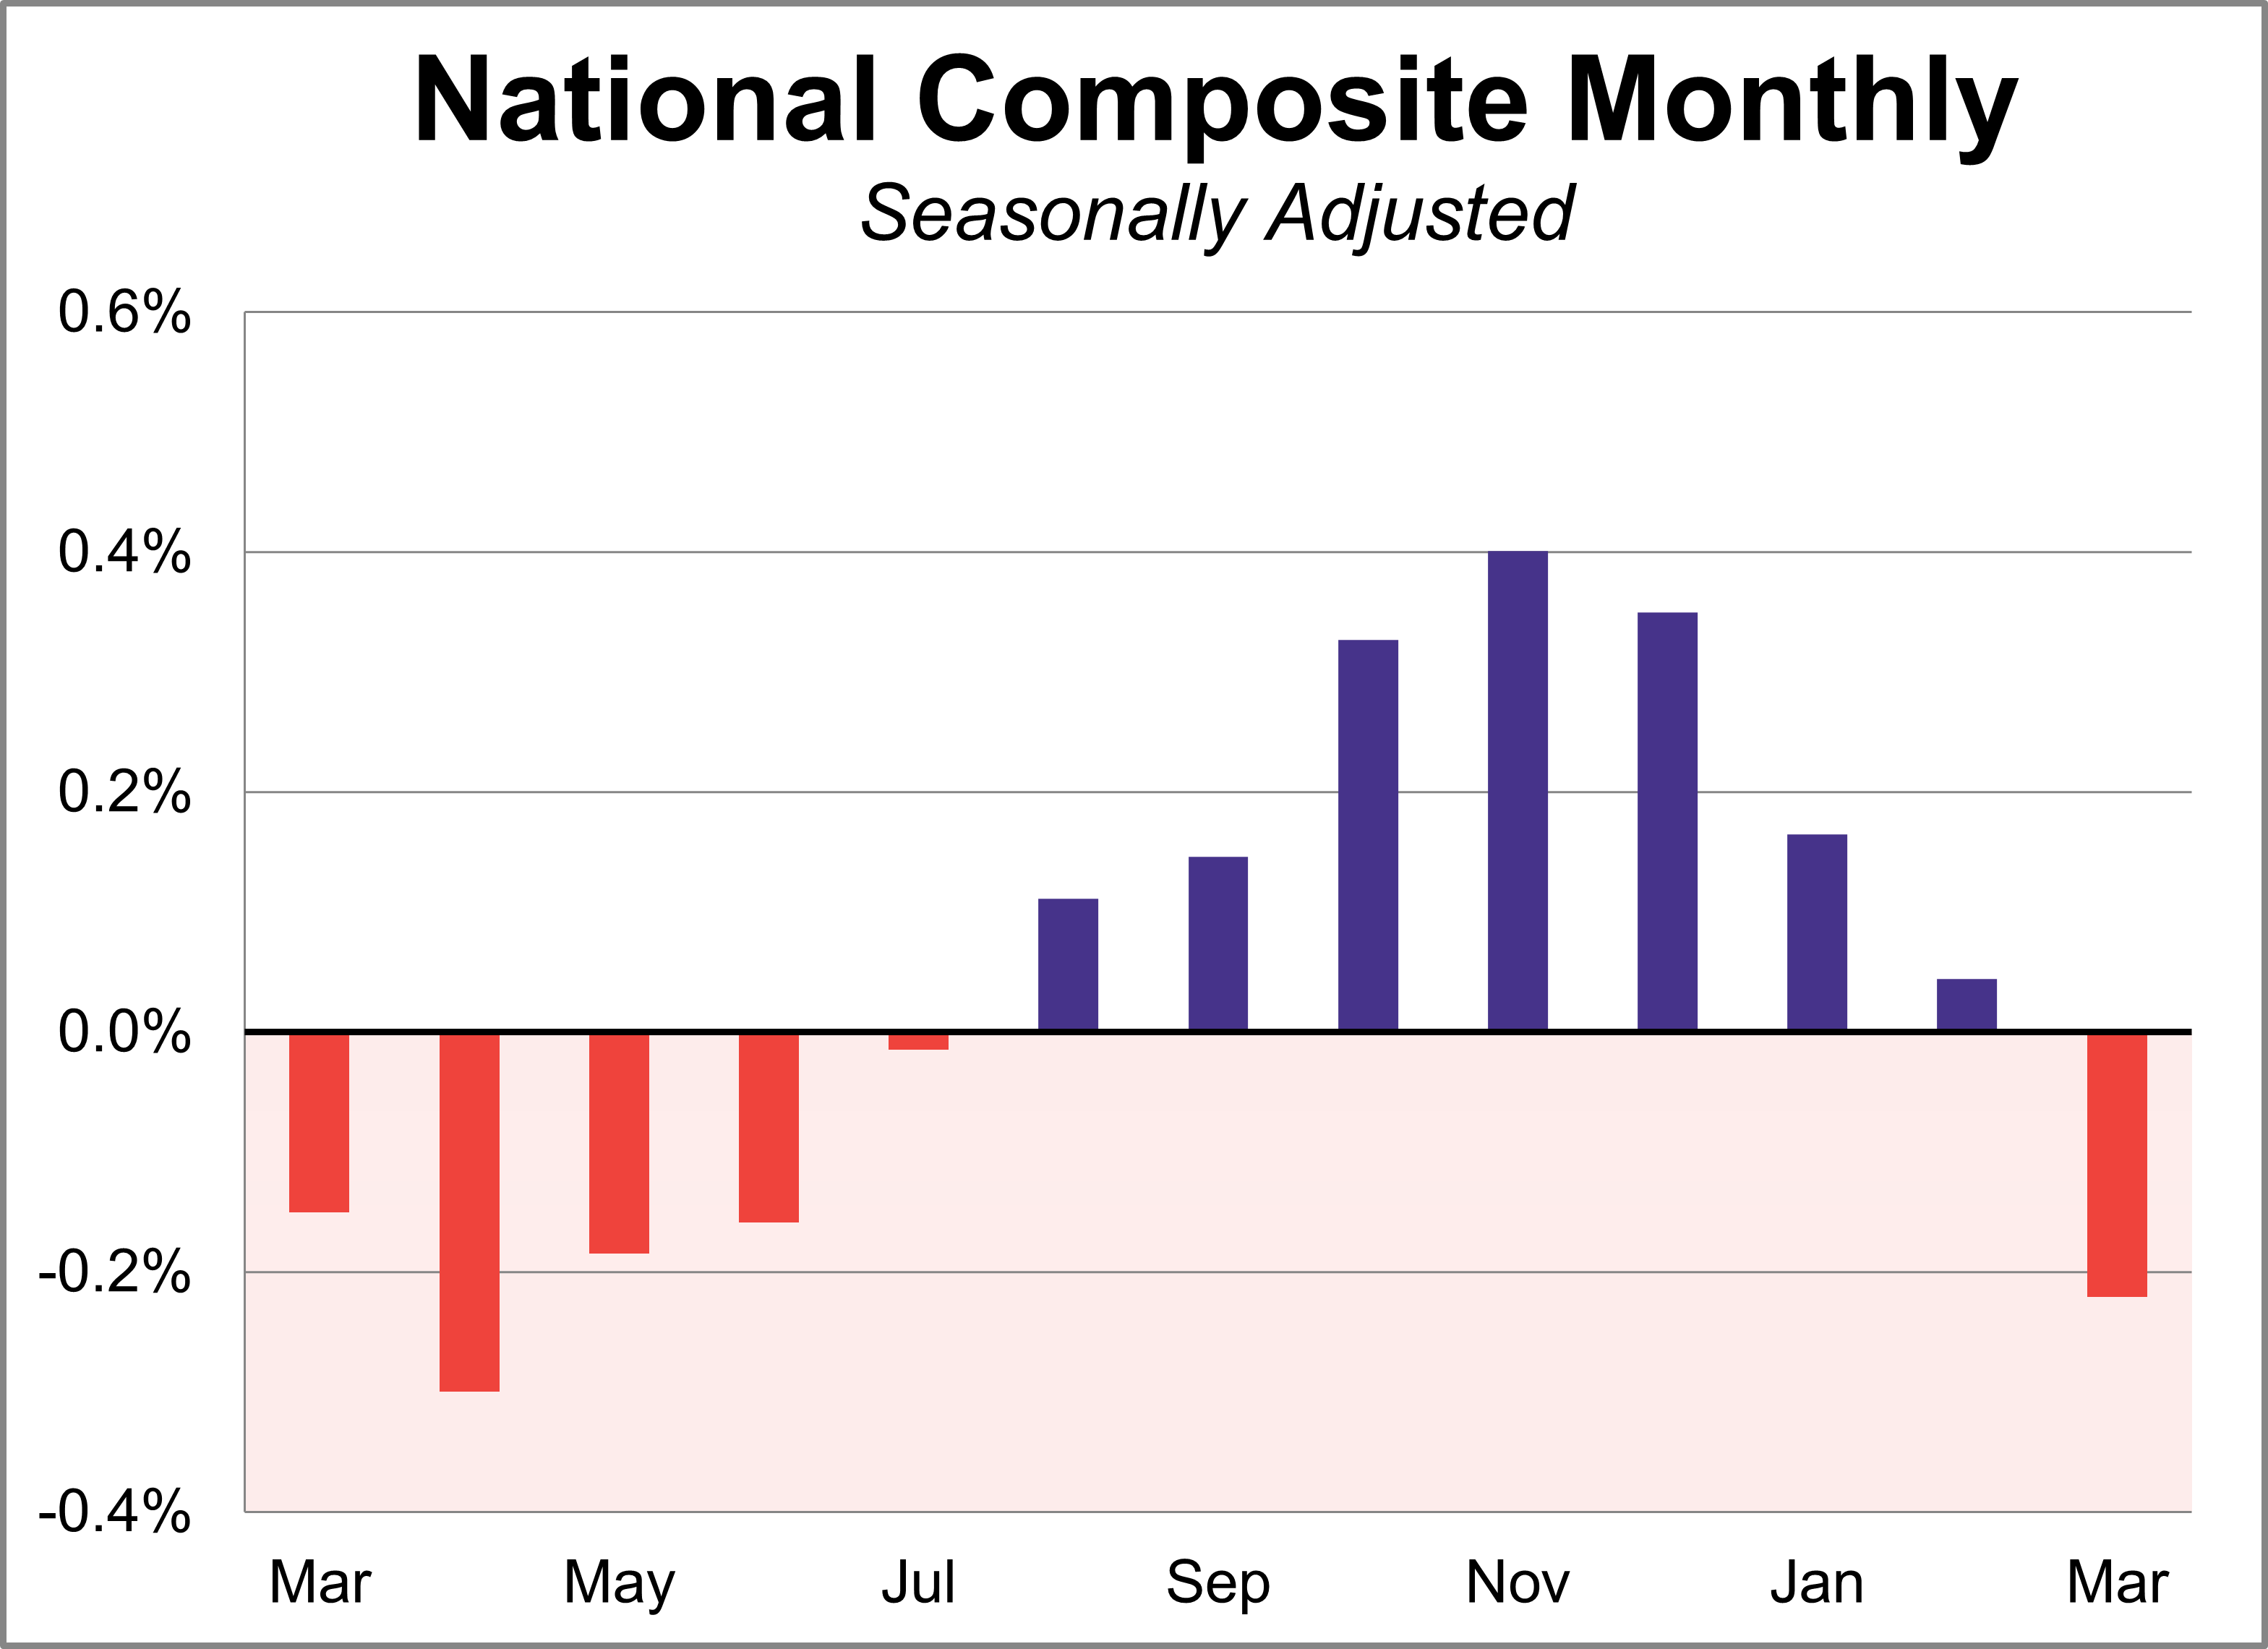
Home prices fell for the first time in eight months in March according to the S&P Cotality Case-Shiller index, as the housing slowdown intensifies. On a seasonally adjusted basis, the national index dropped 0.2% month-over-month and was up 0.7% year-over-year, the slowest pace since June 2023.
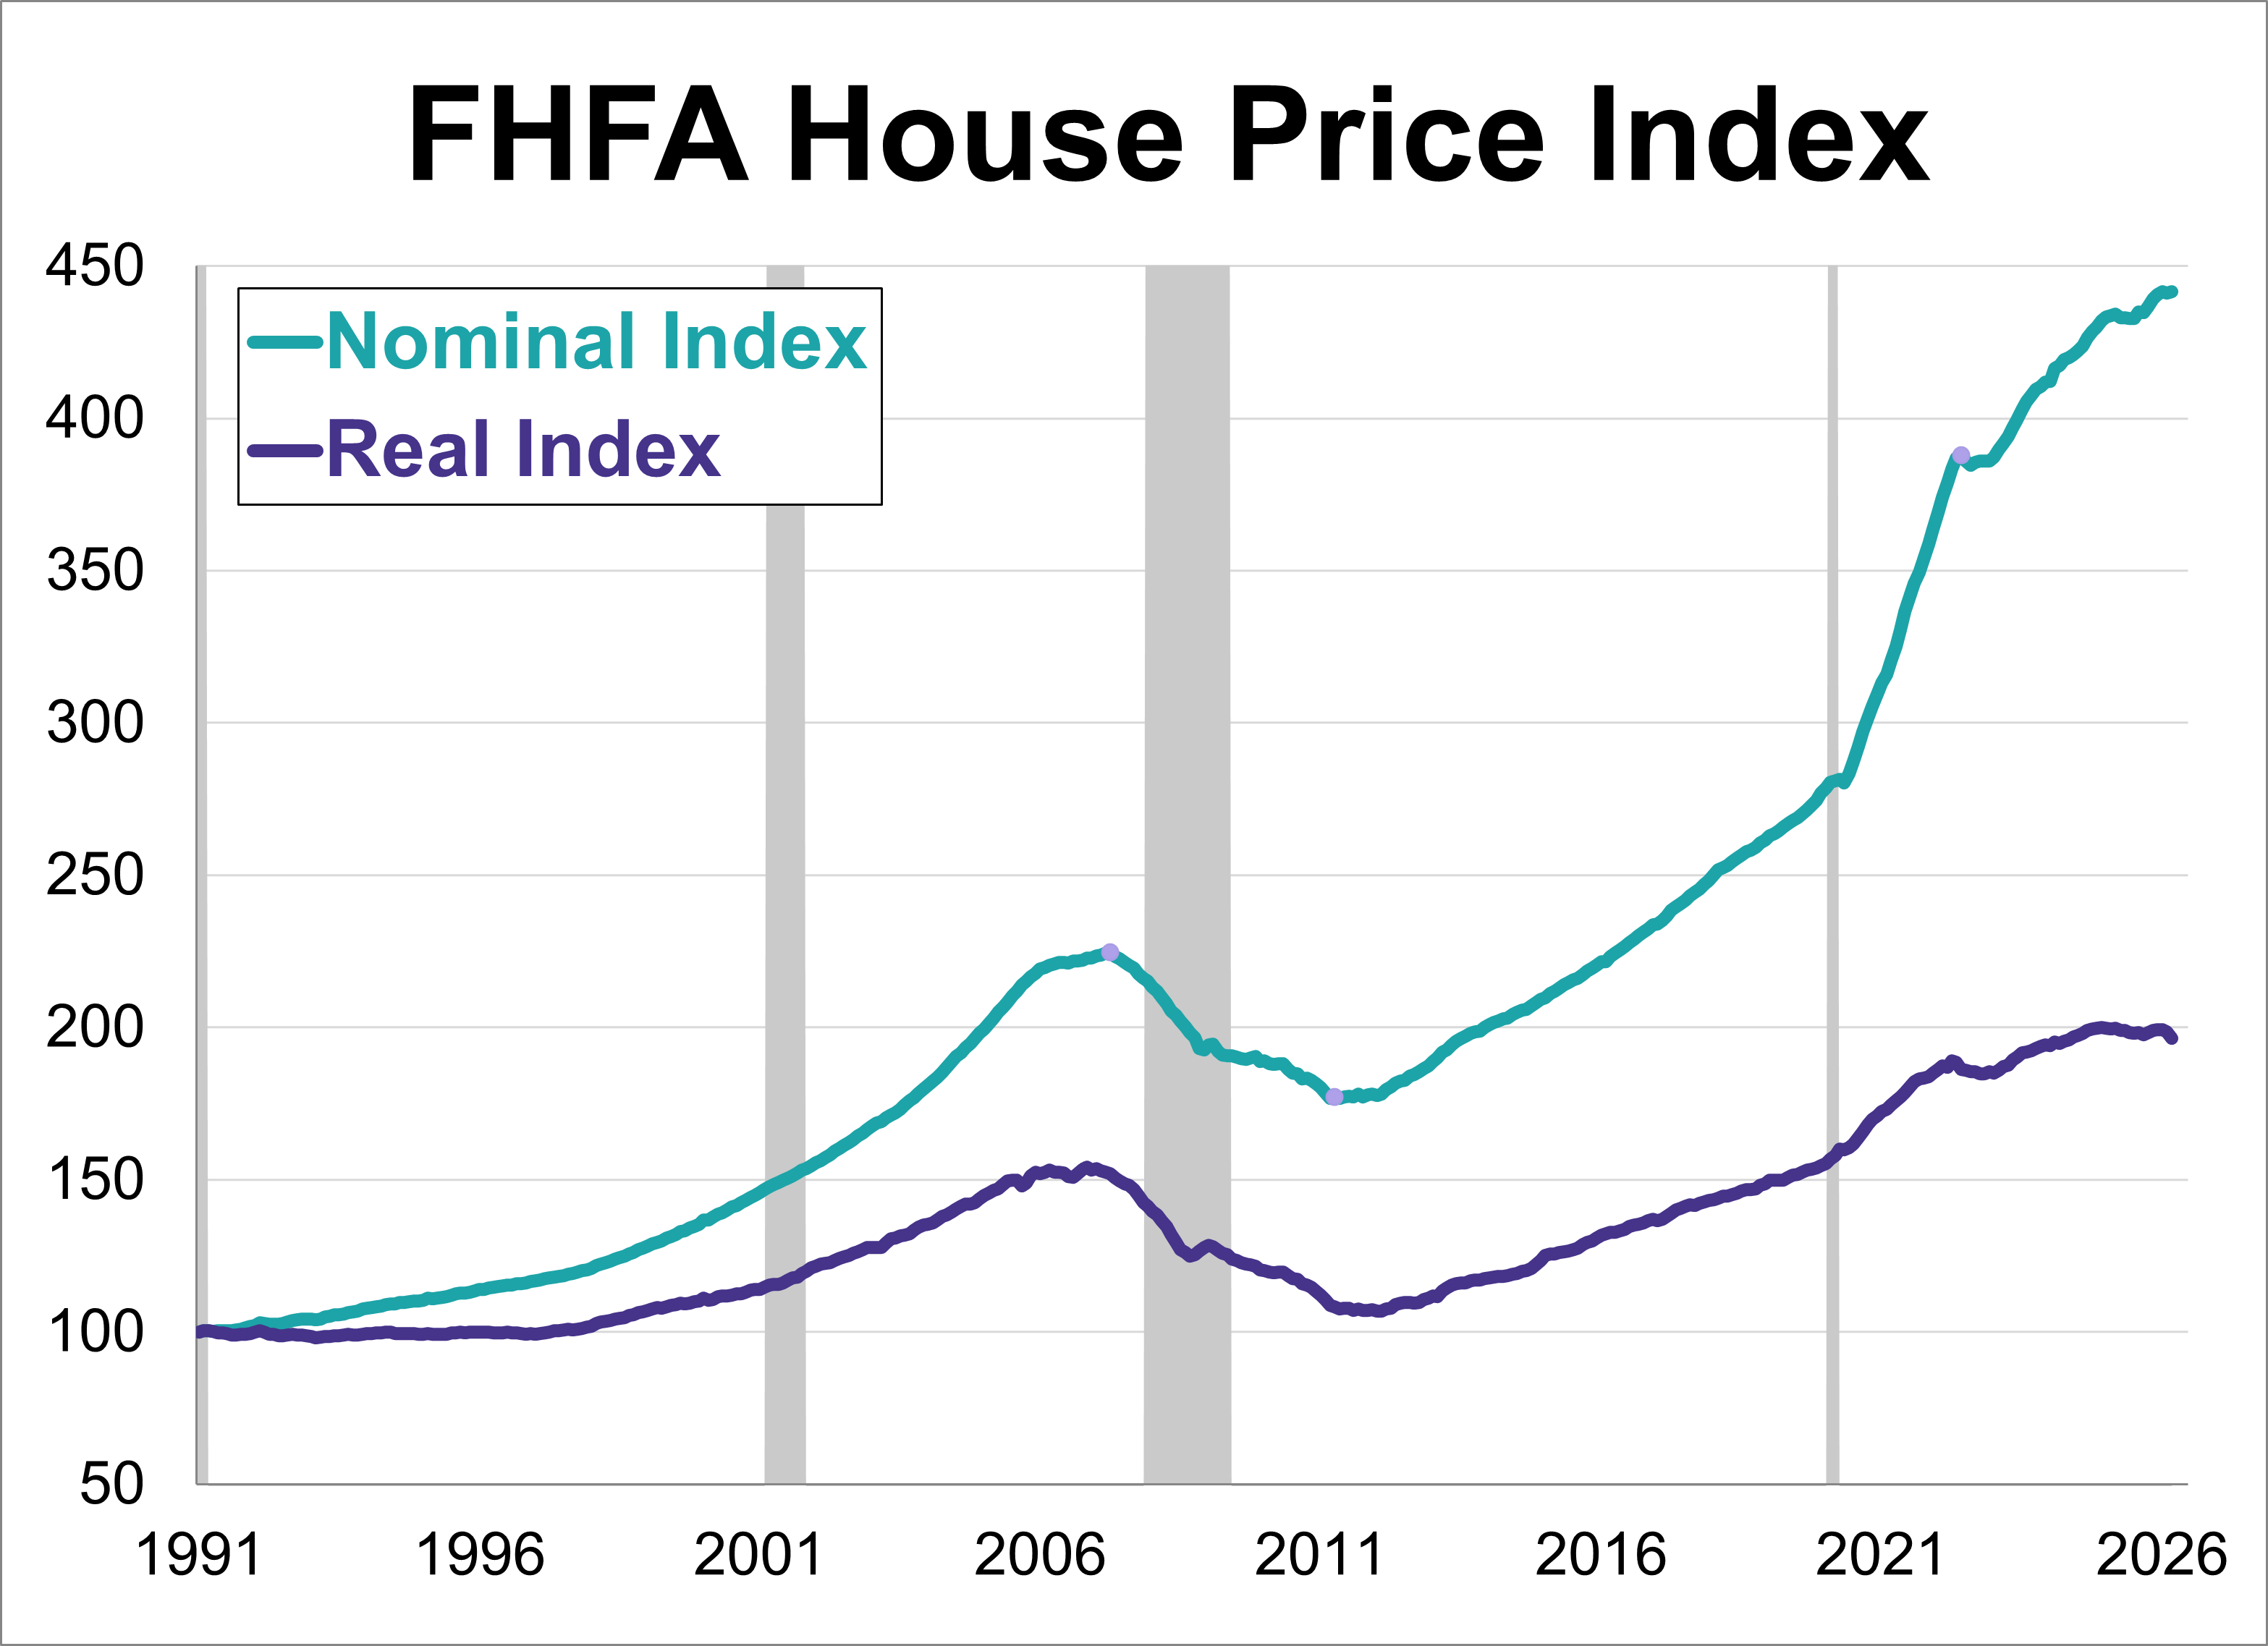
The Federal Housing Finance Agency (FHFA) House Price Index (HPI) reached a new record high in March, rising 0.1% to 441.6.
There is currently a stark contrast between everyday consumer confidence and financial market behavior. On one hand, persistent inflation and elevated living costs have driven consumer sentiment to historic lows. On the other hand, financial market participants are exhibiting aggressive risk appetite, with margin debt surging to an all-time high record on the heels of major equity market gains.
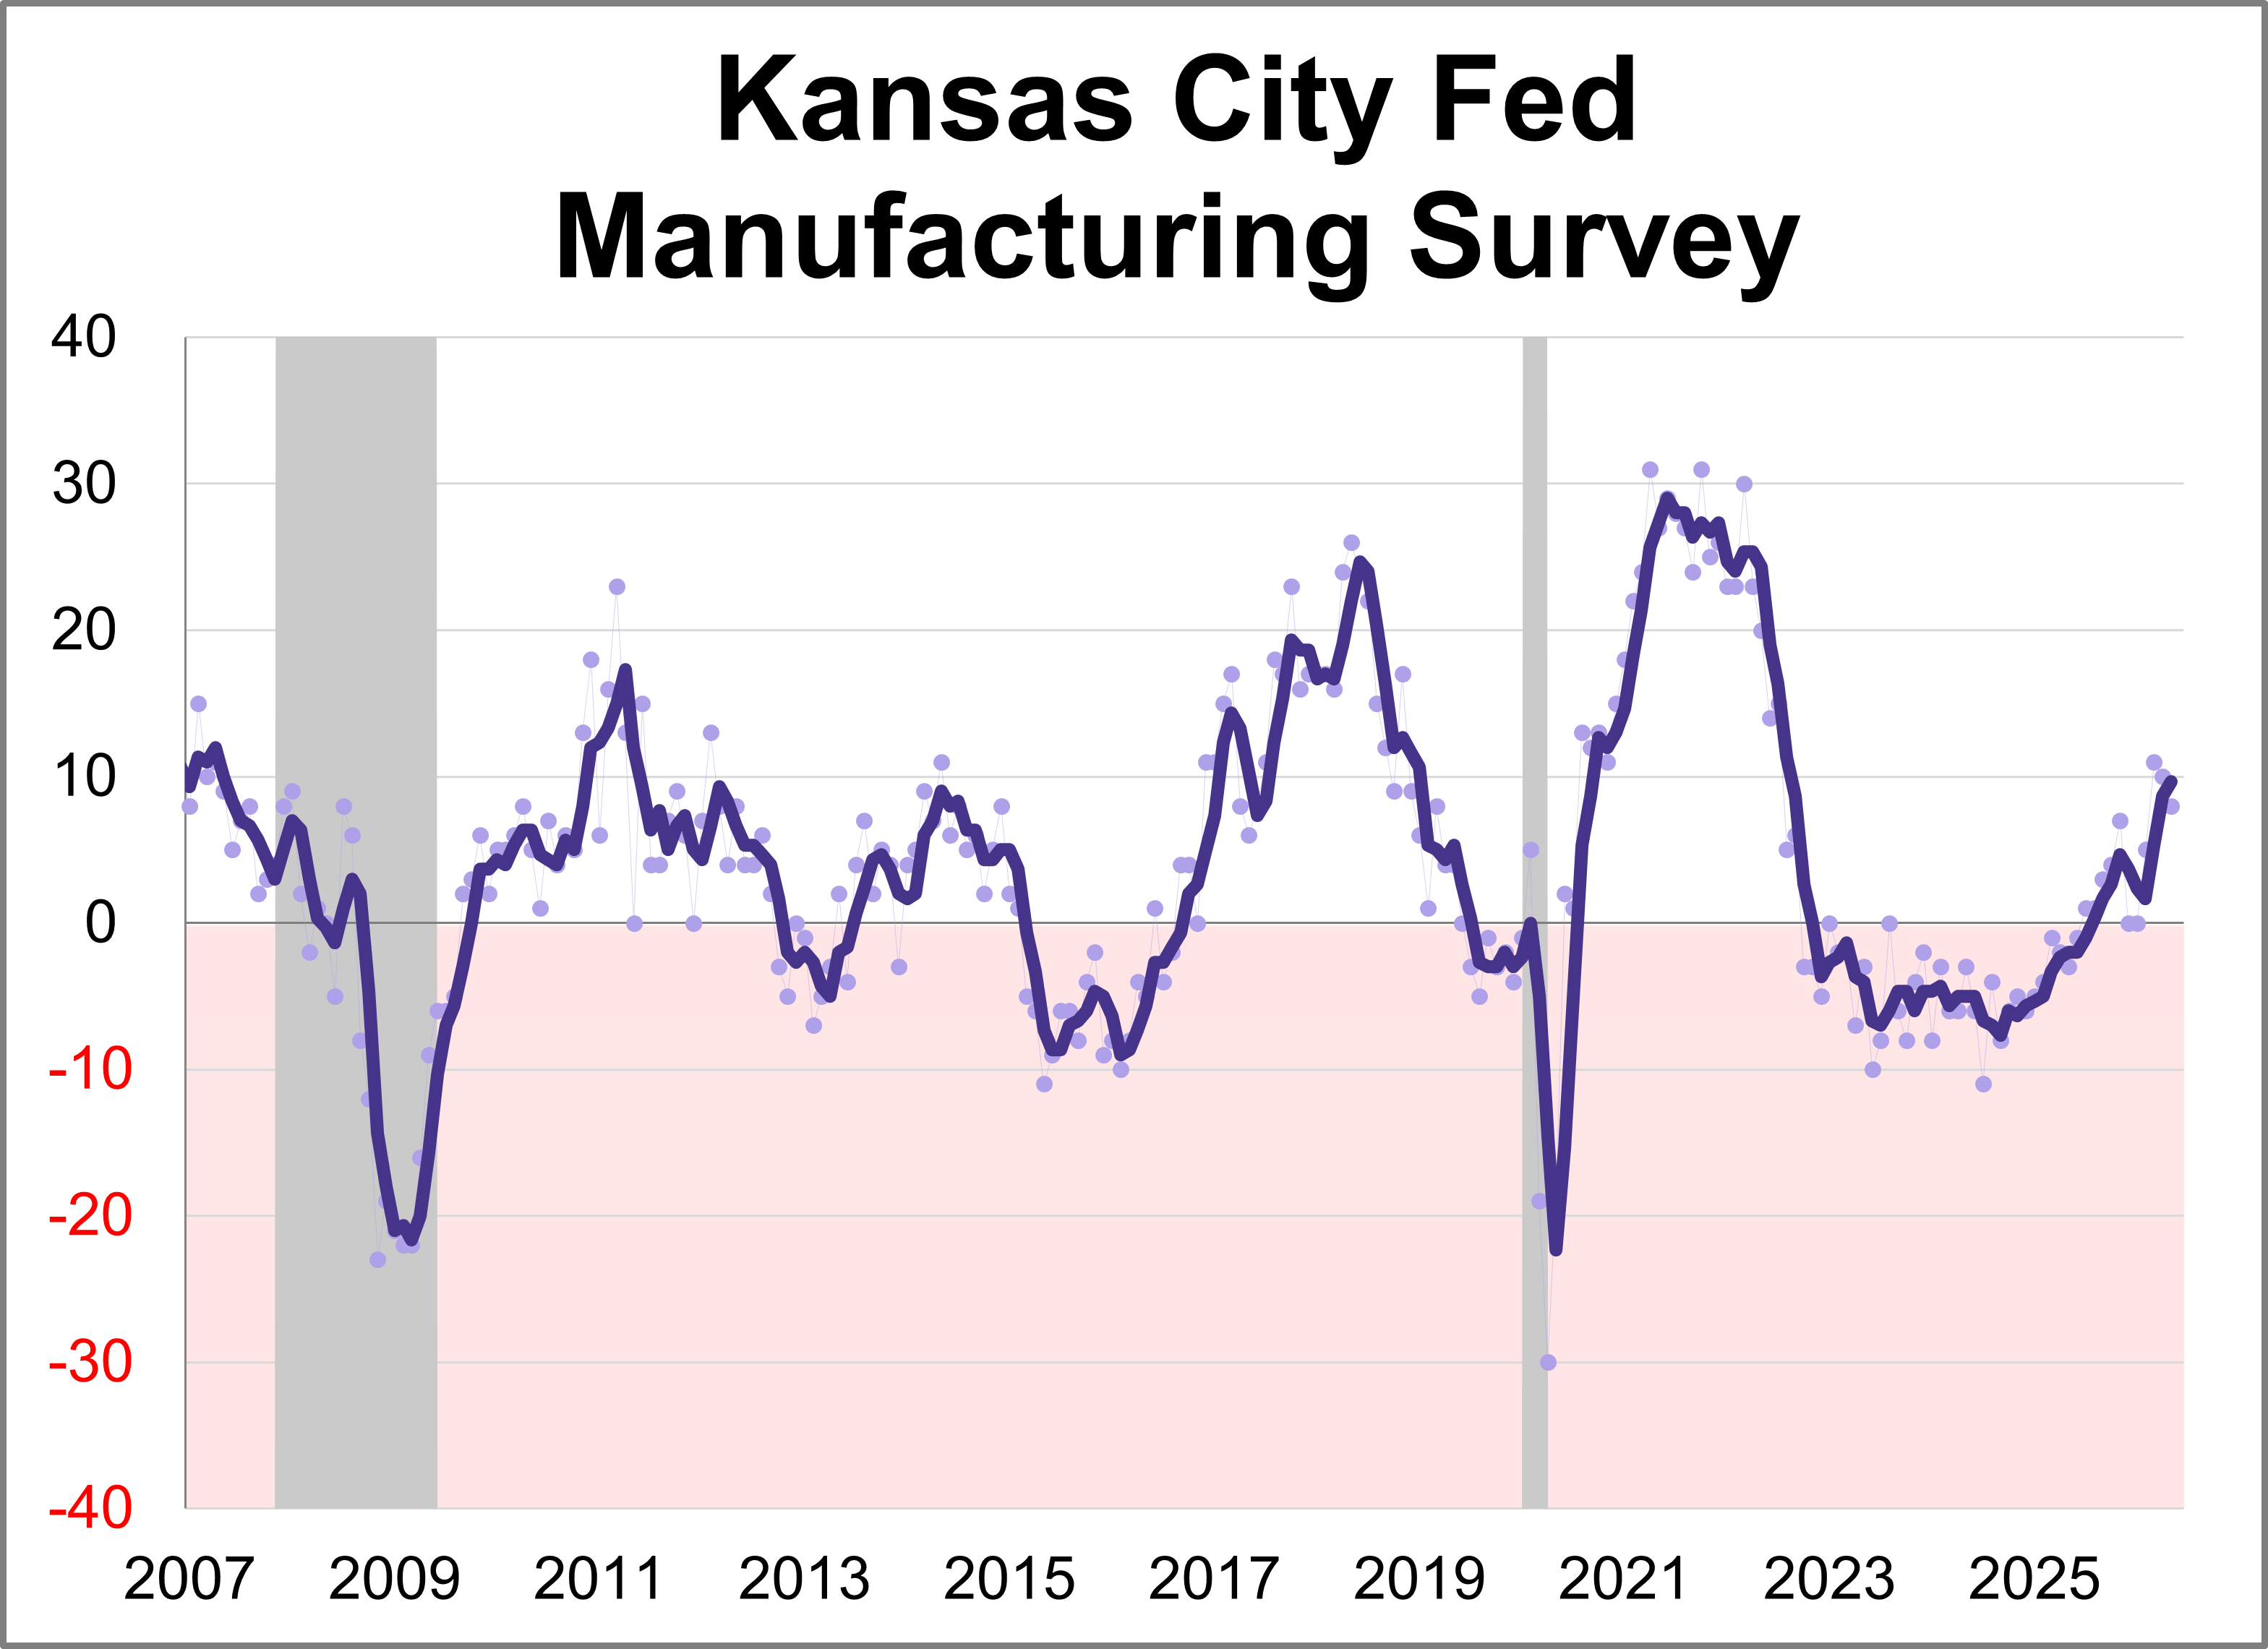
The Kansas City Fed Manufacturing Survey revealed regional activity continued to increase in May. The composite index came in at 8 this month, down slightly from 10 in April but still indicating continued expansion.
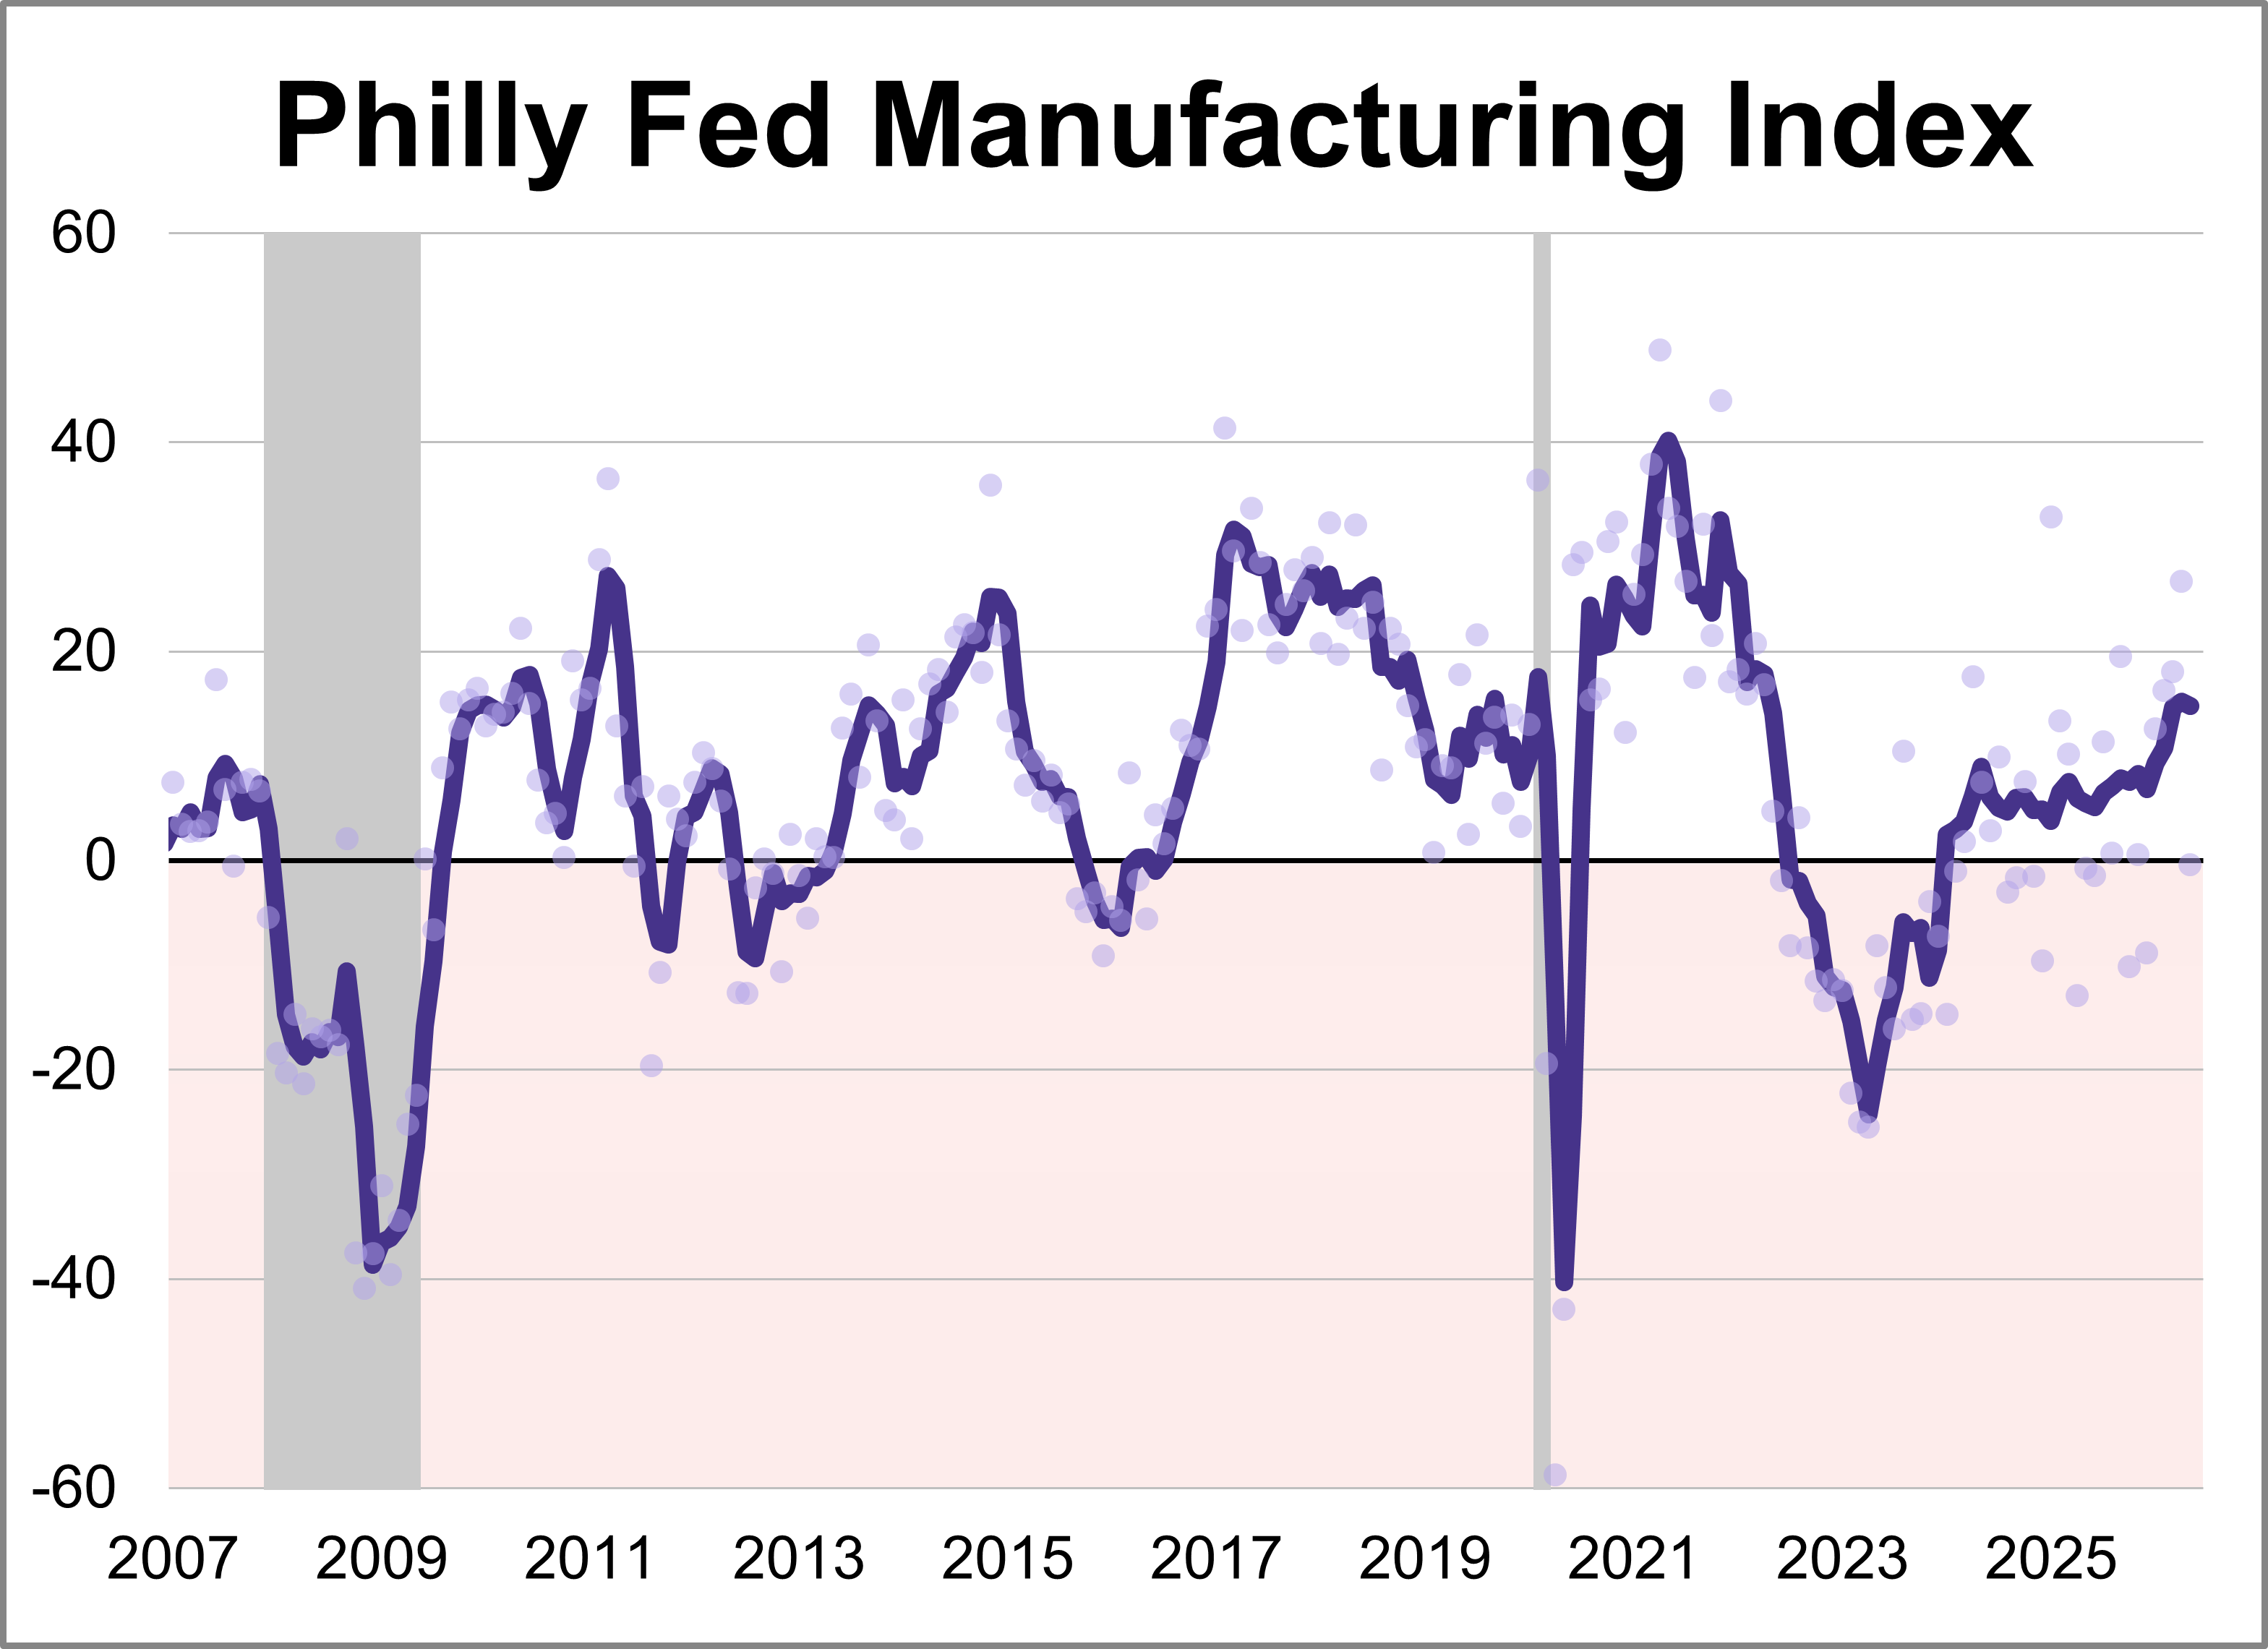
The latest Philadelphia Fed manufacturing index showed activity weakened in May, with the index sinking 27.1 points to -0.4. The latest reading marked the lowest level for the index this year and was worse than the forecast of 17.6.
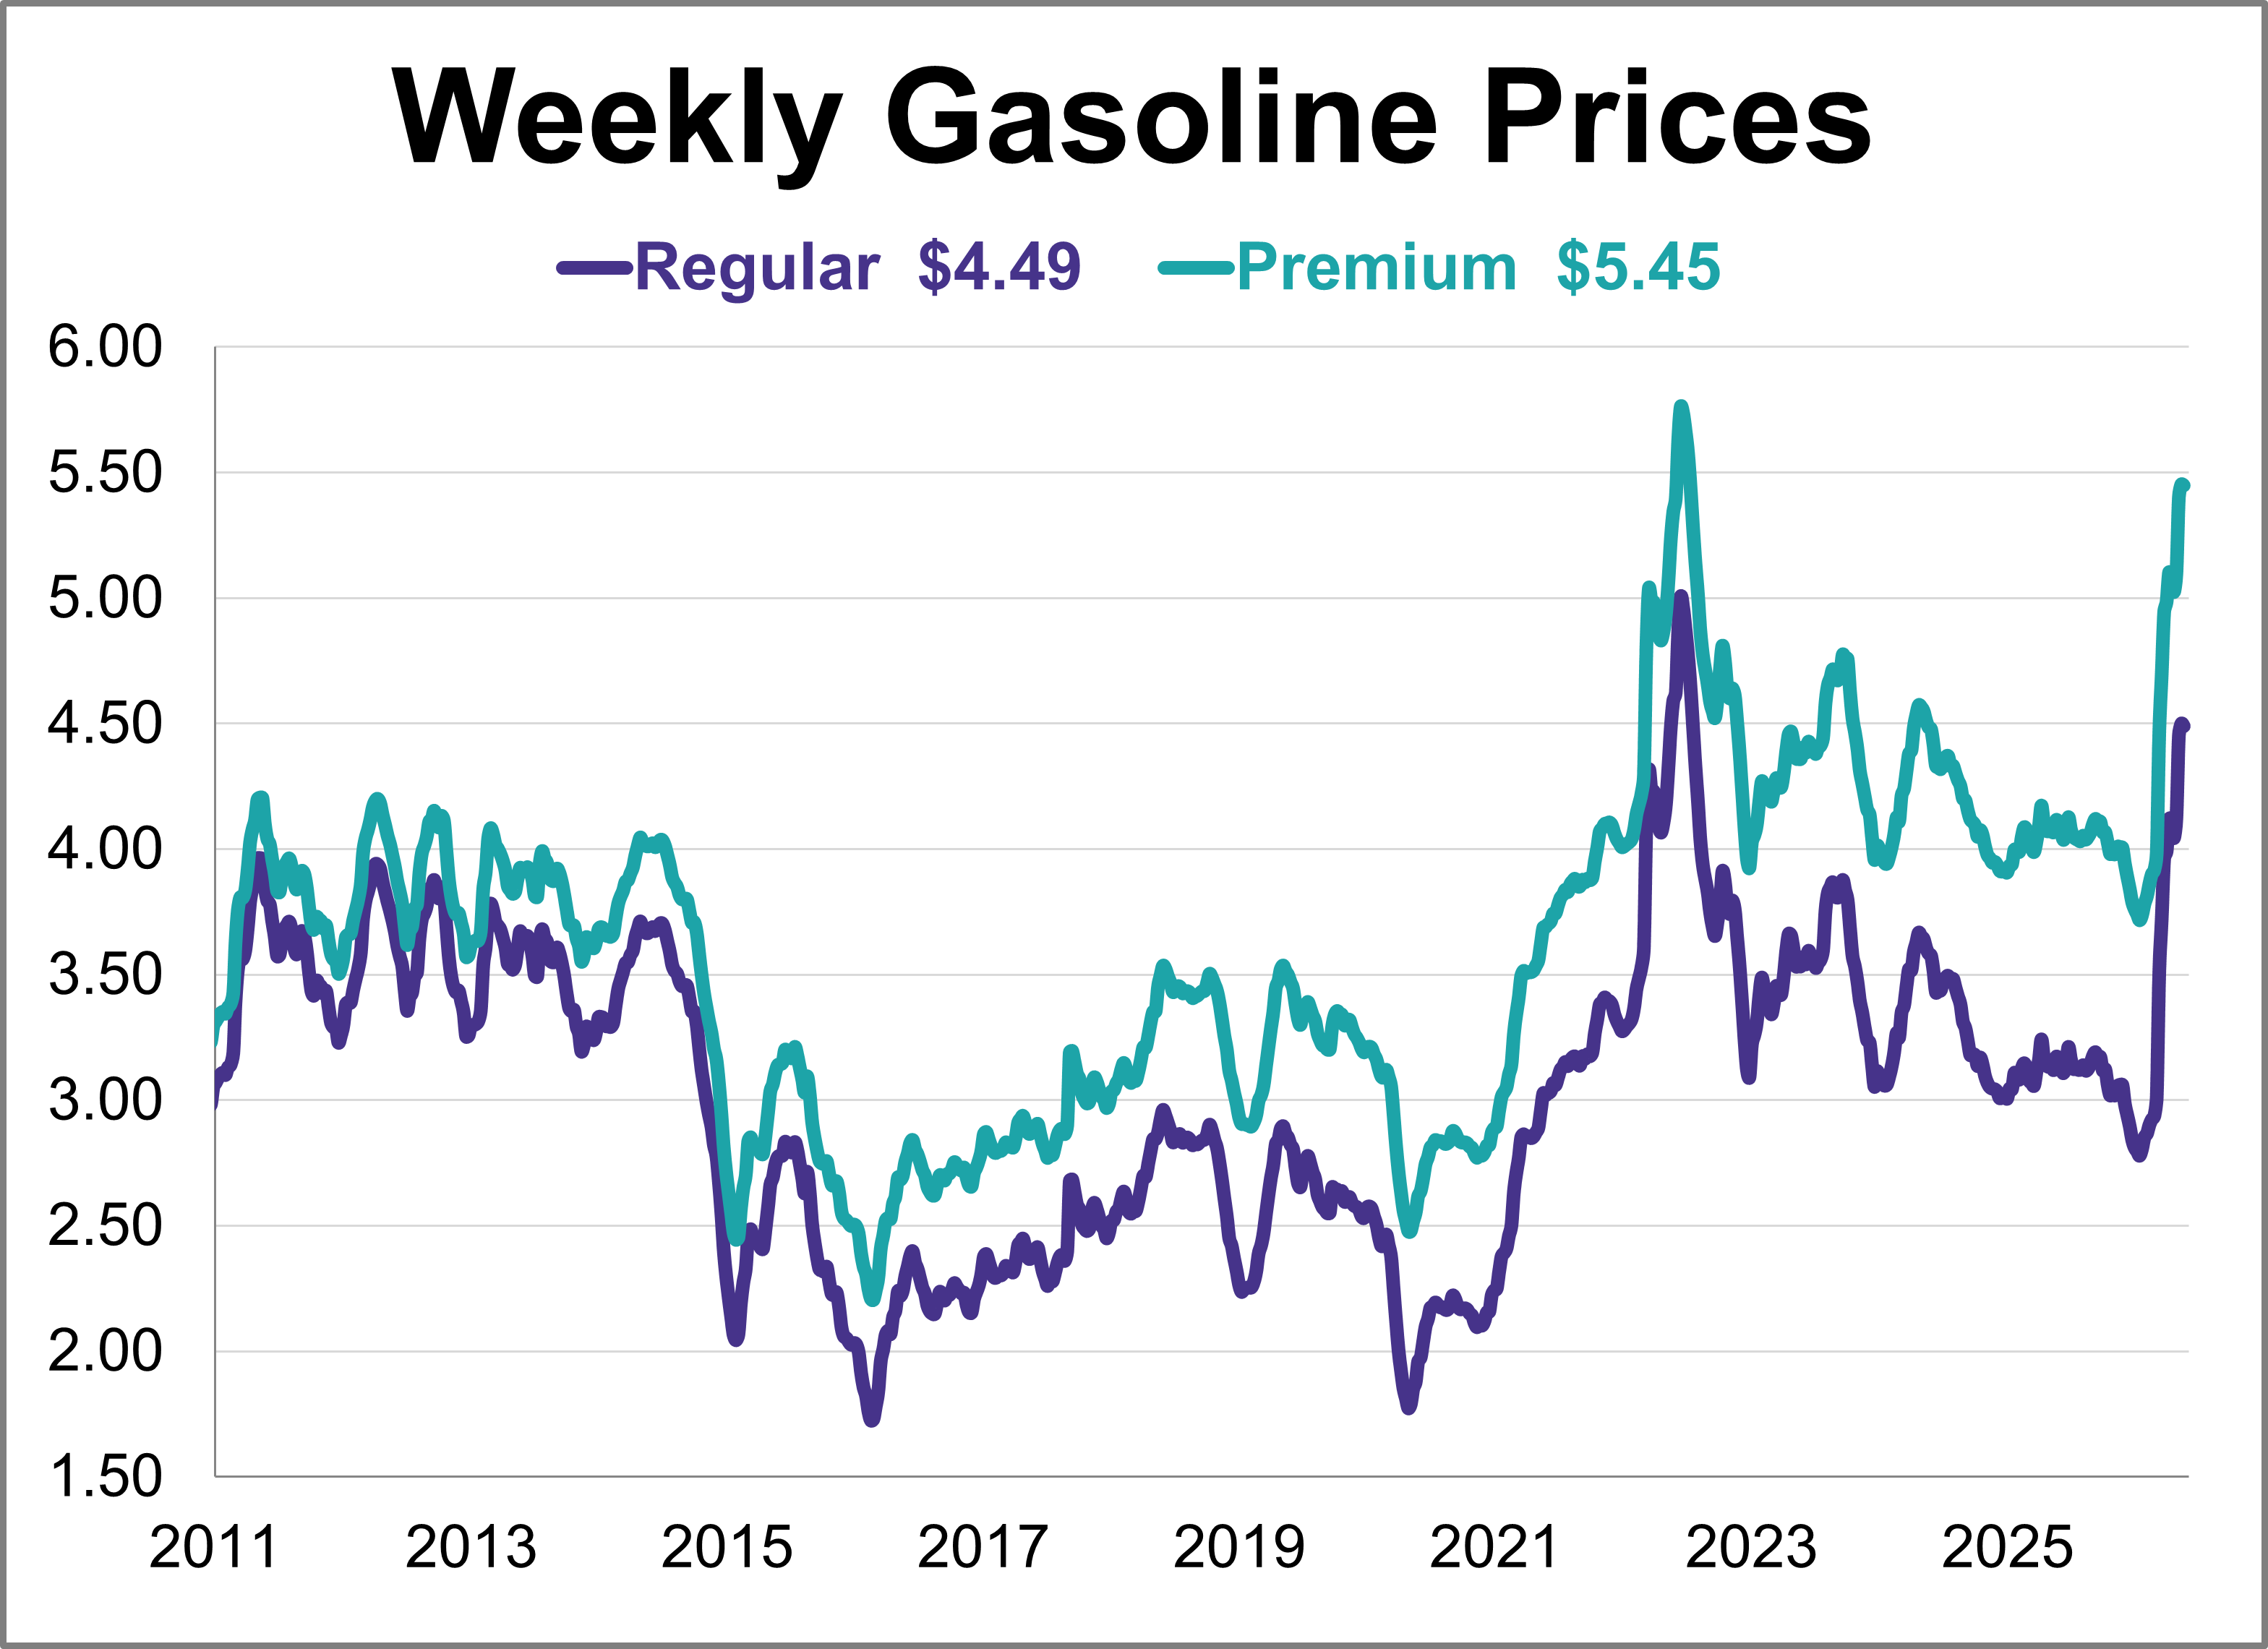
Gas prices were relatively flat this week, remaining at their highest level in nearly four years. As of May 18th, weekly prices were down 1 cent for regular and were unchanged for premium.
The U.S. economic landscape in April was defined by a significant rebound in inflation across both consumer and wholesale sectors, complicating the path for future monetary policy.
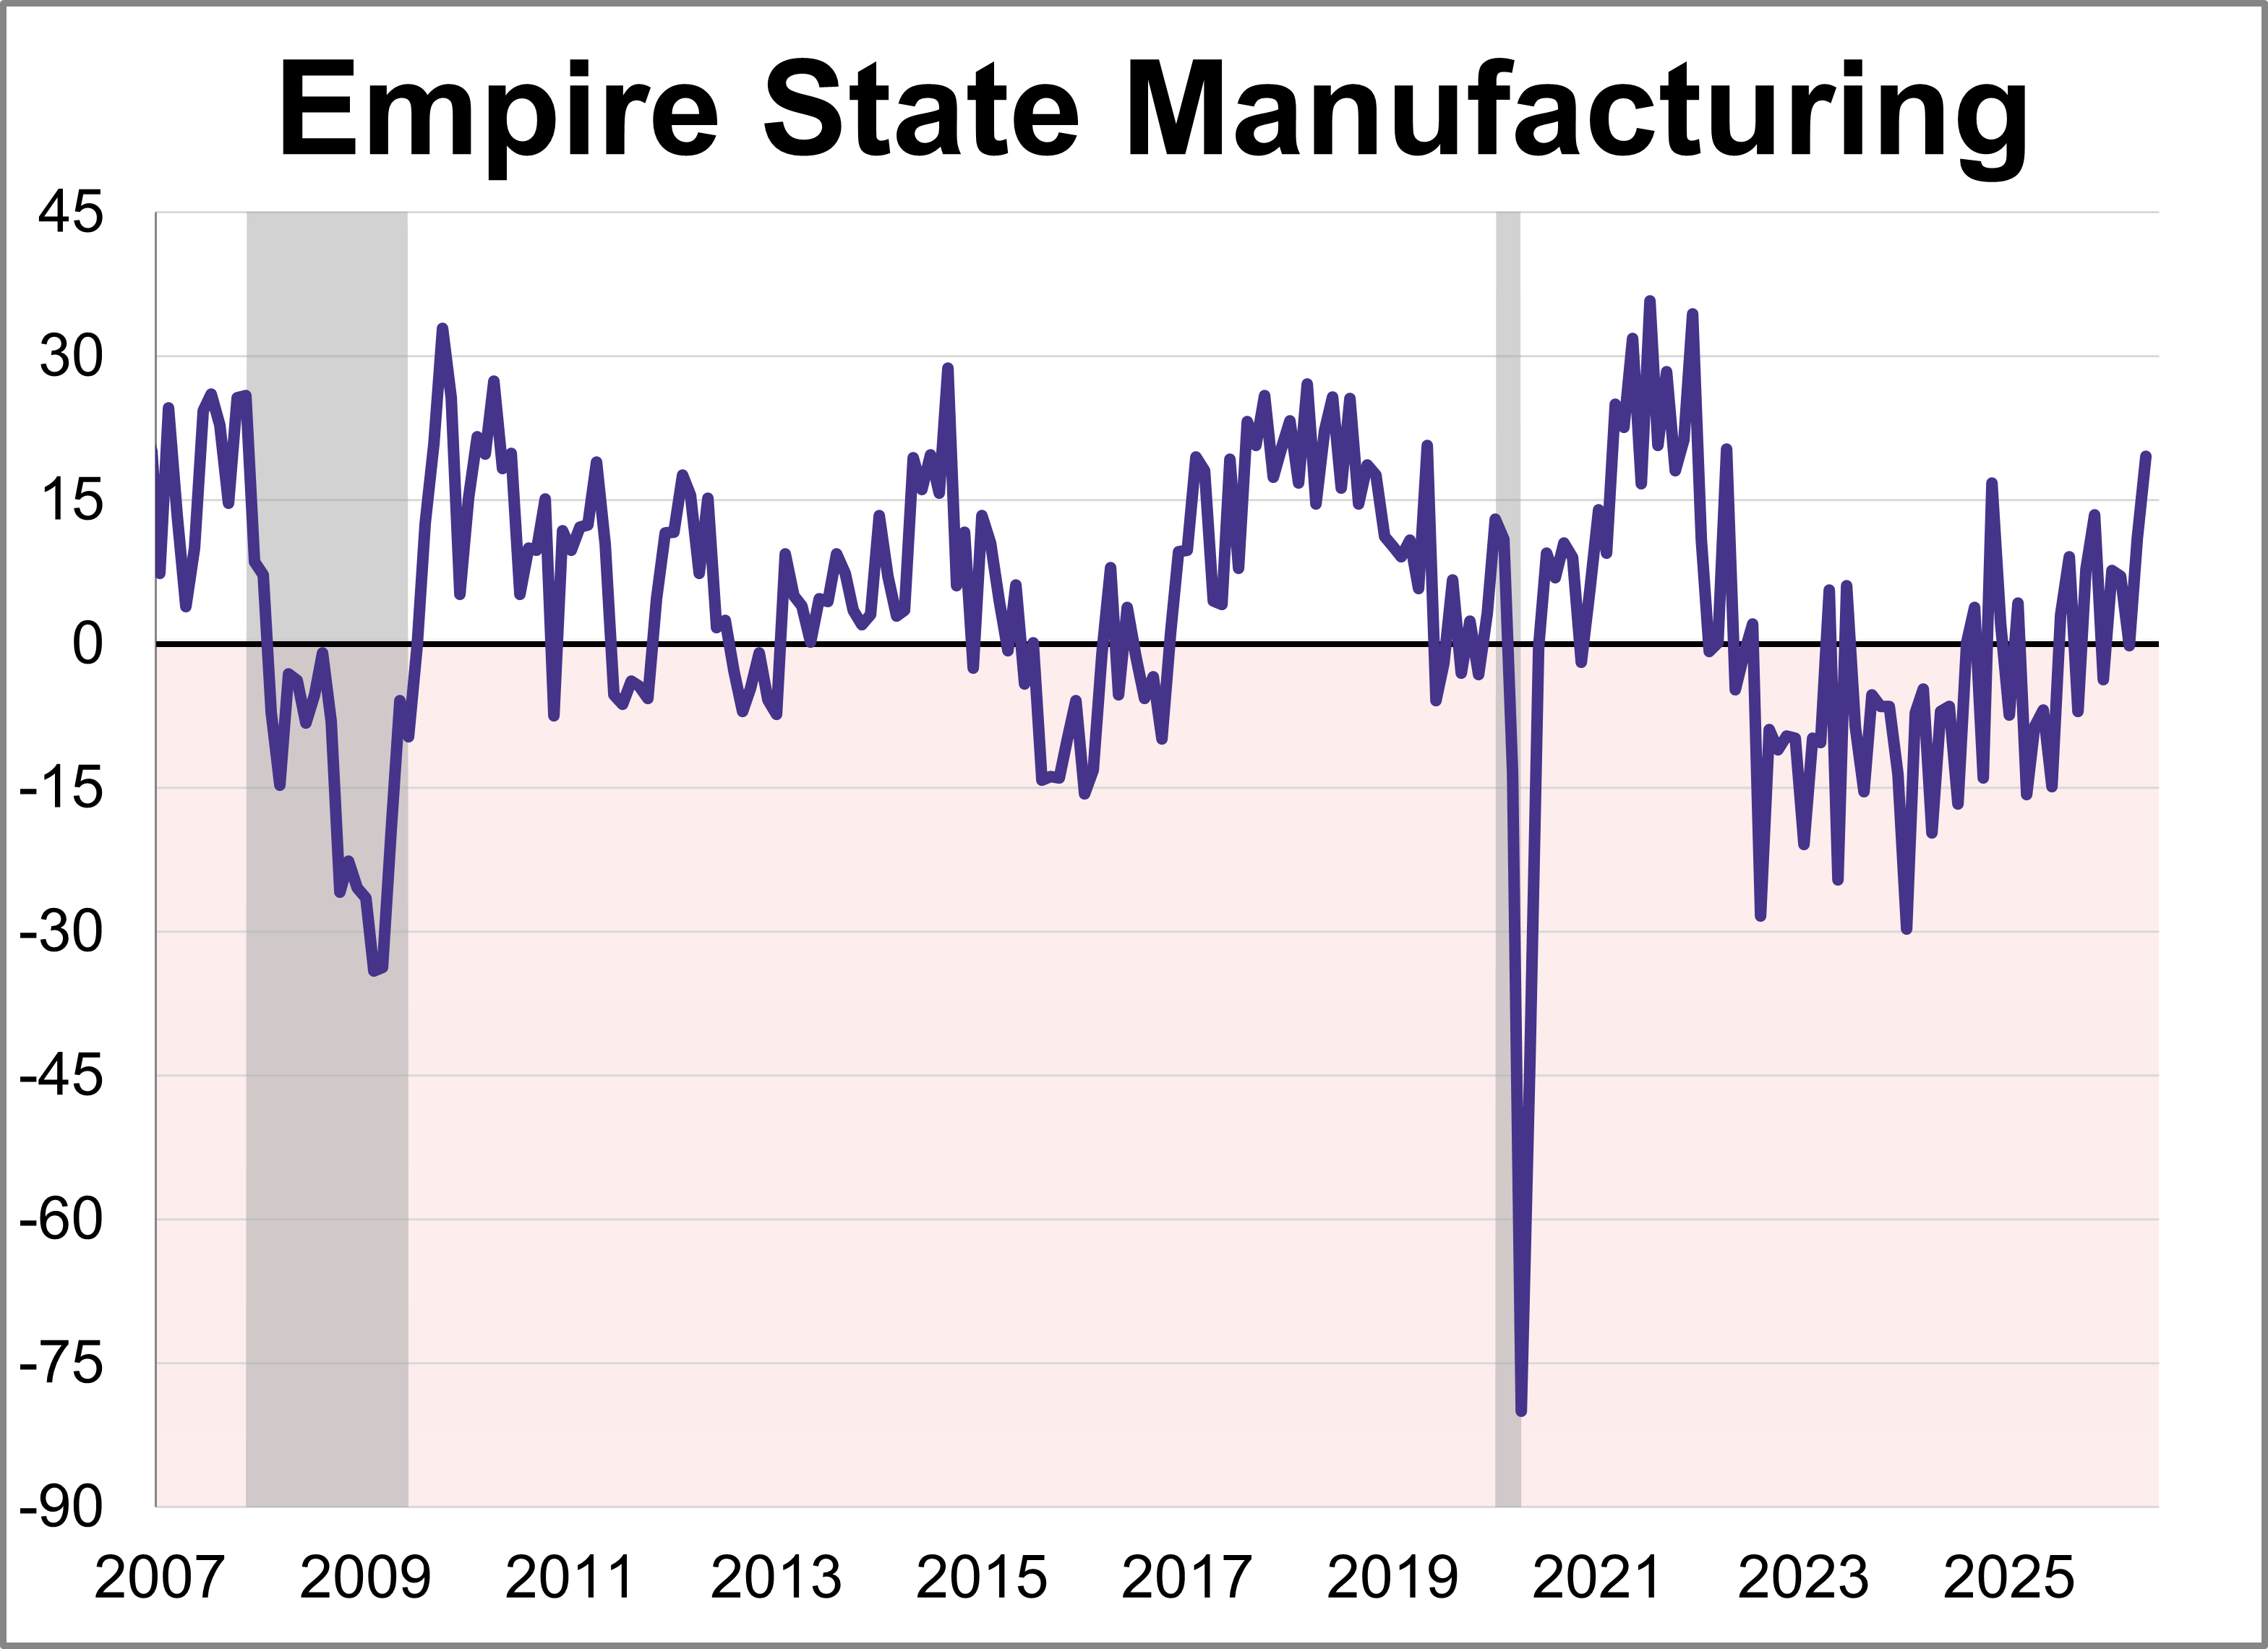
Manufacturing activity grew strongly in New York State, according to the Empire State Manufacturing May survey. The diffusion index for General Business Conditions rose 8.6 points to 19.6, its highest level in over four years.
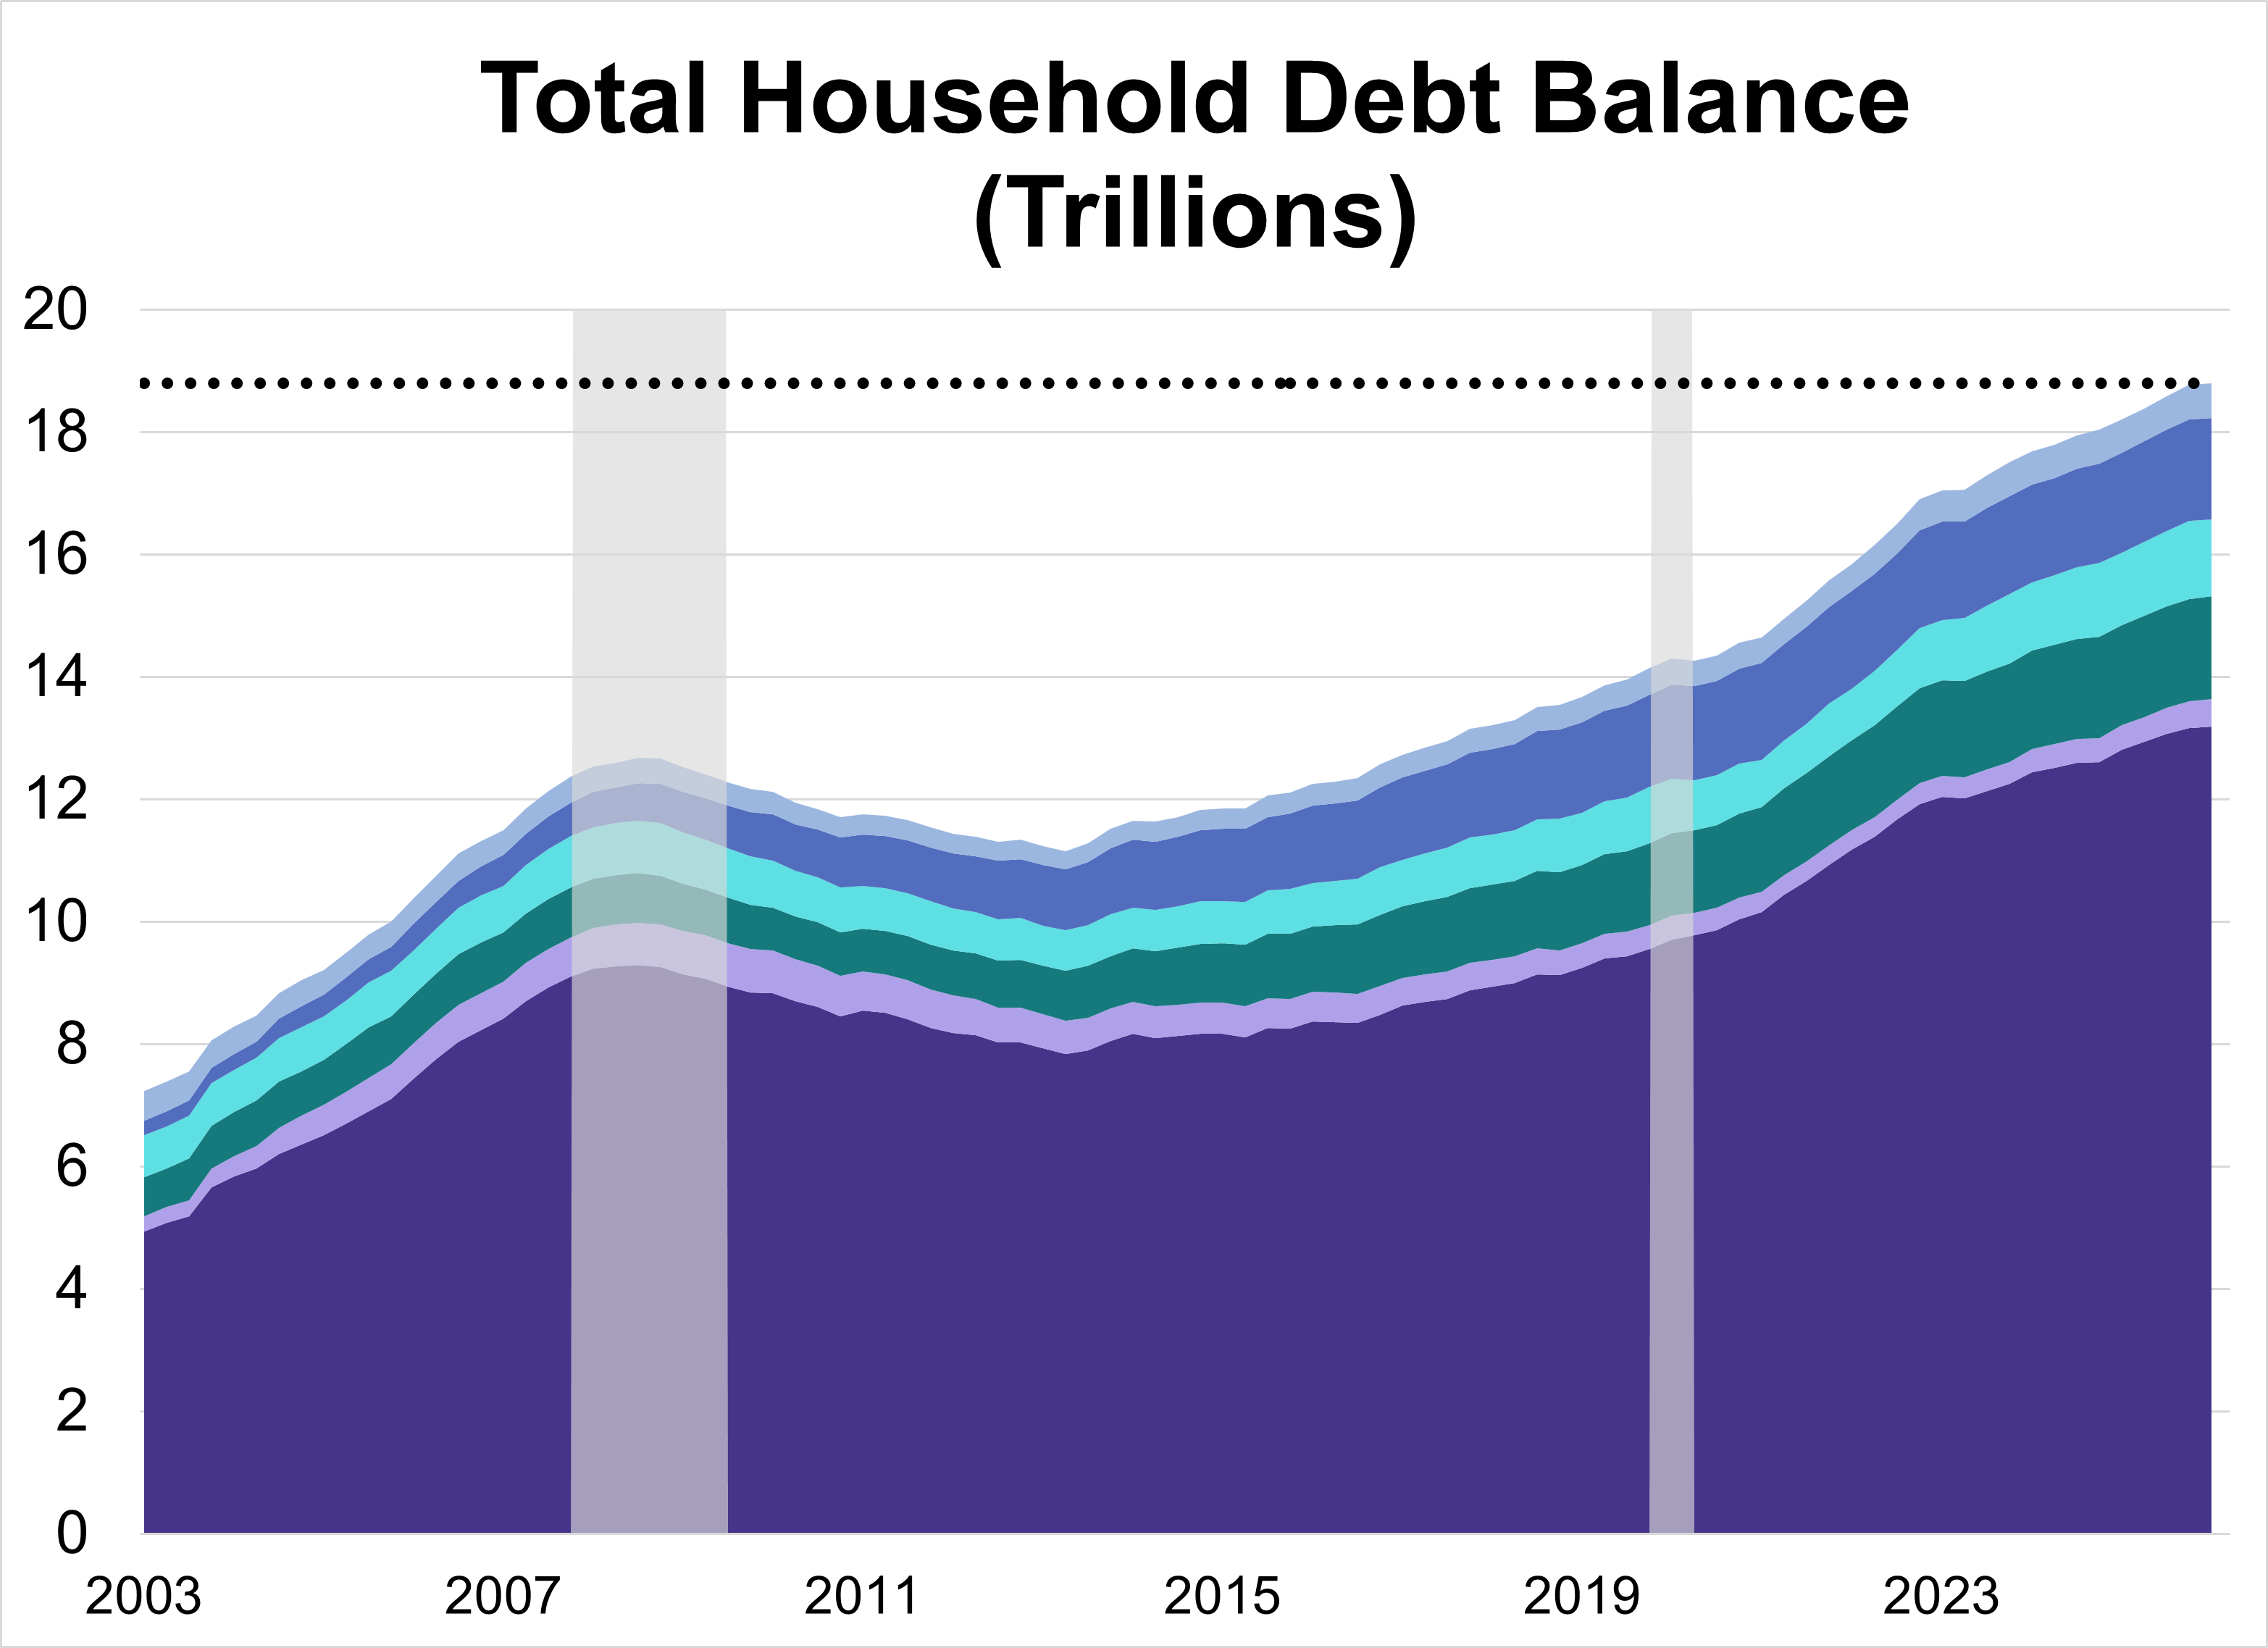
Total U.S. household debt climbed to a record $18.79 trillion in Q1 2026, a modest 0.1% ($18 billion) increase from the previous quarter. The overall rise was driven by increases across a handful of categories, specifically mortgage and auto loan balances.
The U.S. labor market demonstrated remarkable endurance in April, with job gains outpacing expectations and private sector expansion reaching its strongest point in over a year. As the Federal Reserve maintains a steady interest rate policy, the focus now turns to upcoming inflation and retail data to gauge the sustainability of this momentum.
The U.S. economy ended April with mixed signals: steady interest rates and high Fed dissent met persistent, energy-driven inflation. Despite these hurdles, accelerated Q1 growth and rising consumer confidence provided a buffer against ongoing global instability.
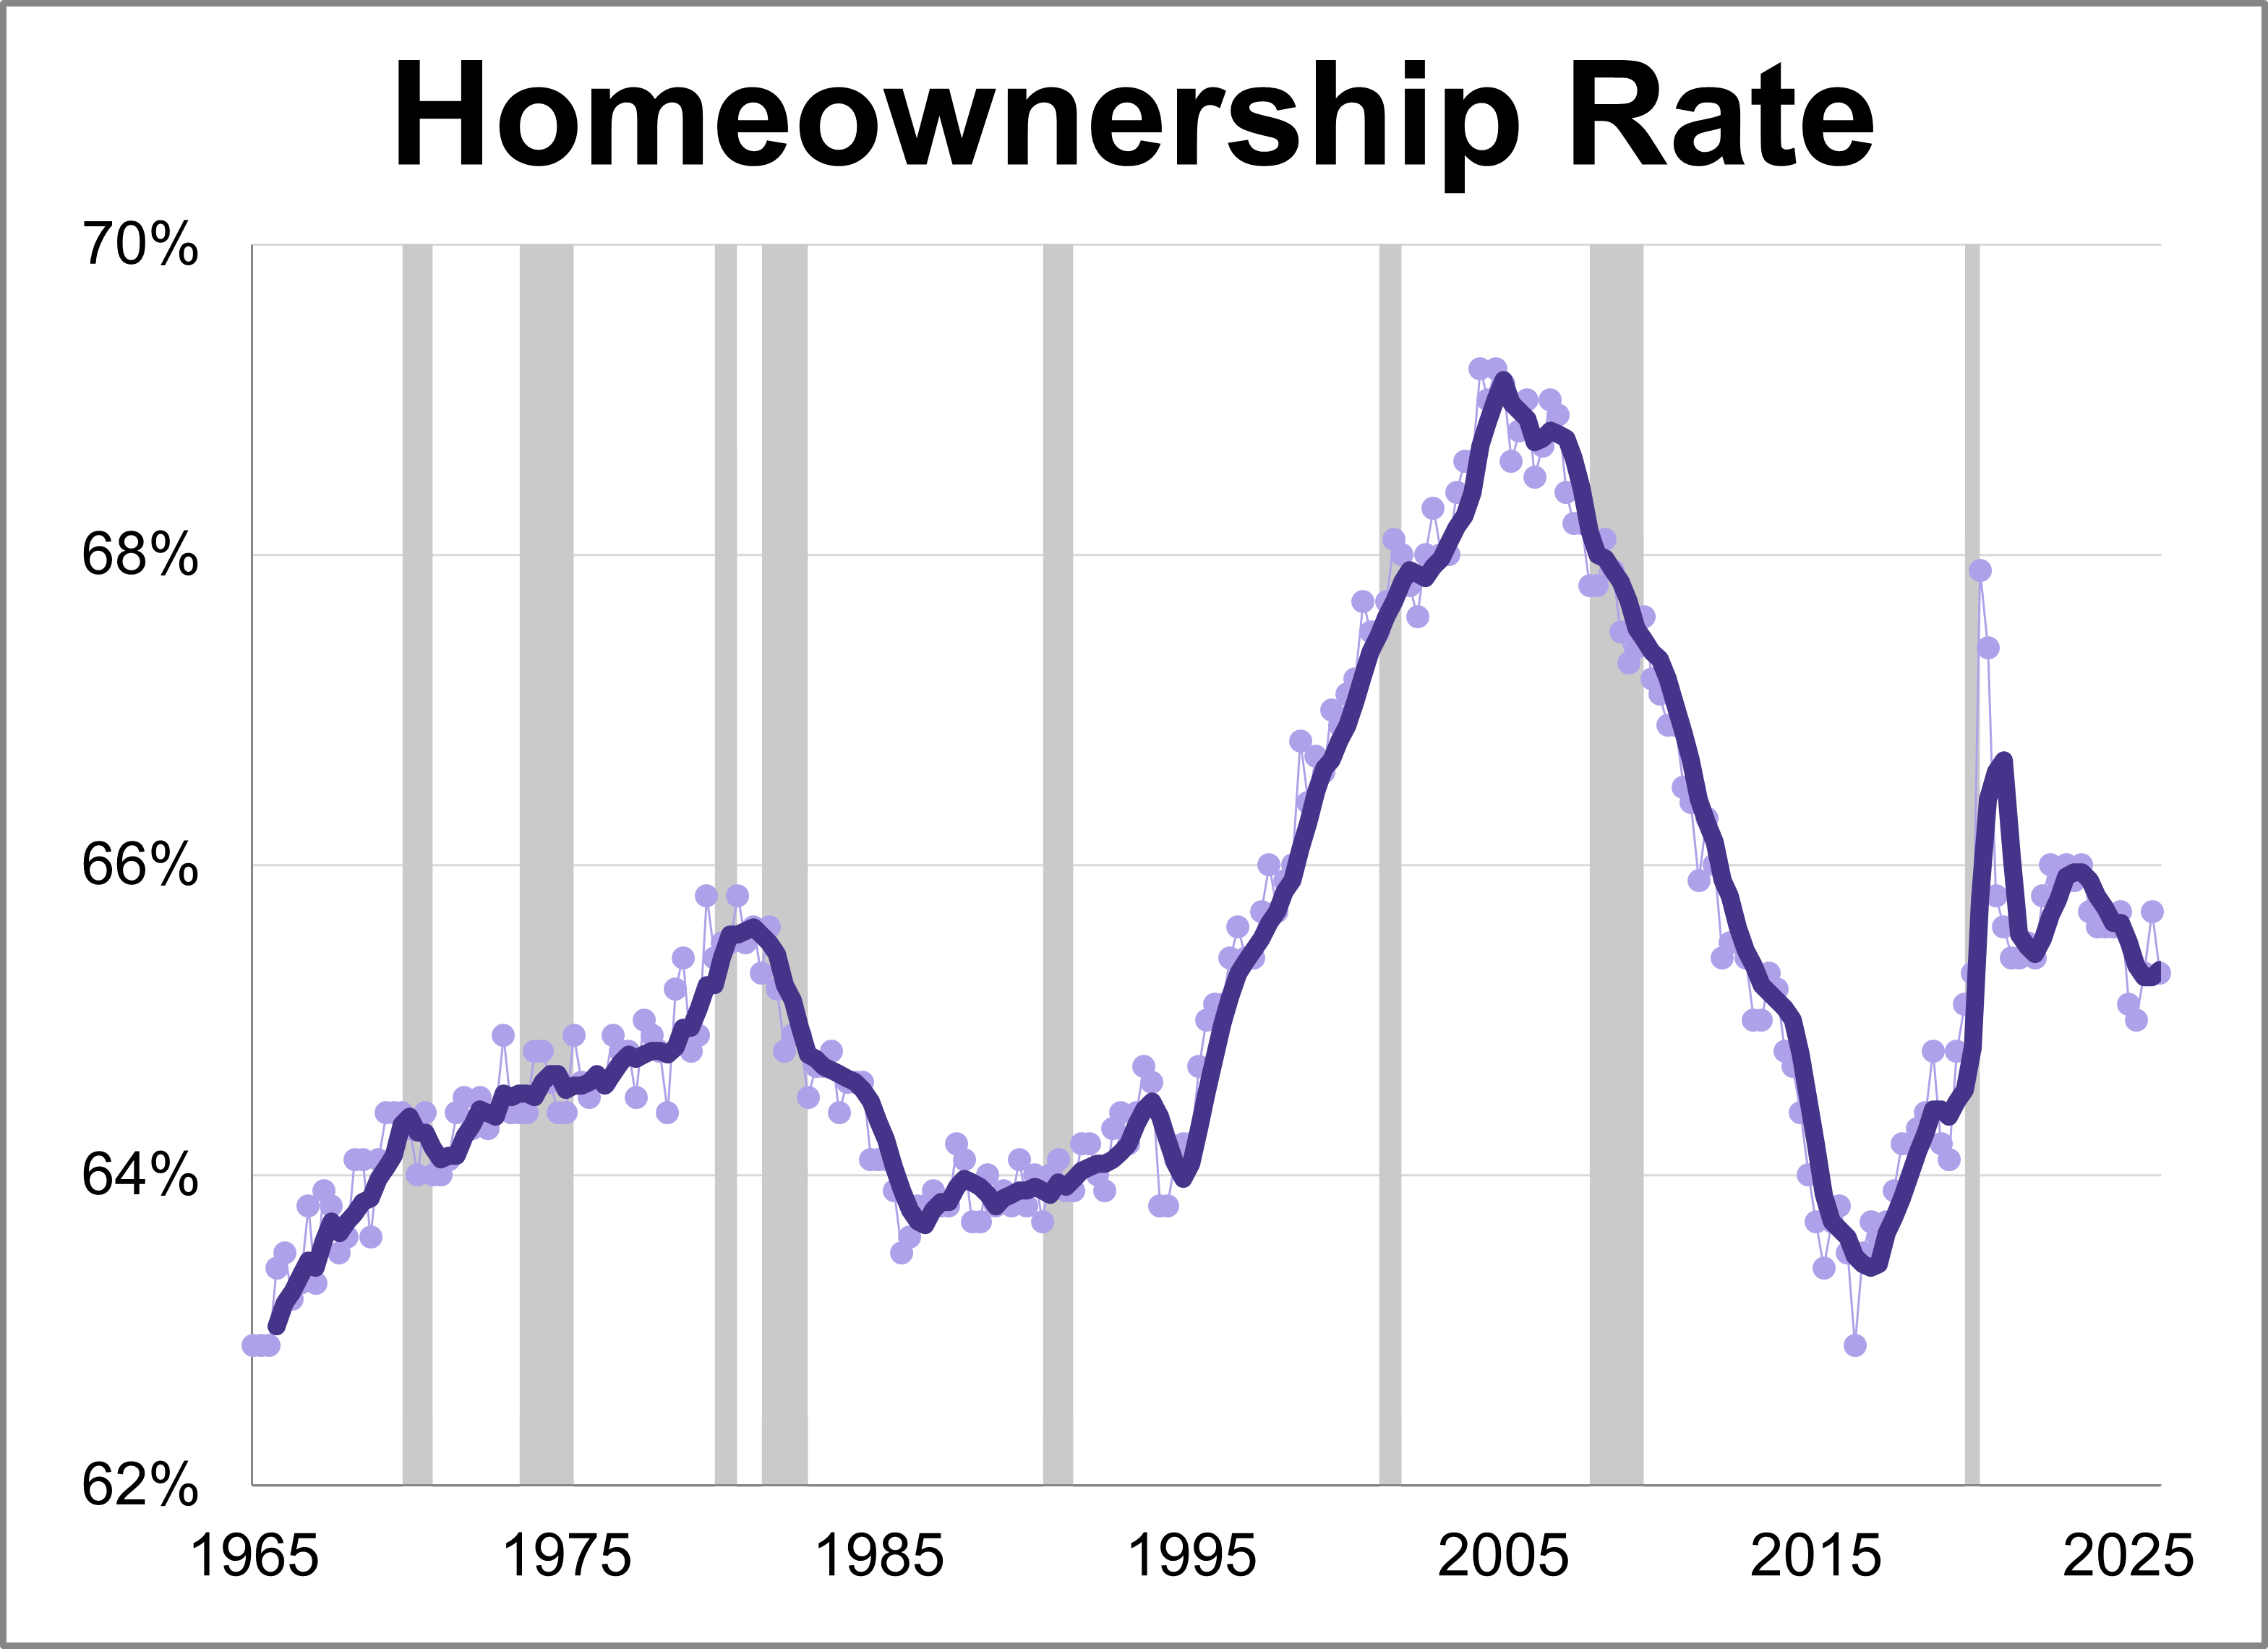
The Census Bureau released its latest quarterly report for Q1 2026 showing the latest homeownership rate is at 65.3%.
Fifth district manufacturing activity increased in April according to the most recent survey from the Federal Reserve Bank of Richmond. The composite manufacturing index rose three points points to 3, marking the highest level for the index in 20 months. This month's reading was above the forecast of 2.
Last week’s economic data was defined by conflicting signals from the consumer. While retail figures suggest resilience, sentiment levels have plummeted to record lows. Meanwhile, the S&P 500 continued its historic rally as markets prepare for the upcoming Fed decision.
While recent market performance reflects optimism over potential geopolitical de-escalation, underlying economic data reveals a complex landscape of intensifying price pressures and cooling growth. This article examines the major economic news from the week of April 6-10th, 2026.
While recent market performance reflects optimism over potential geopolitical de-escalation, underlying economic data reveals a complex landscape of intensifying price pressures and cooling growth.
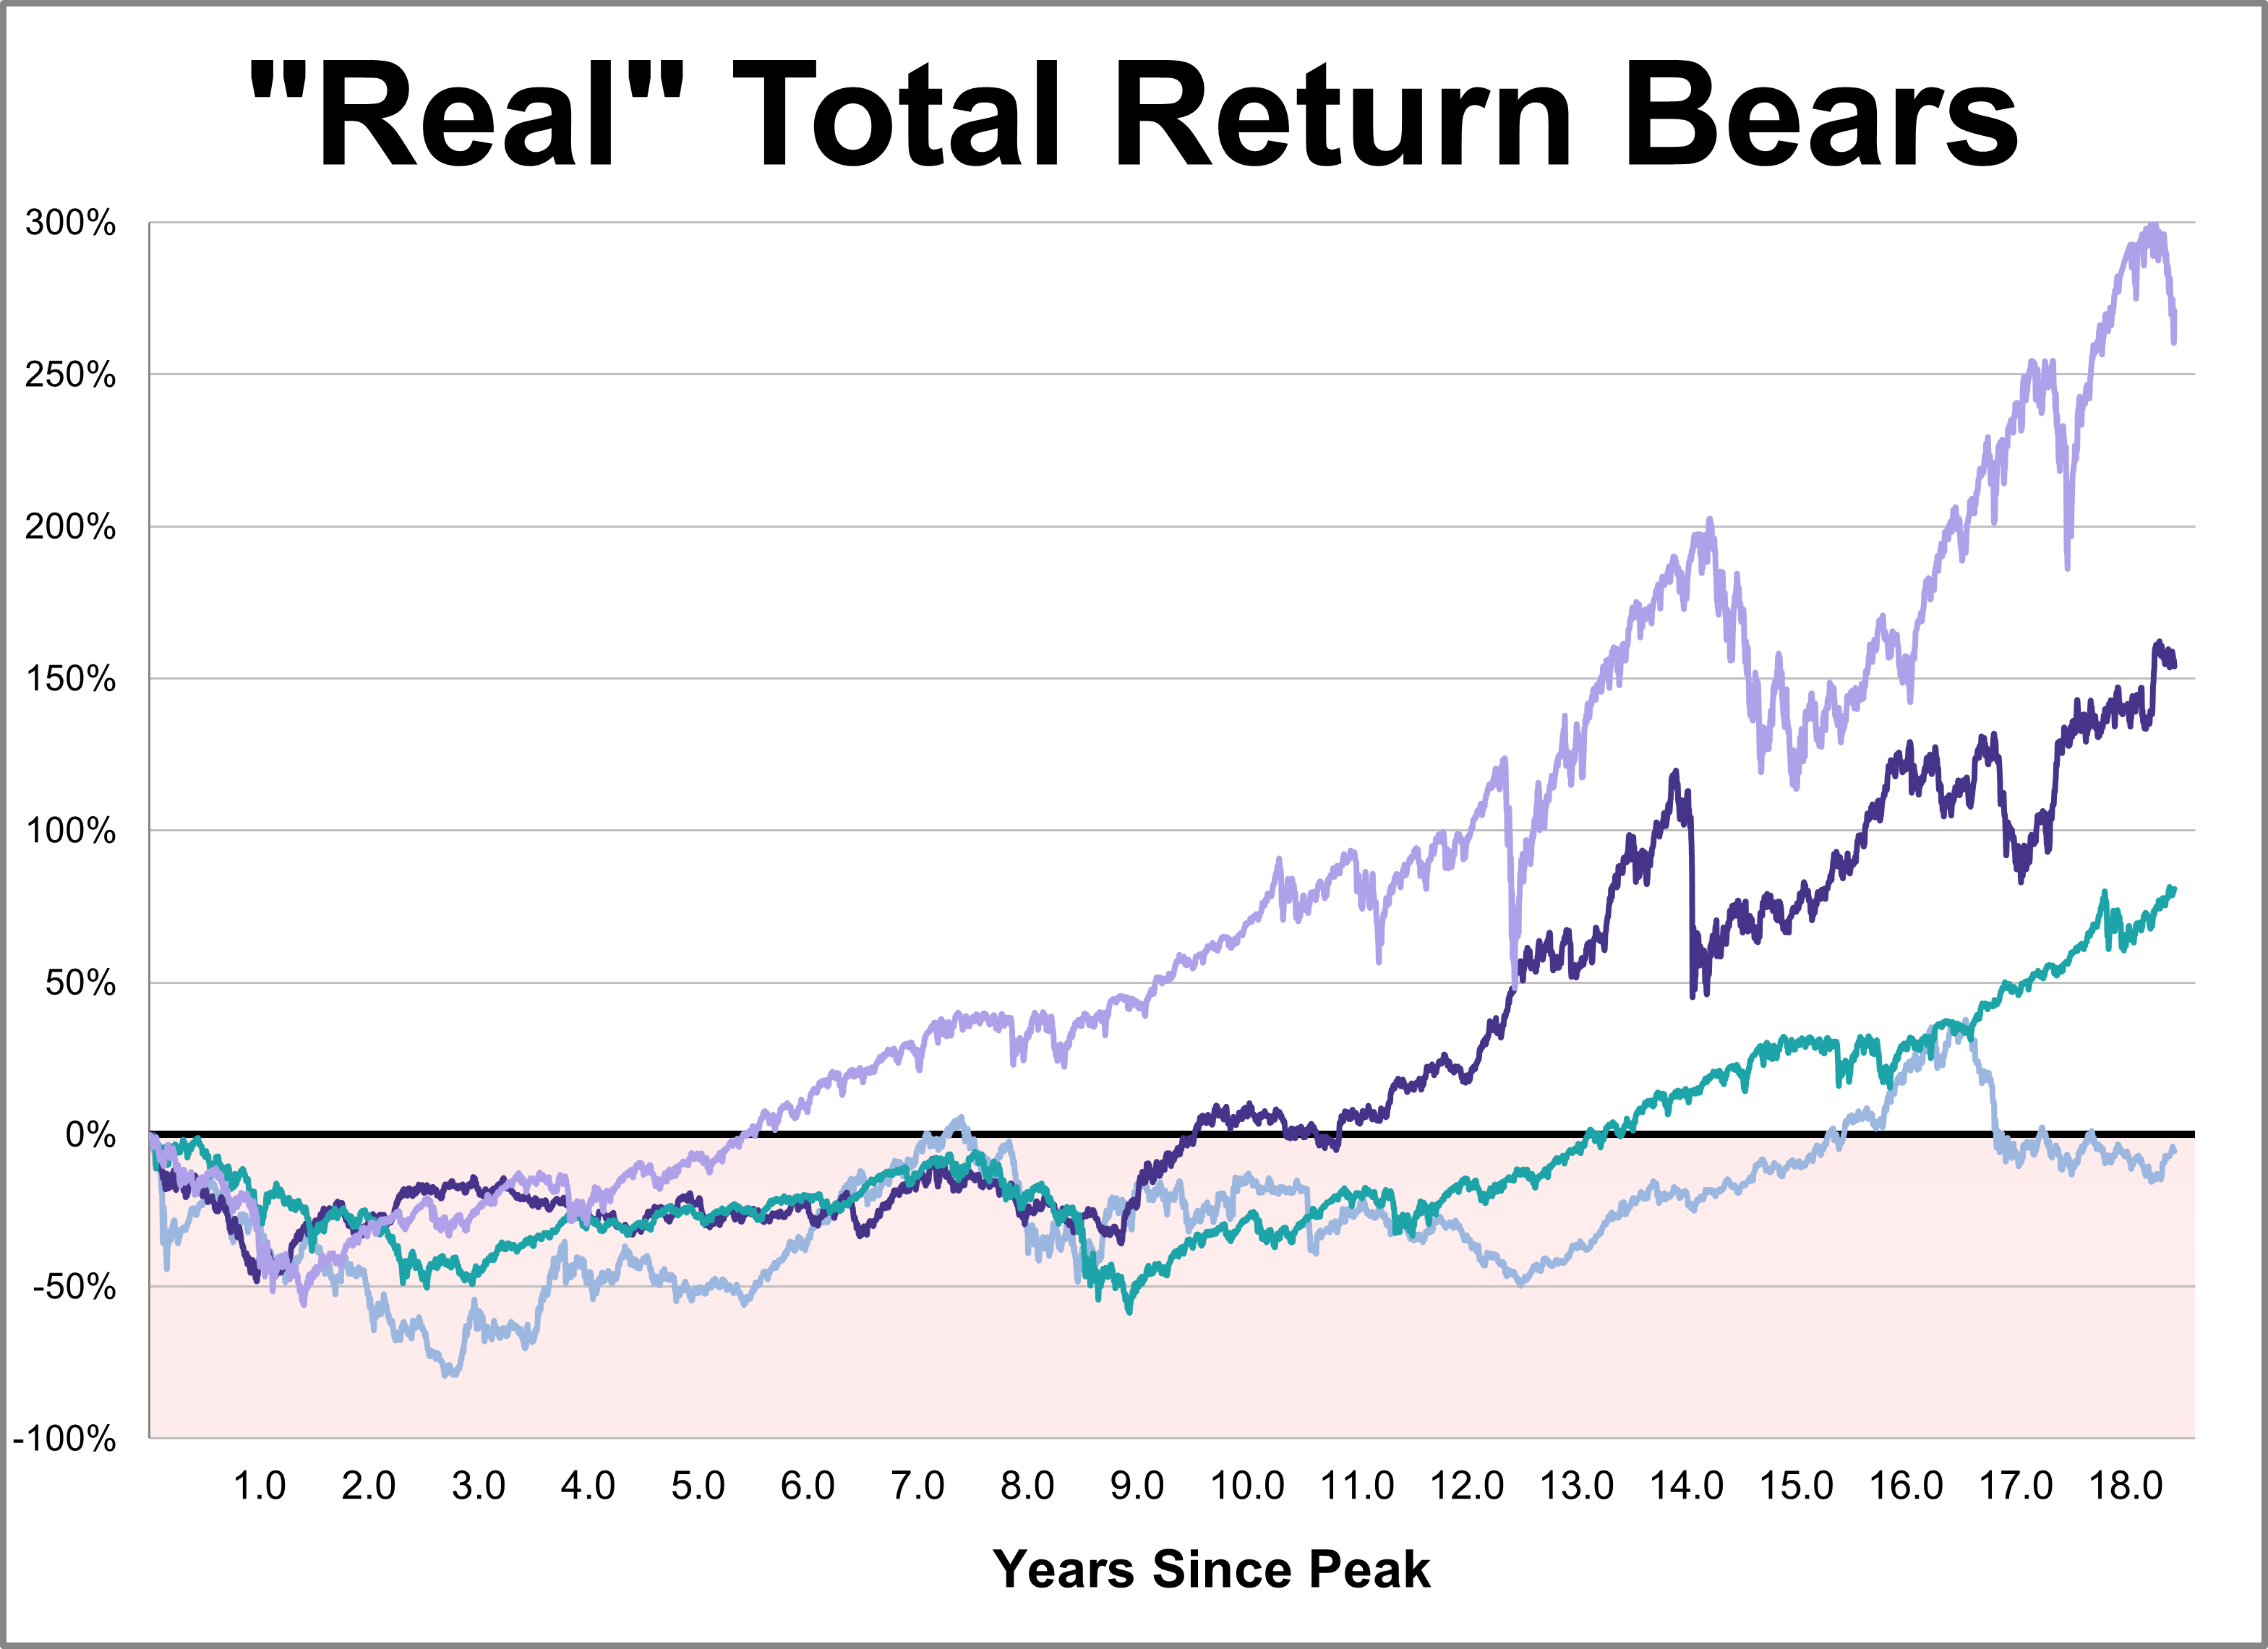
While every market downturn is unique, history offers a crucial lens for understanding recovery. This chart series provides a comprehensive overlay of the Four Bad Bears in U.S. history since the 1929 peak, comparing their recovery paths through the S&P 500's close on March 31, 2026.
Heavily influenced by escalating geopolitical conflicts, last week's economic snapshot reveals a sharp erosion of confidence among consumers and investors alike.
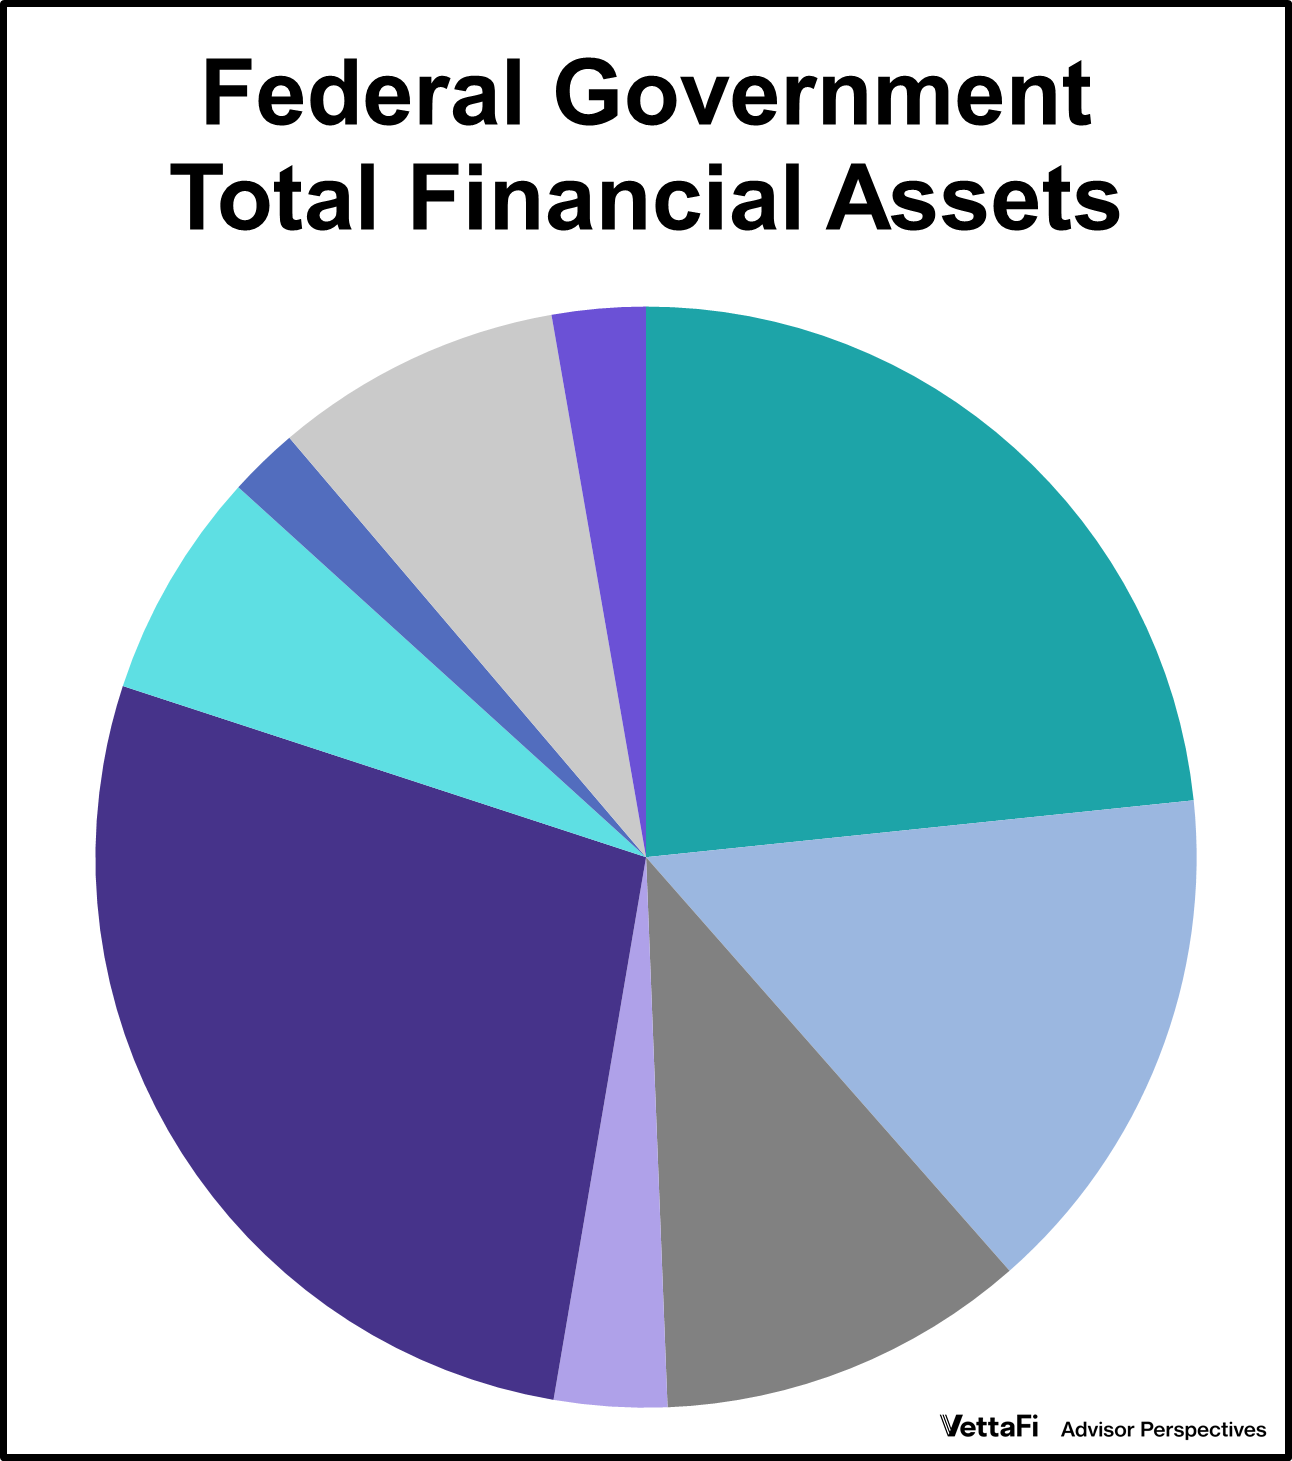
When we think of the U.S. government's finances, we often focus on the massive debt. But what about the assets? What does Uncle Sam actually own, and which asset is the largest?
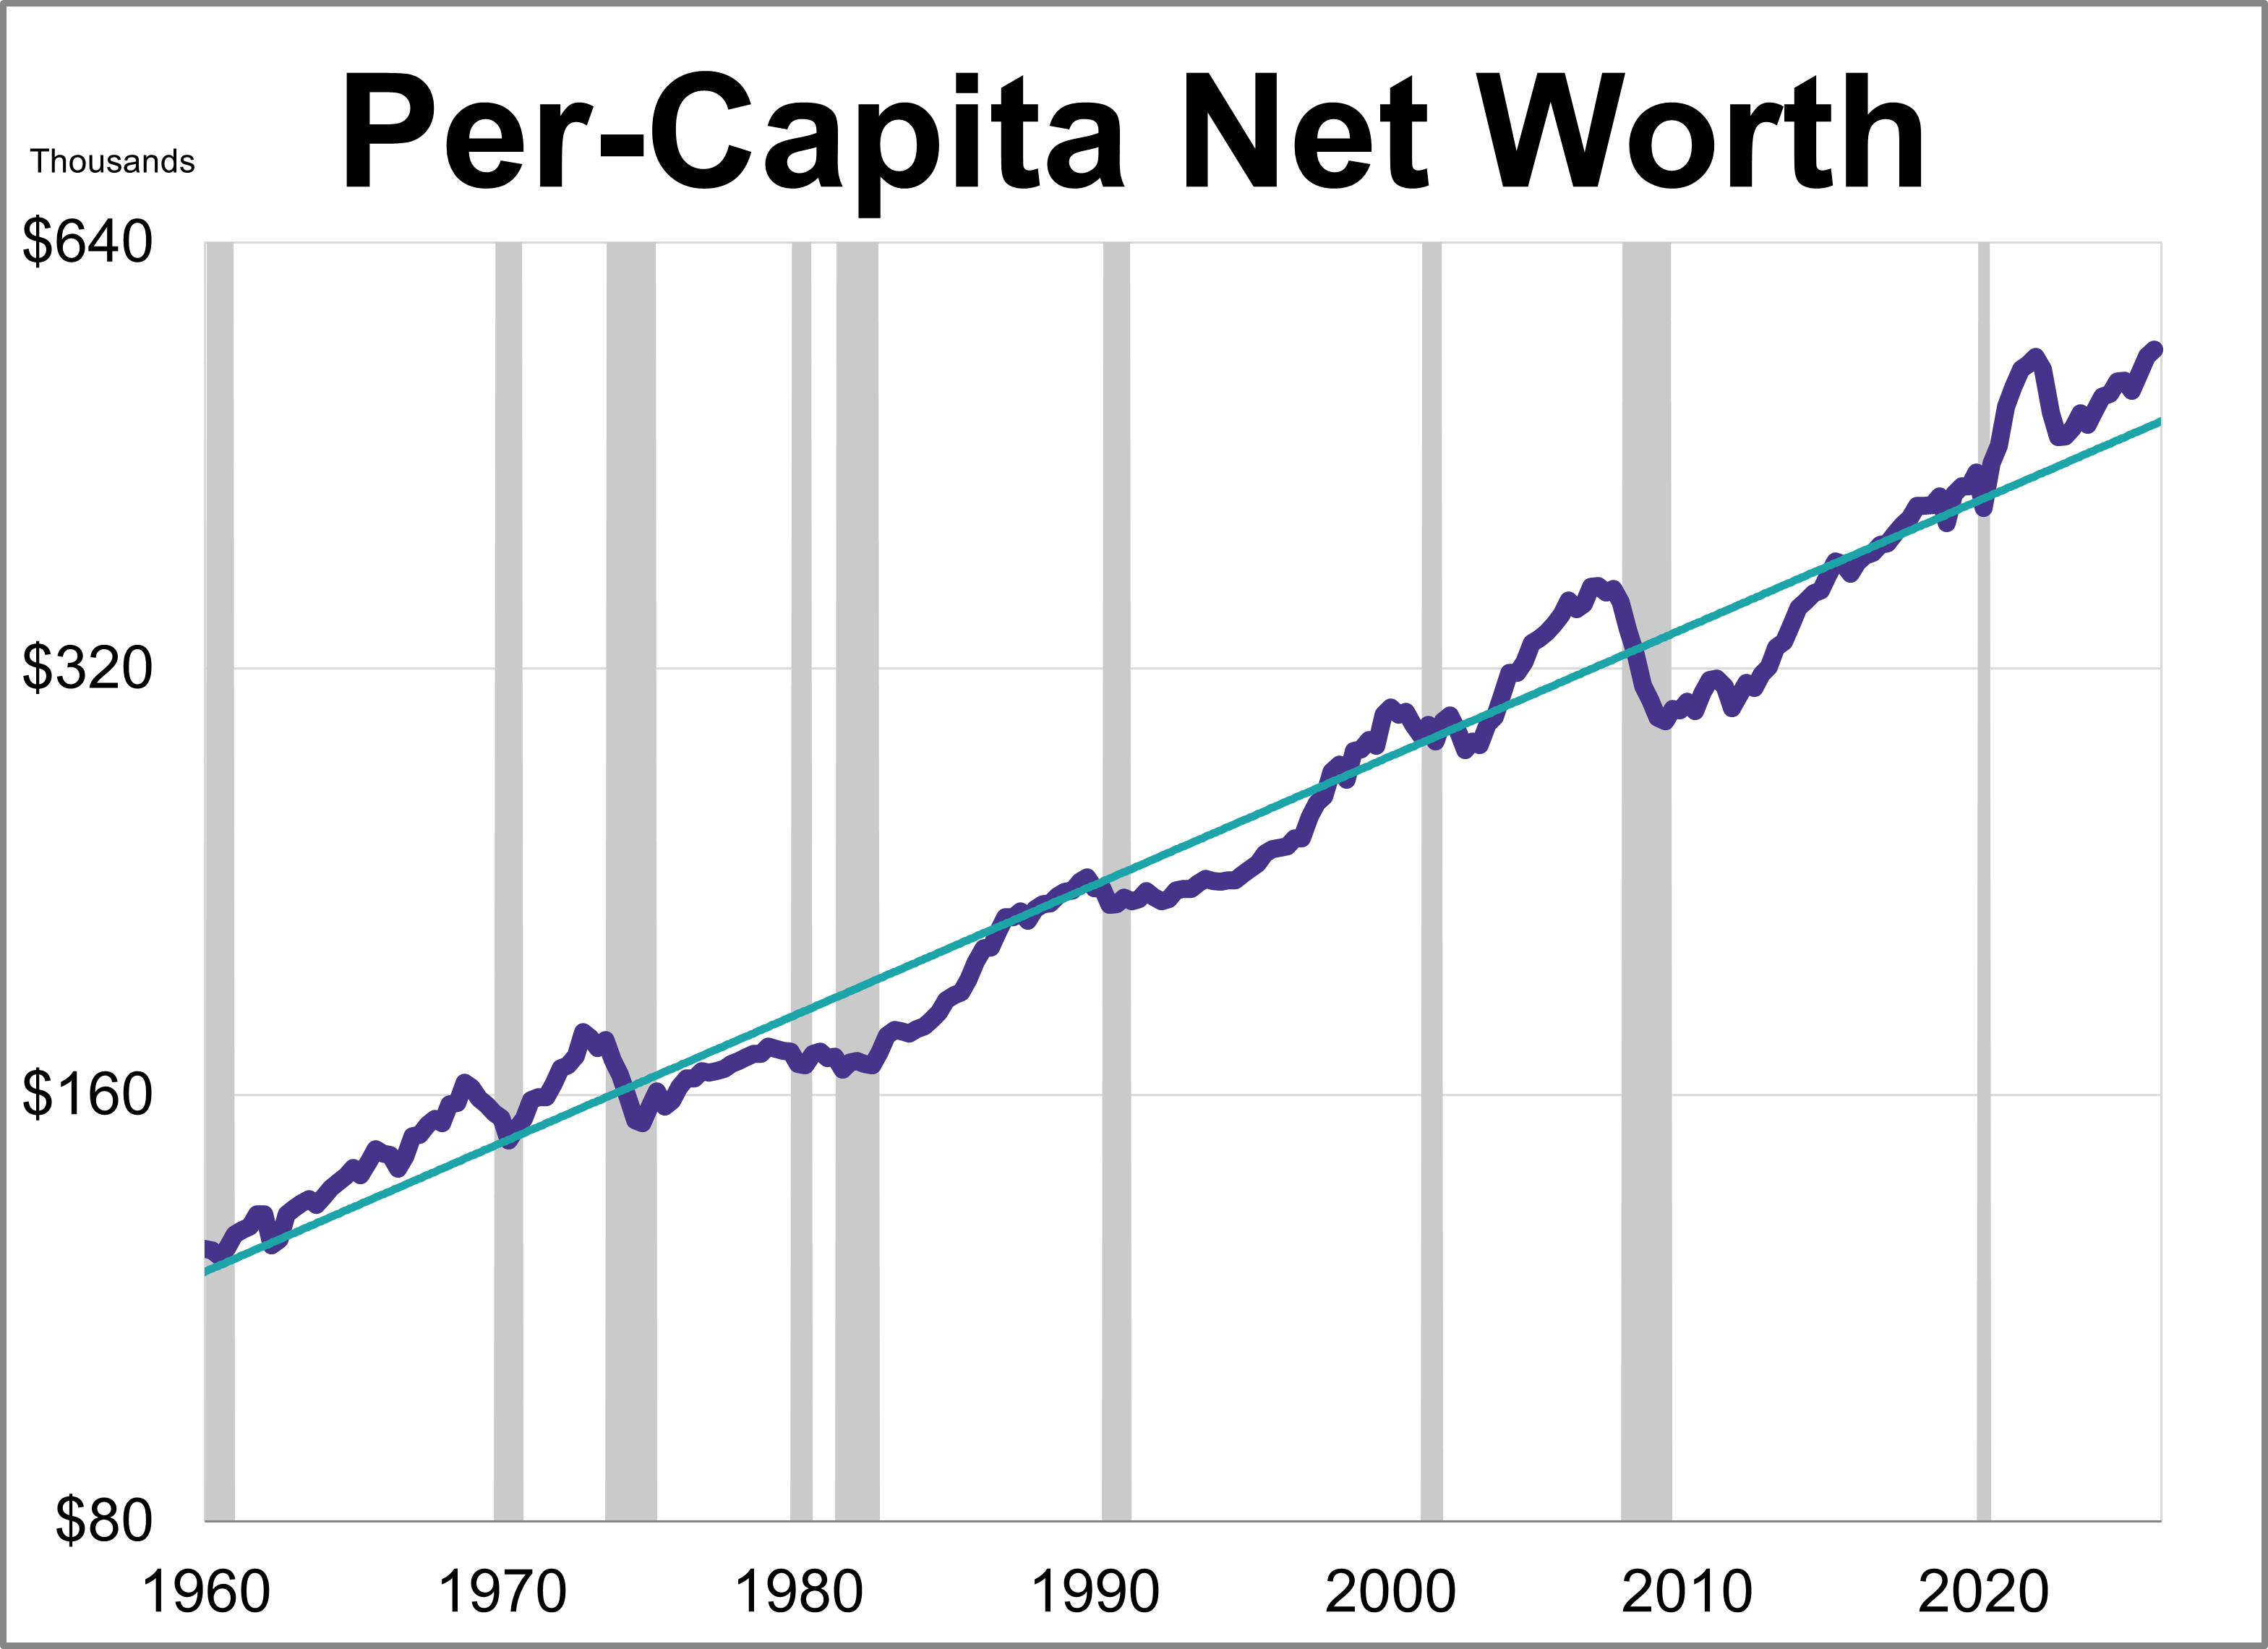
How much wealthier are Americans since the Great Recession? While a look at the headlines shows a staggering 211% increase in household net worth since 2009, adjusting for inflation tells a much different story.
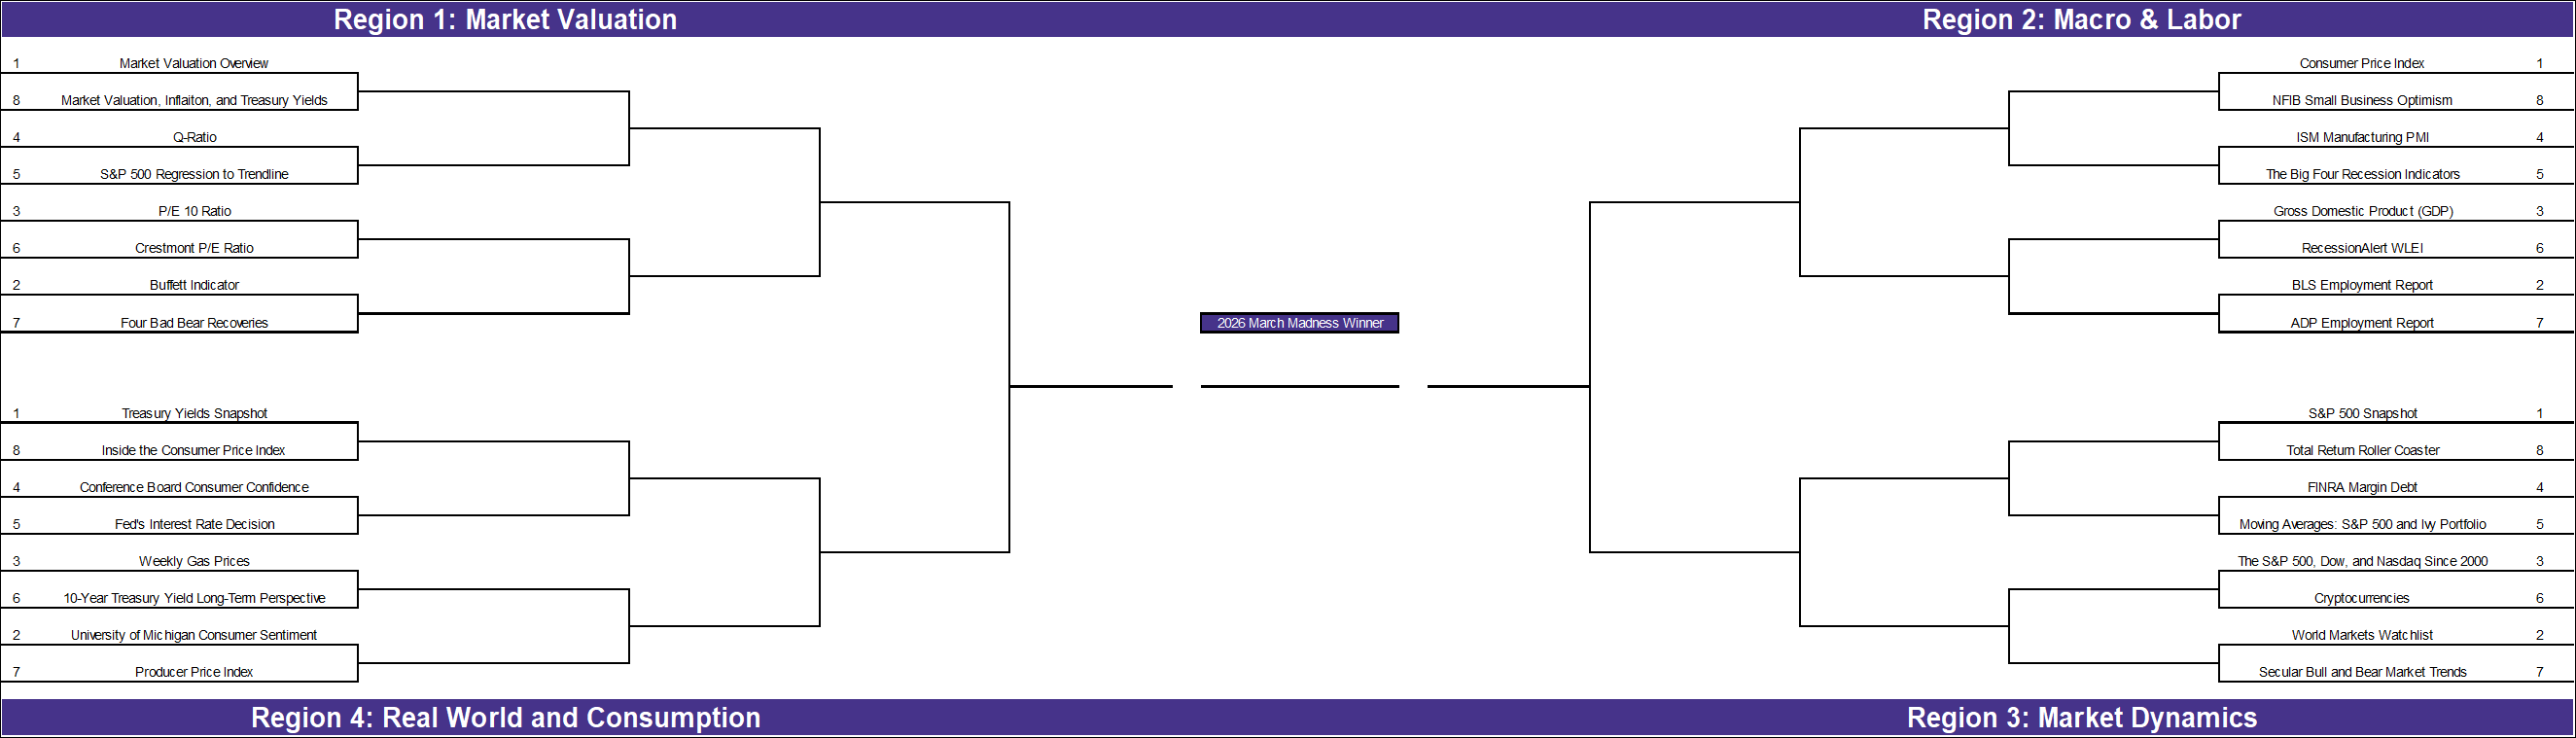
With the NCAA tournament beginning in just a few days, we’ve applied the bracket format to our own research. While economic theory often dictates what should be most important to investors, our reader engagement reveals which topics truly commanded investor attention over the past year.
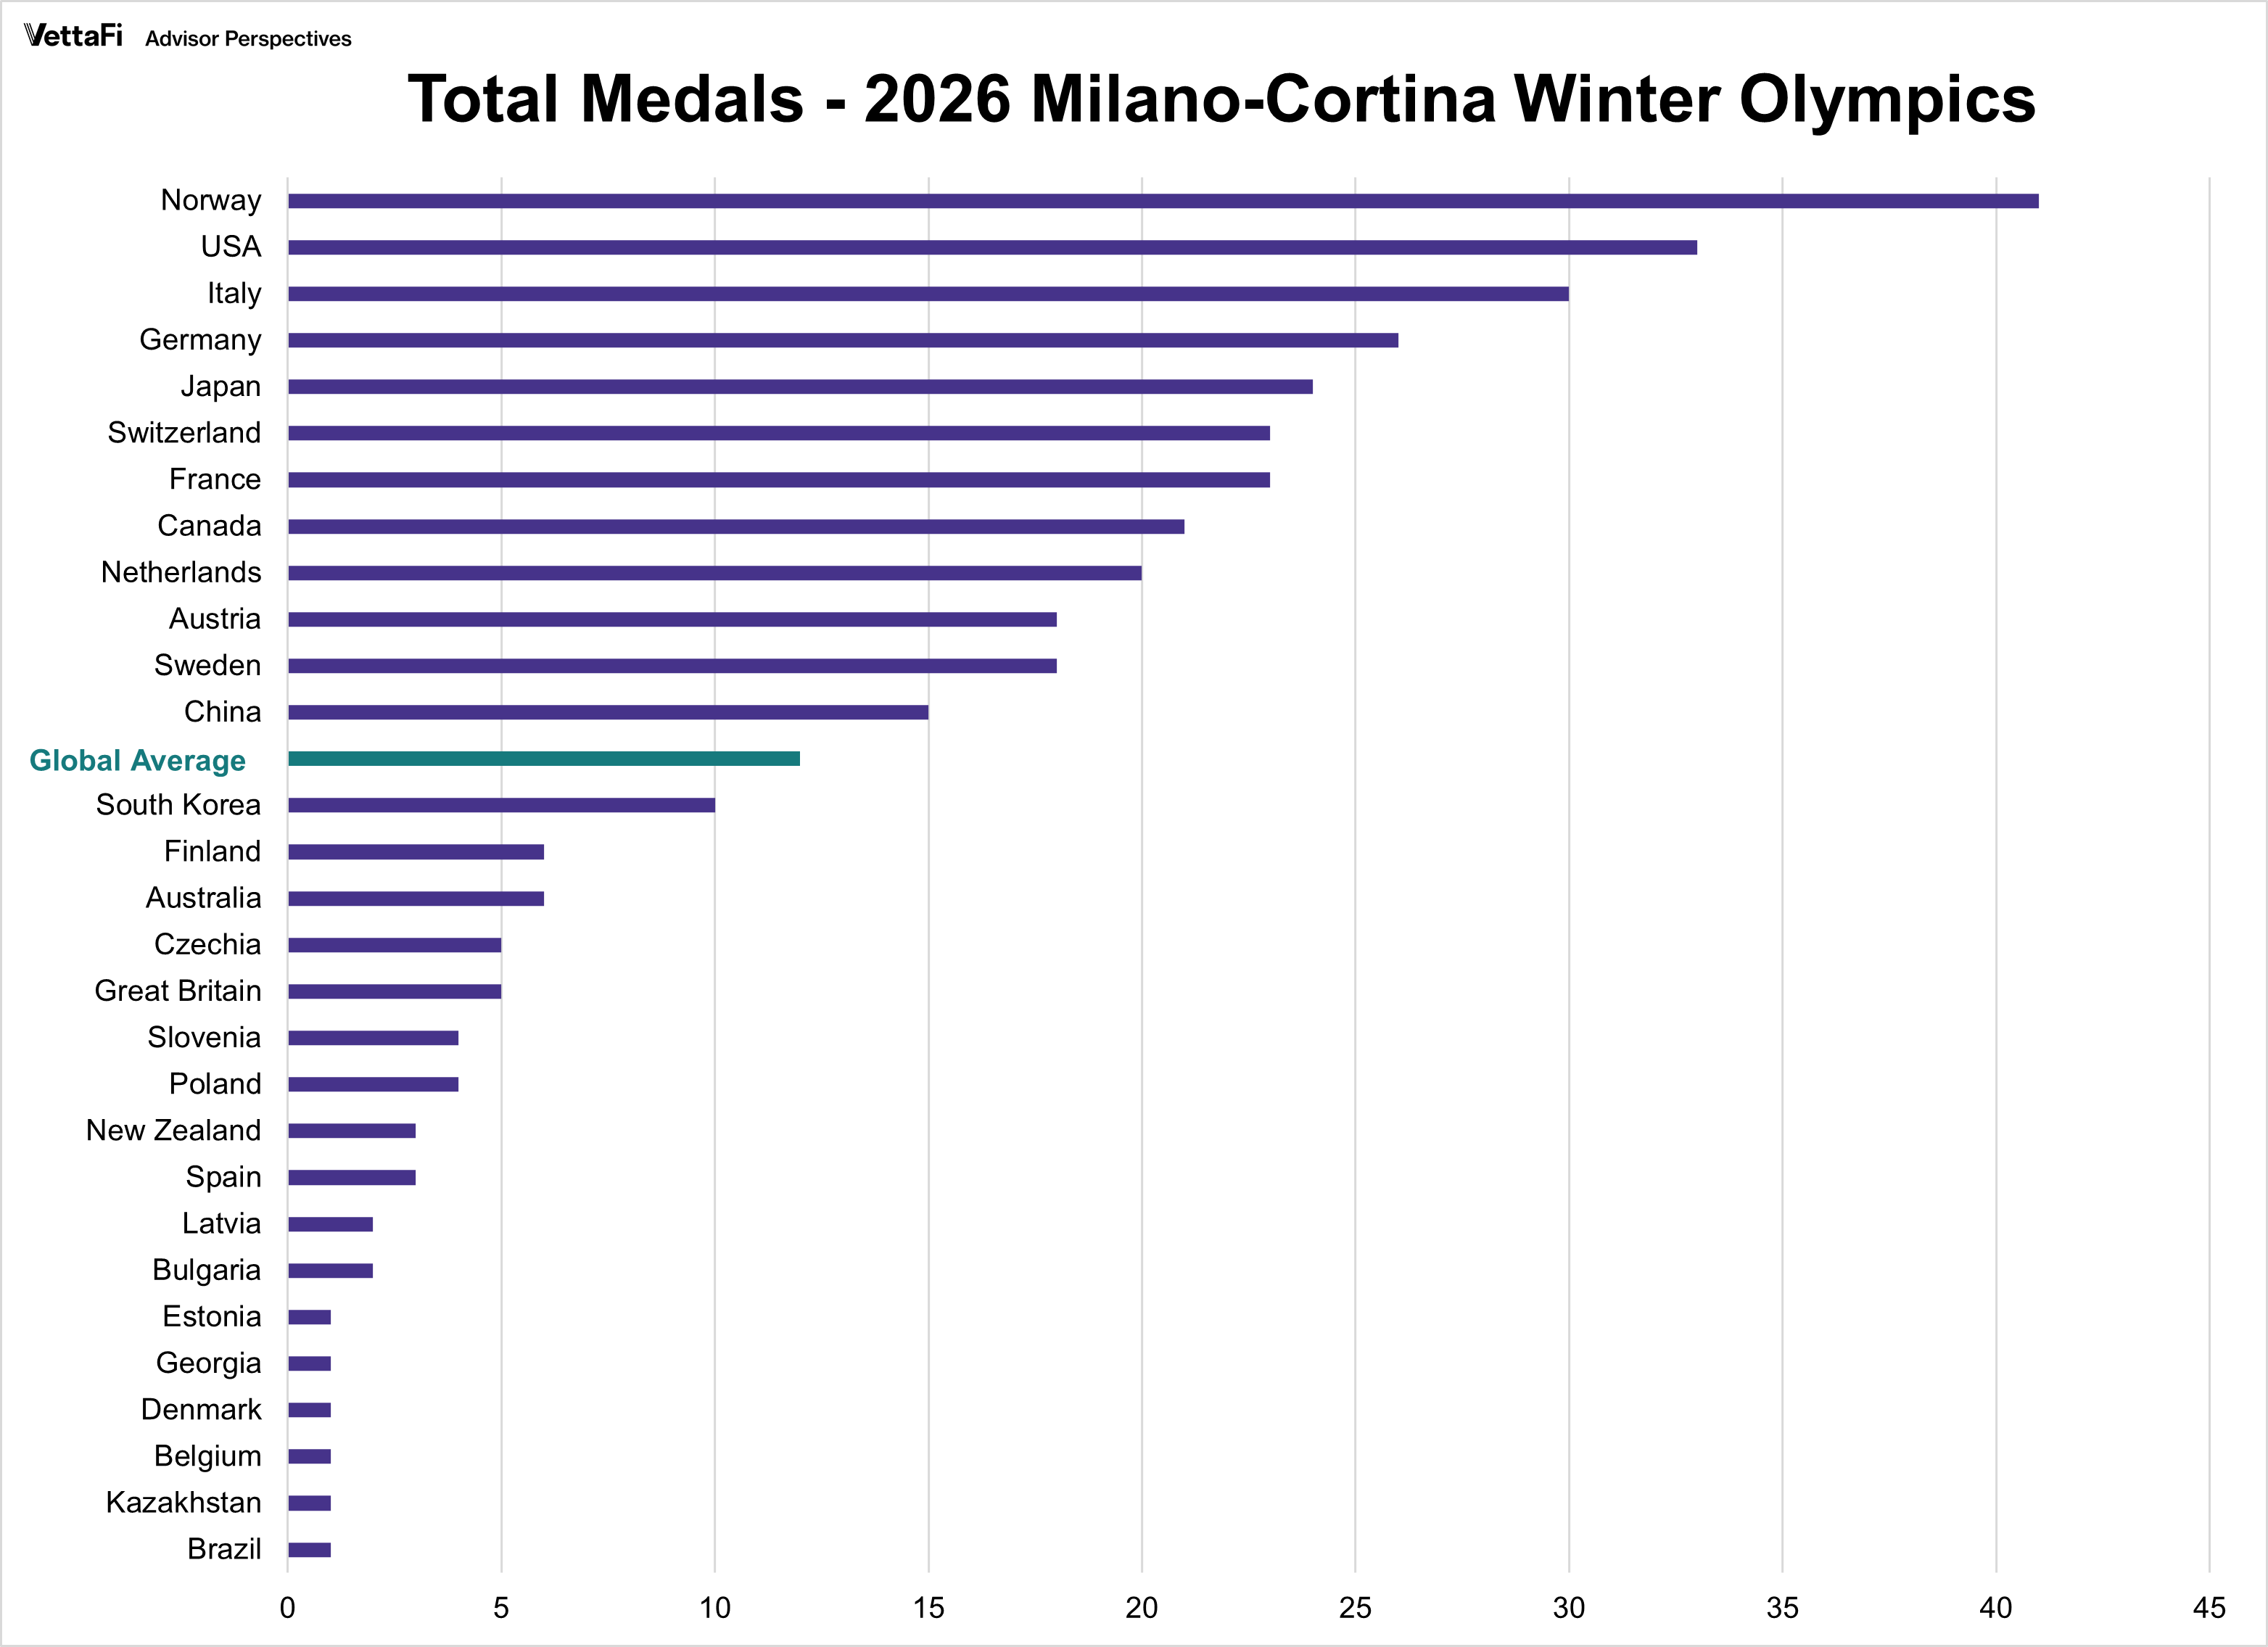
The Milano-Cortina 2026 Winter Games concluded with a familiar hierarchy at the top of the medal table. But in the world of economic indicators, we rarely look at totals without normalizing for scale. The 2026 Winter Games are no different.
The U.S. economy sent conflicting signals last week as a sharp deceleration in growth collided with unexpectedly stubborn inflation.
The U.S. economy began 2026 with a display of unexpected resilience in the labor market and cooling inflation.