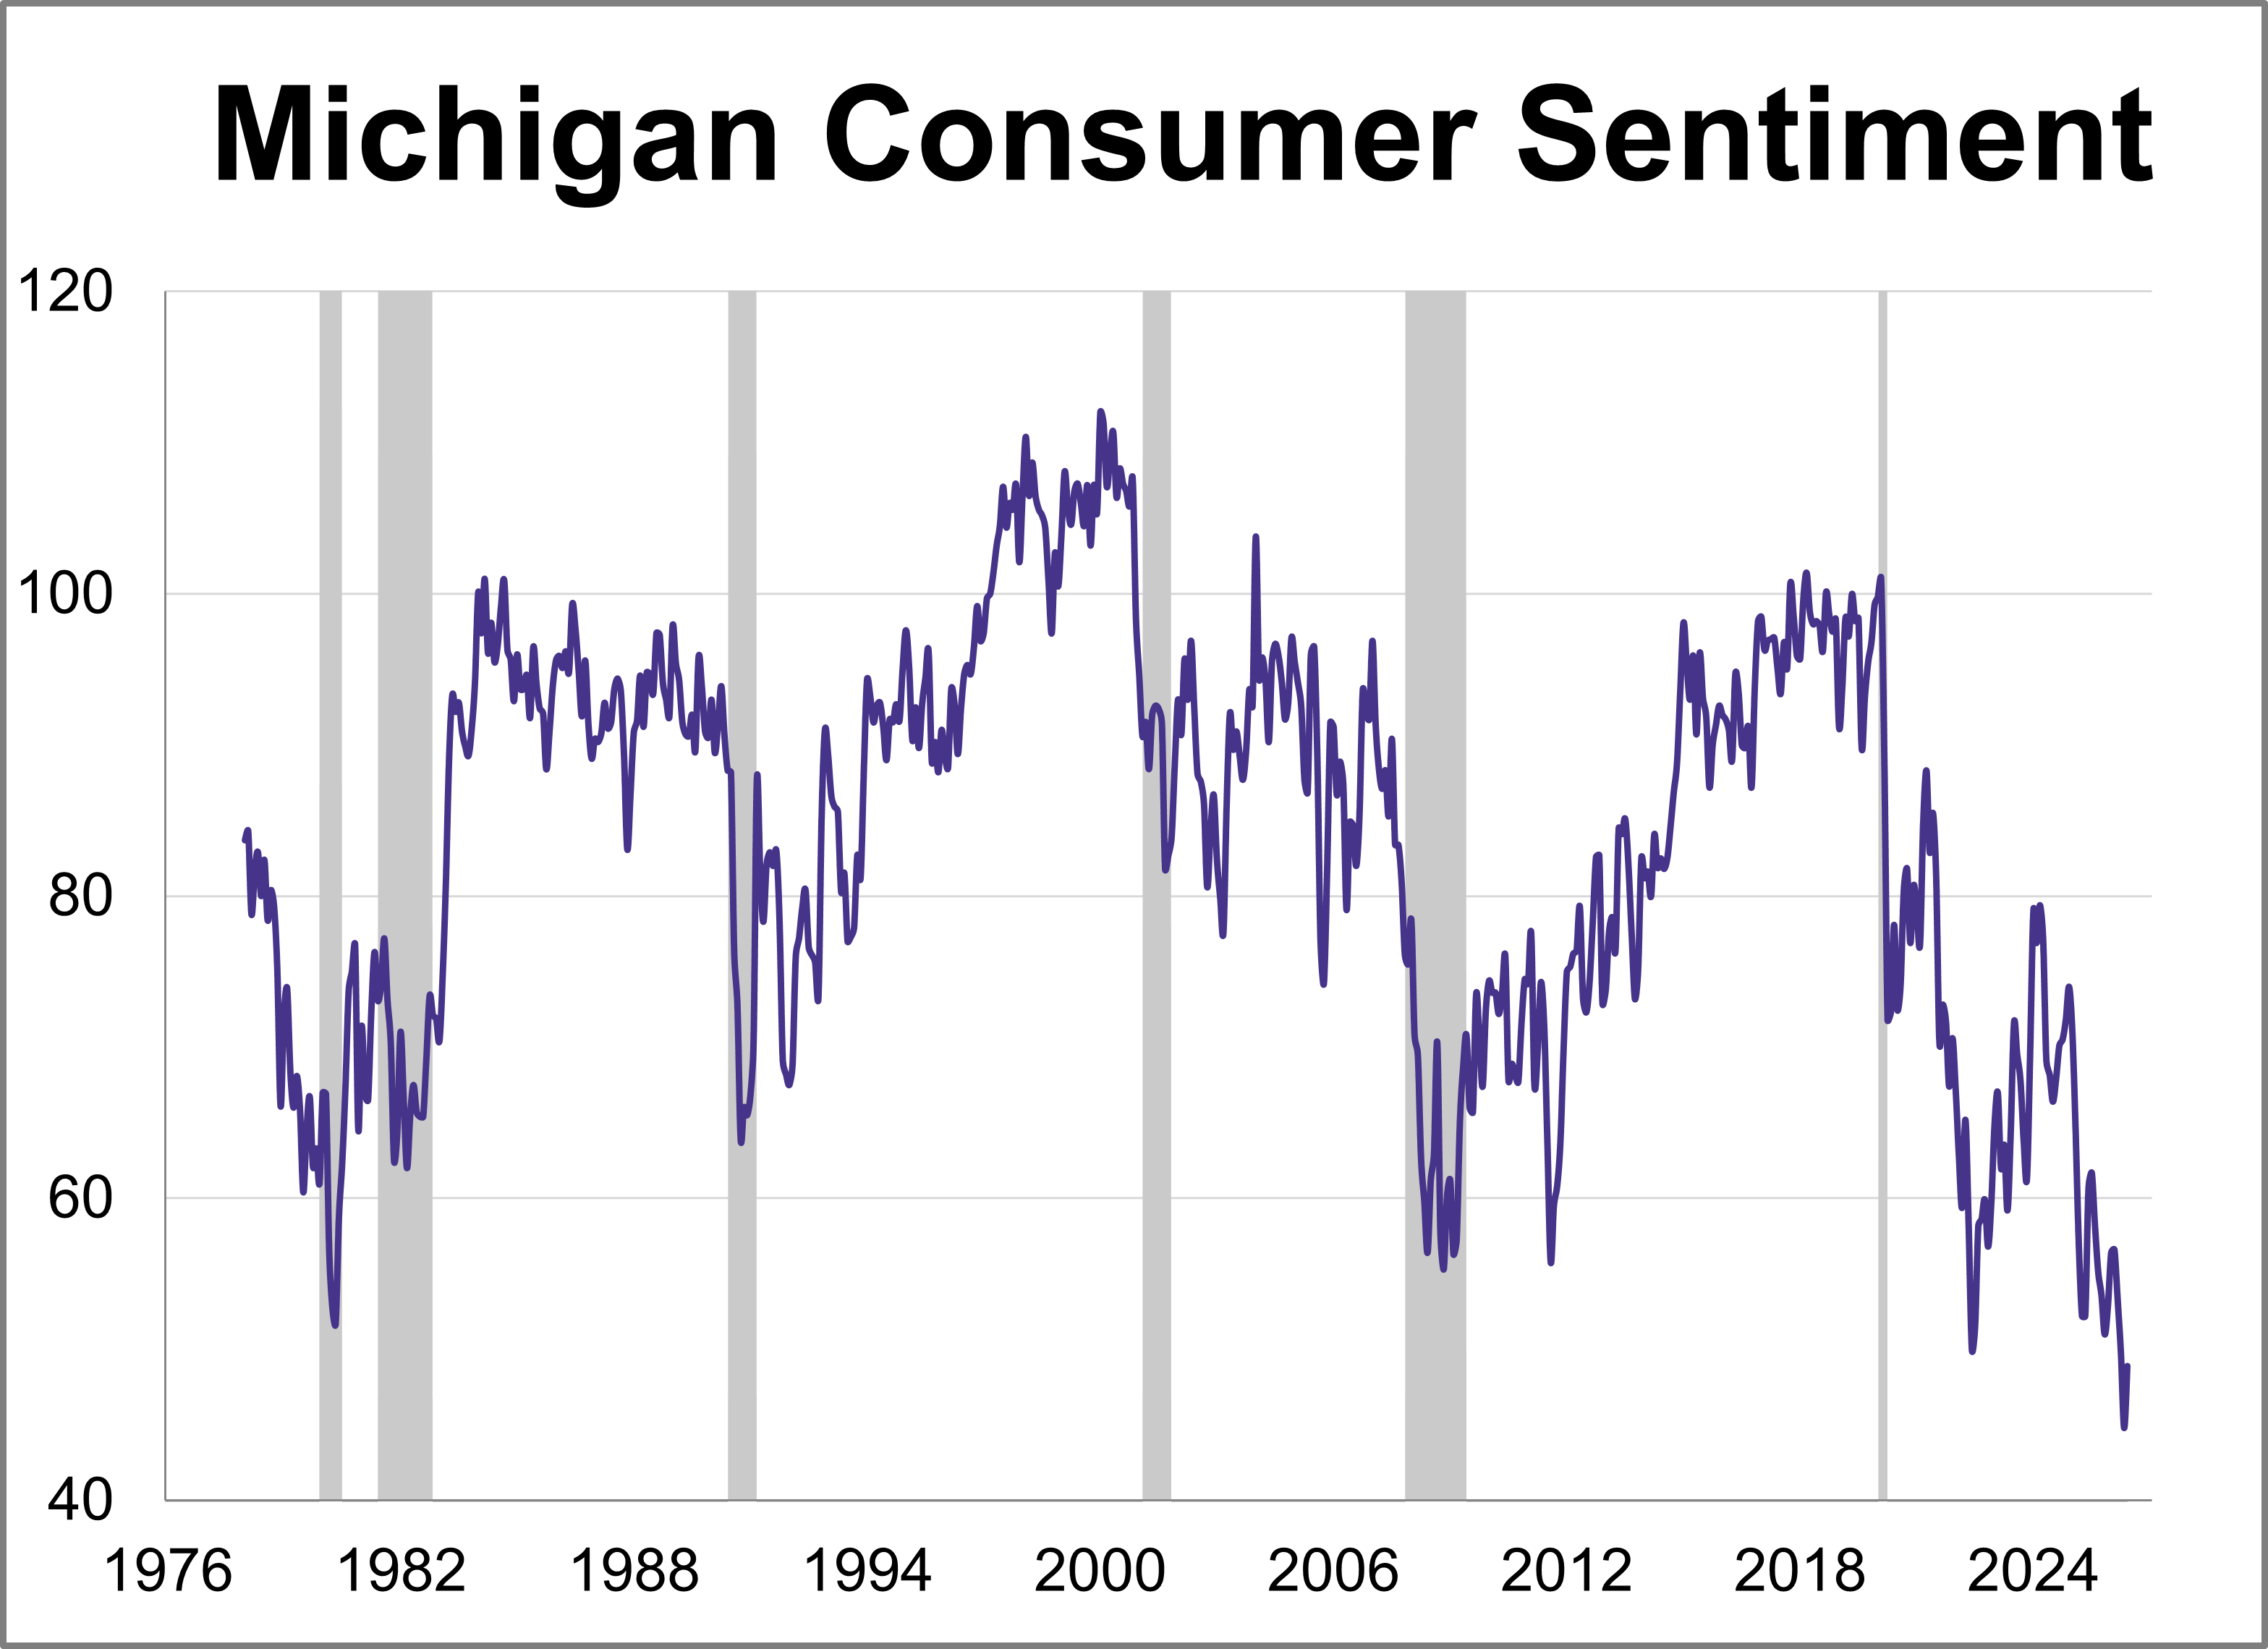
Consumer sentiment improved for the first time in four months but remains historically low amid ongoing inflation concerns. The preliminary June reading for the University of Michigan Consumer Sentiment Index came in at 48.9 marking a 9% (4.1 points) increase from April and beating the expected reading of 46.1.
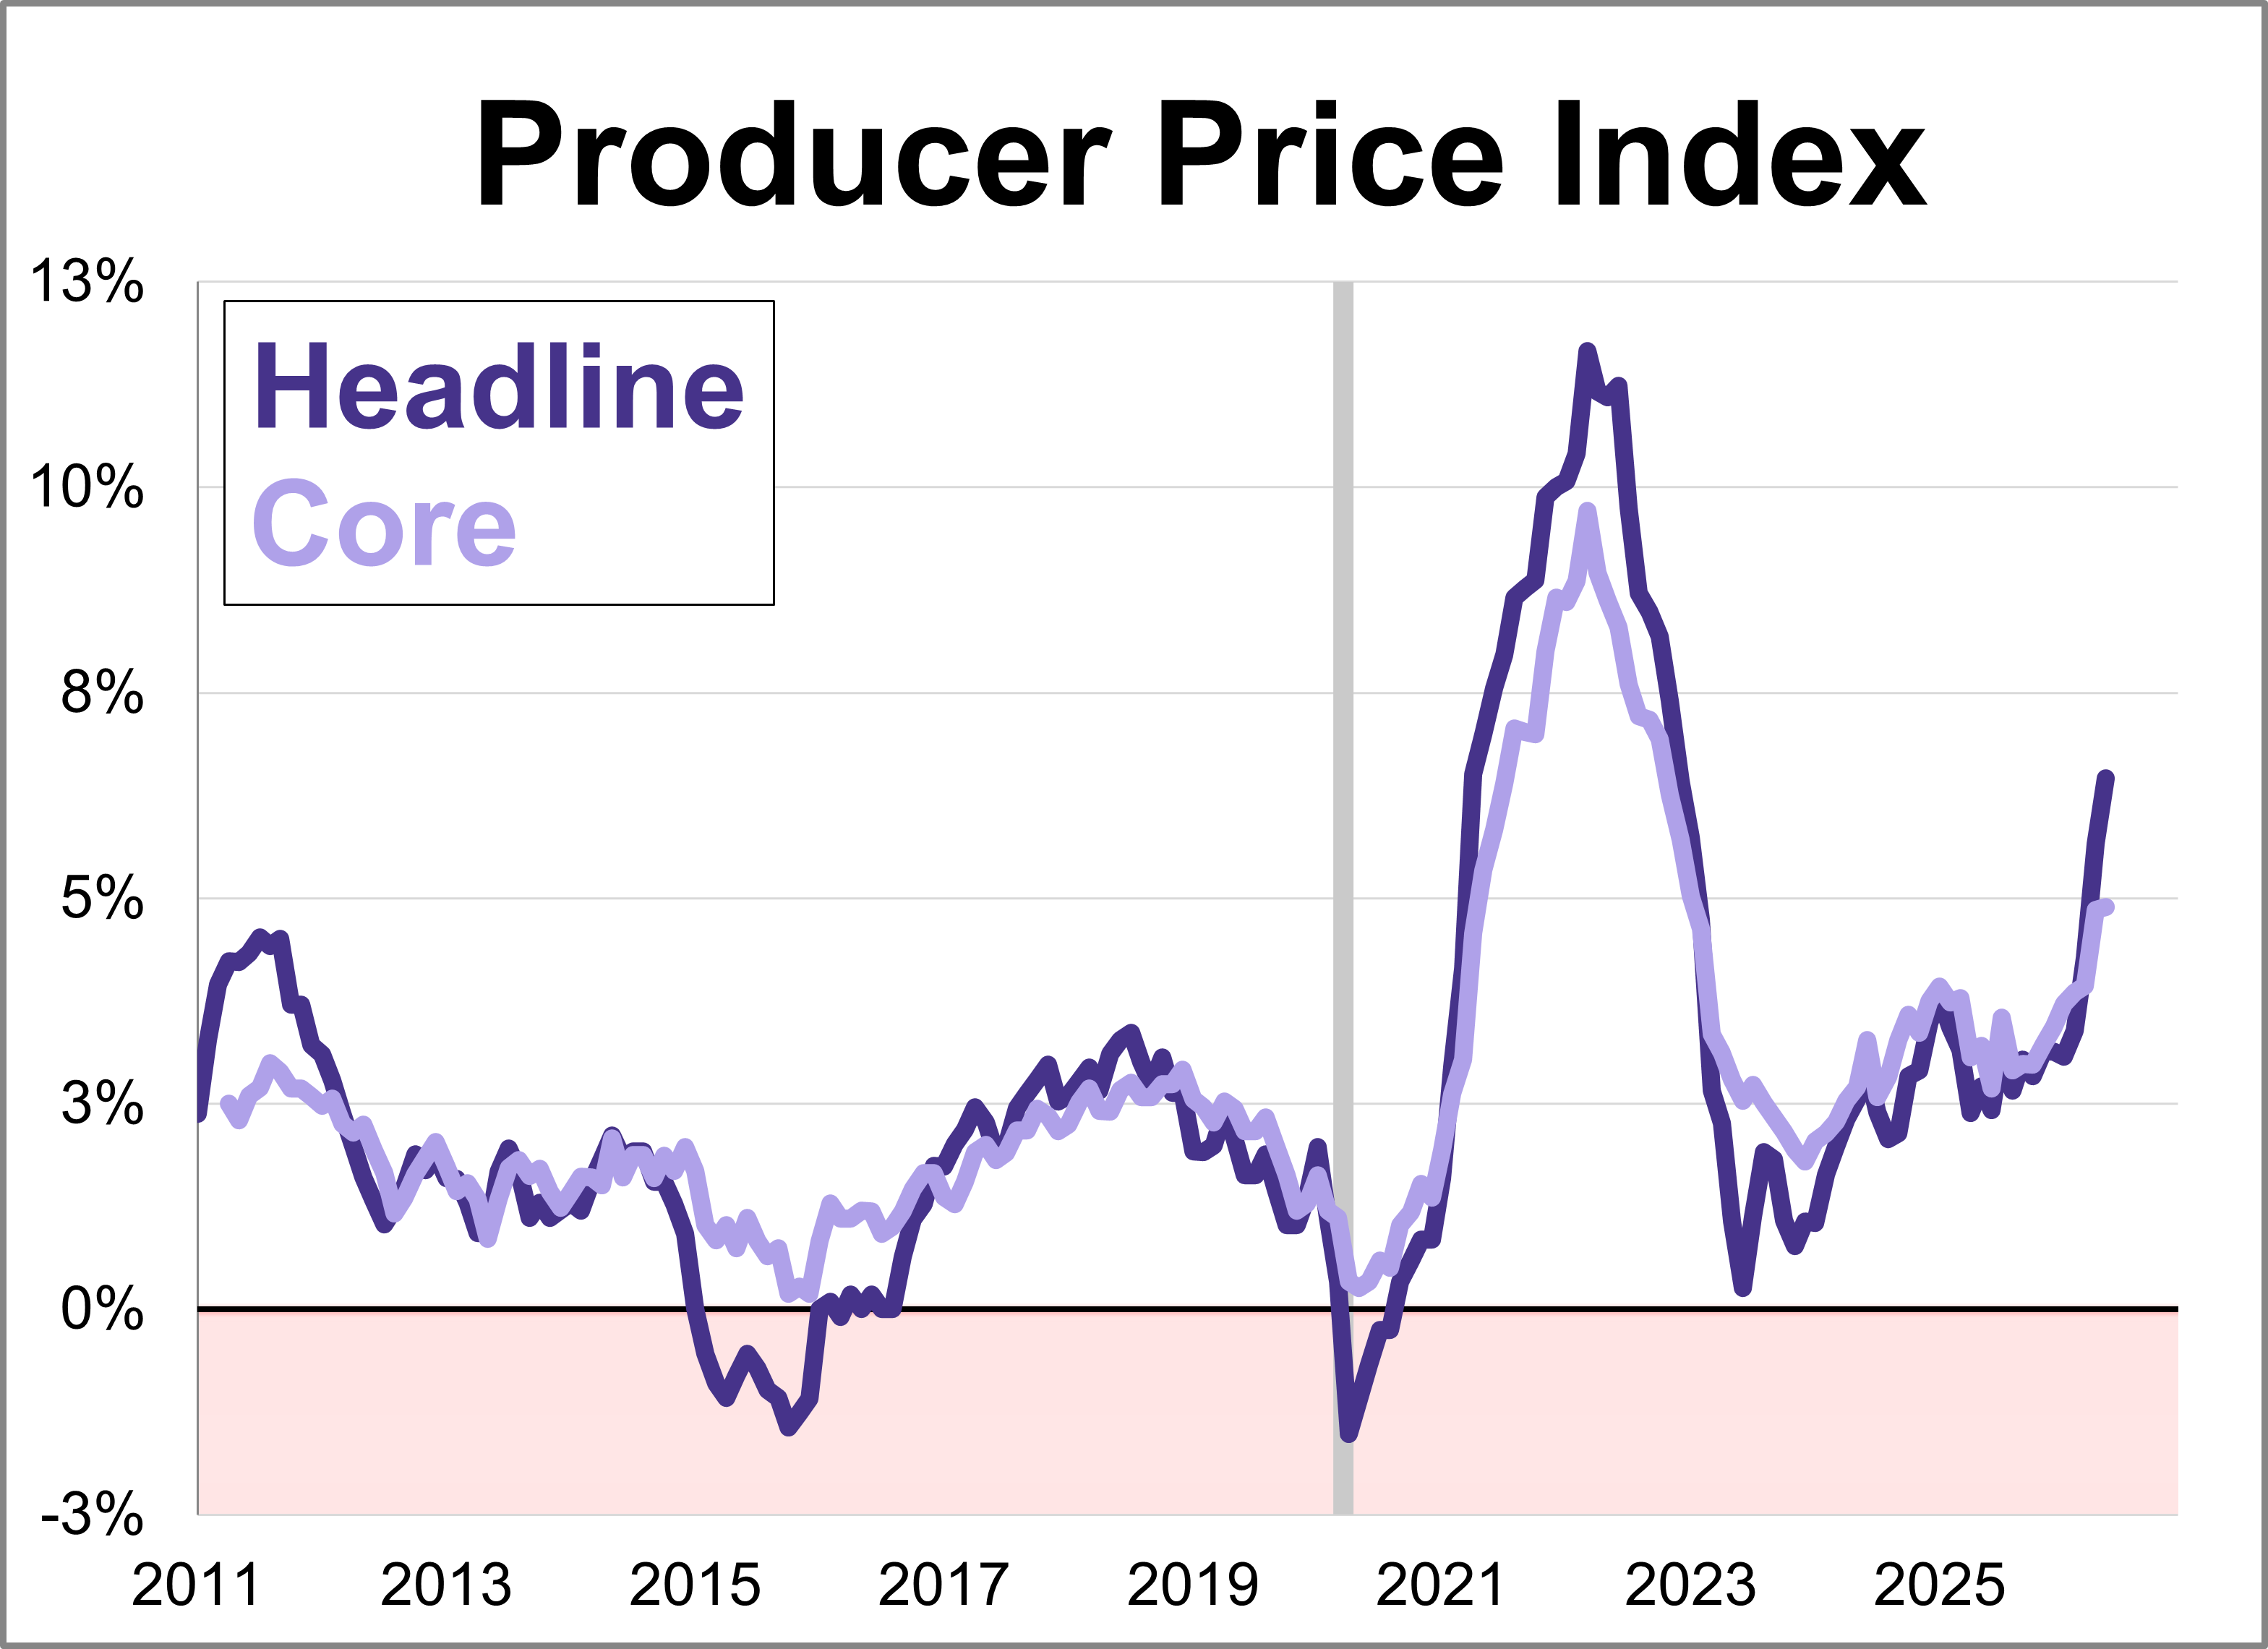
May's Producer Price Index (PPI) data delivered another blow to inflation watchers, as wholesale price growth came in hotter than expected.
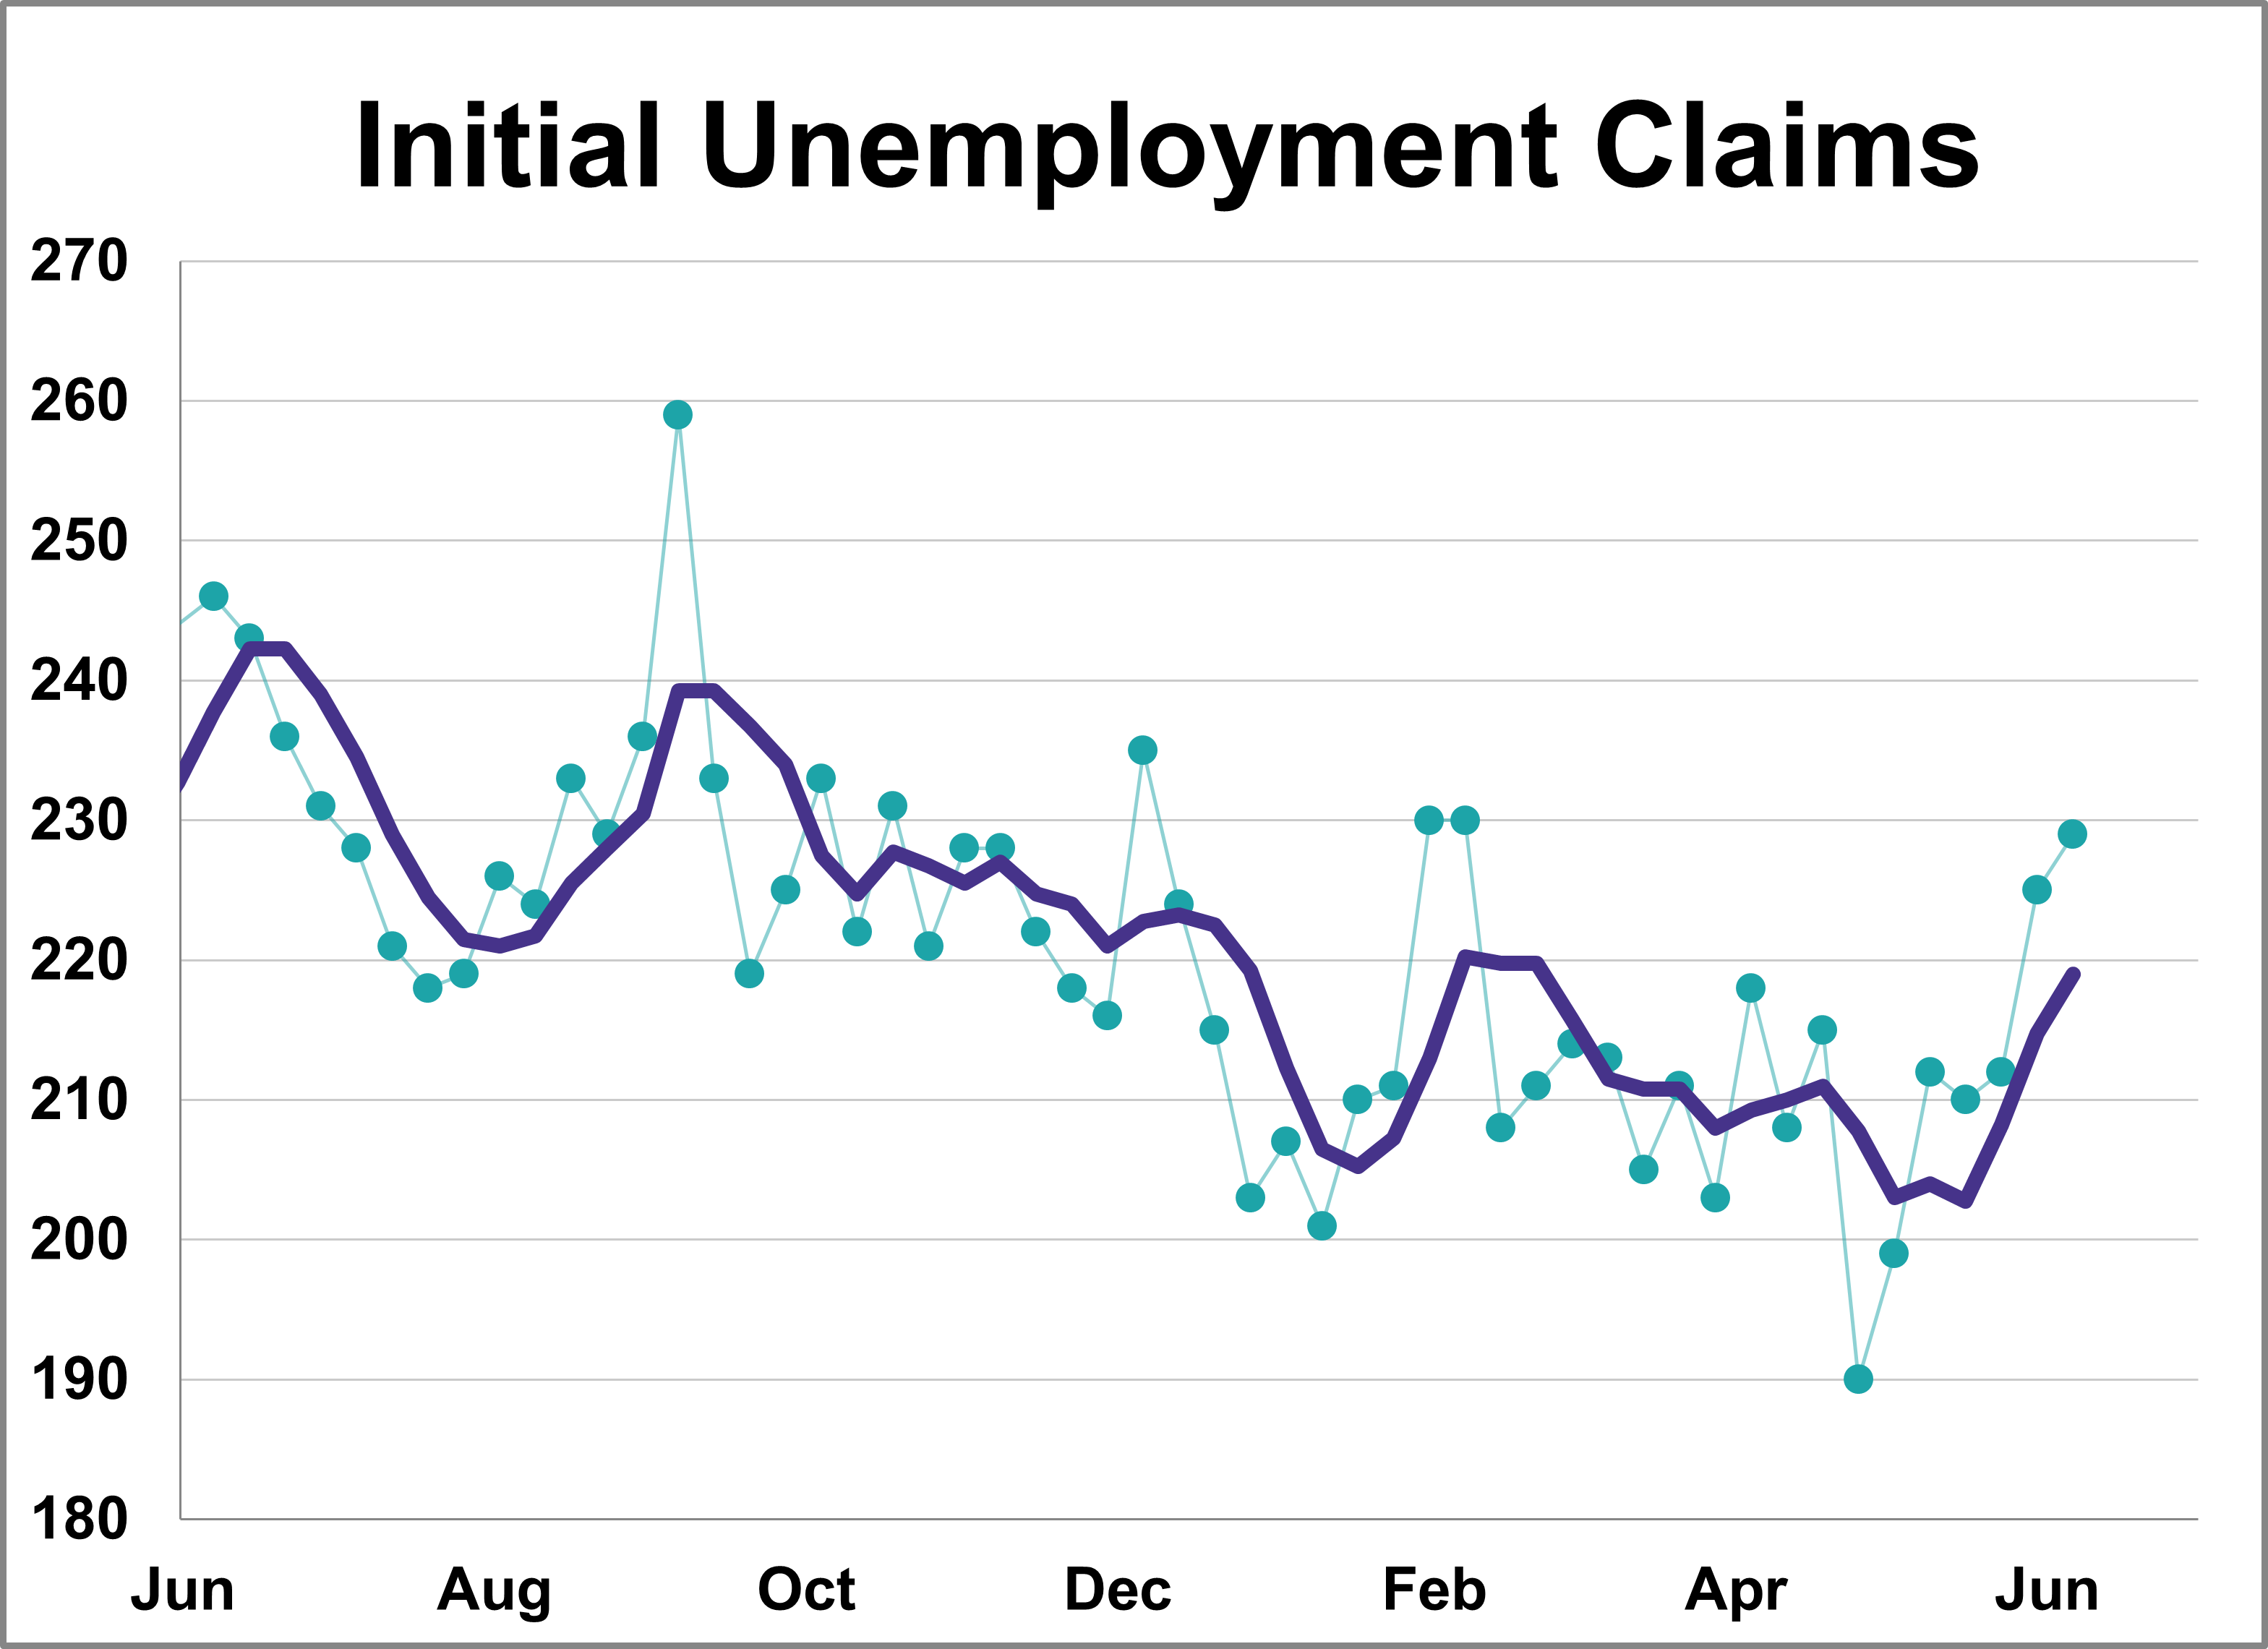
In the week ending June 6th, initial jobless claims were at a seasonally adjusted level of 229,000, the highest level in four months. This represents an increase of 4,000 from the previous week's figure and was higher than the forecast of 220,000.
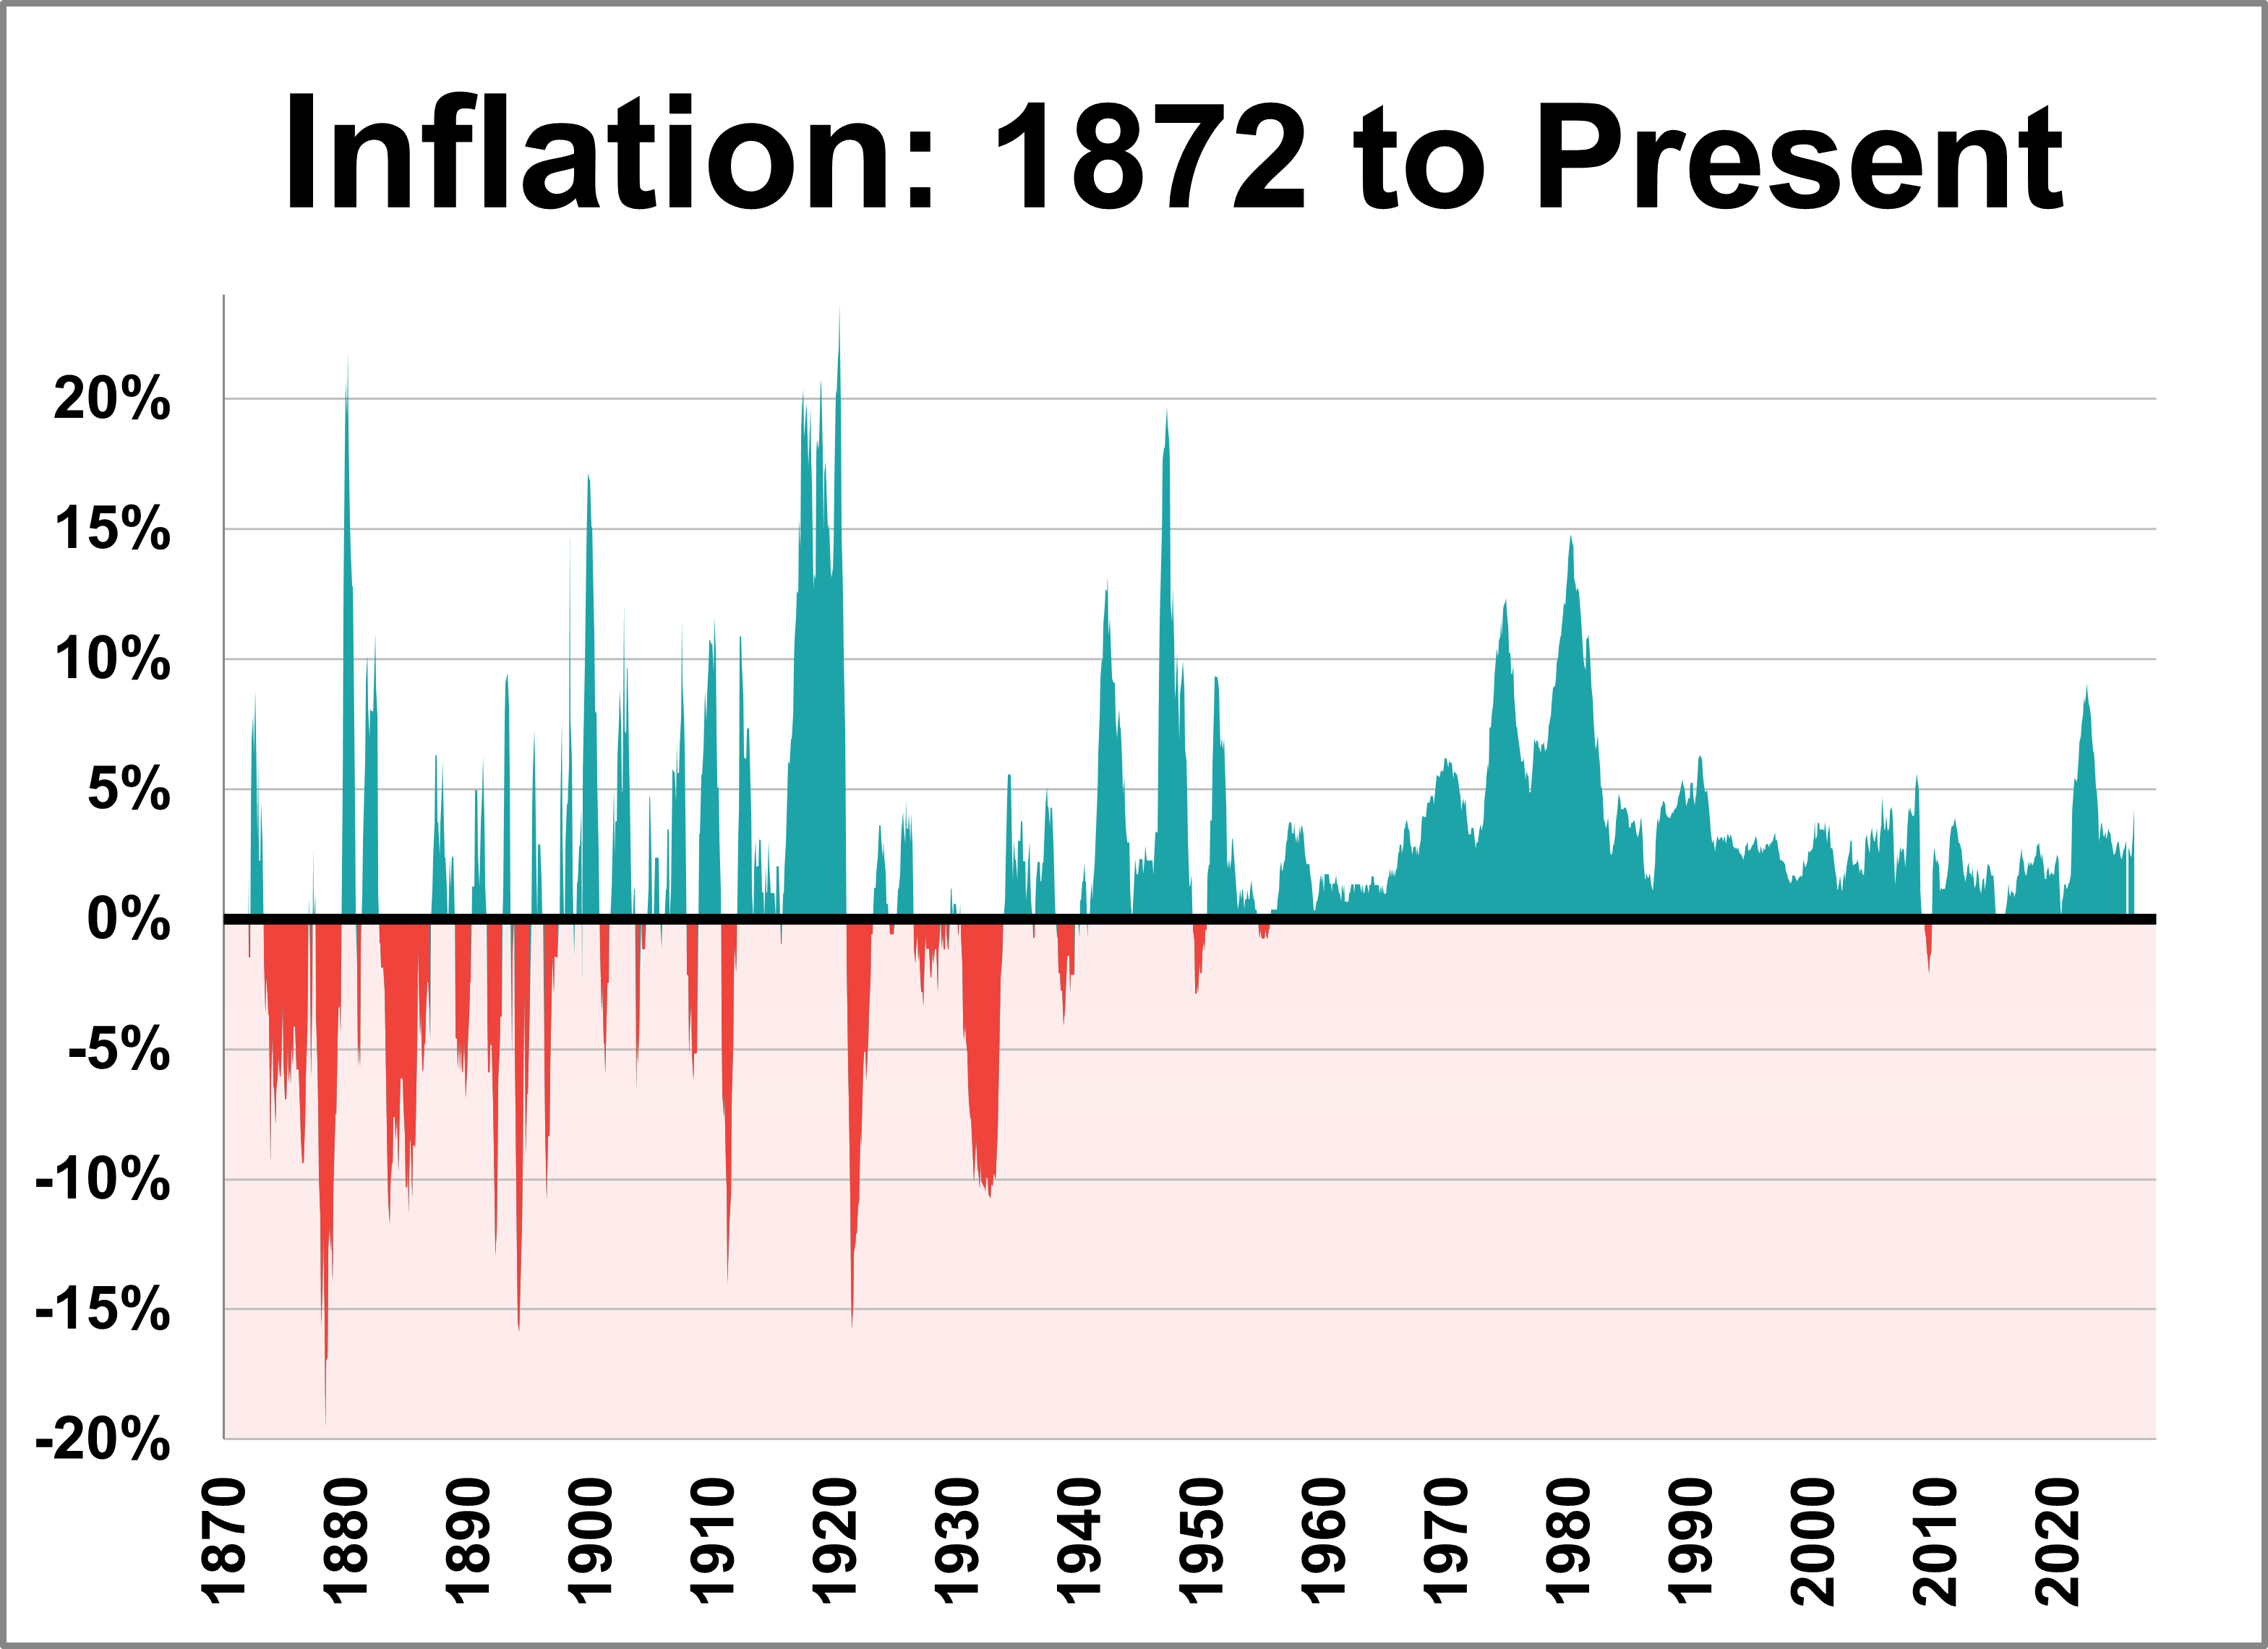
The May release of the Consumer Price Index for Urban Consumers (CPI-U) places the year-over-year inflation rate at 4.25%, its highest level in over three years. This keeps inflation above the post-WWII average of 3.72% for a second straight month and marks the third consecutive month that the current rate is above the 10-year moving average, which currently sits at 3.27%.
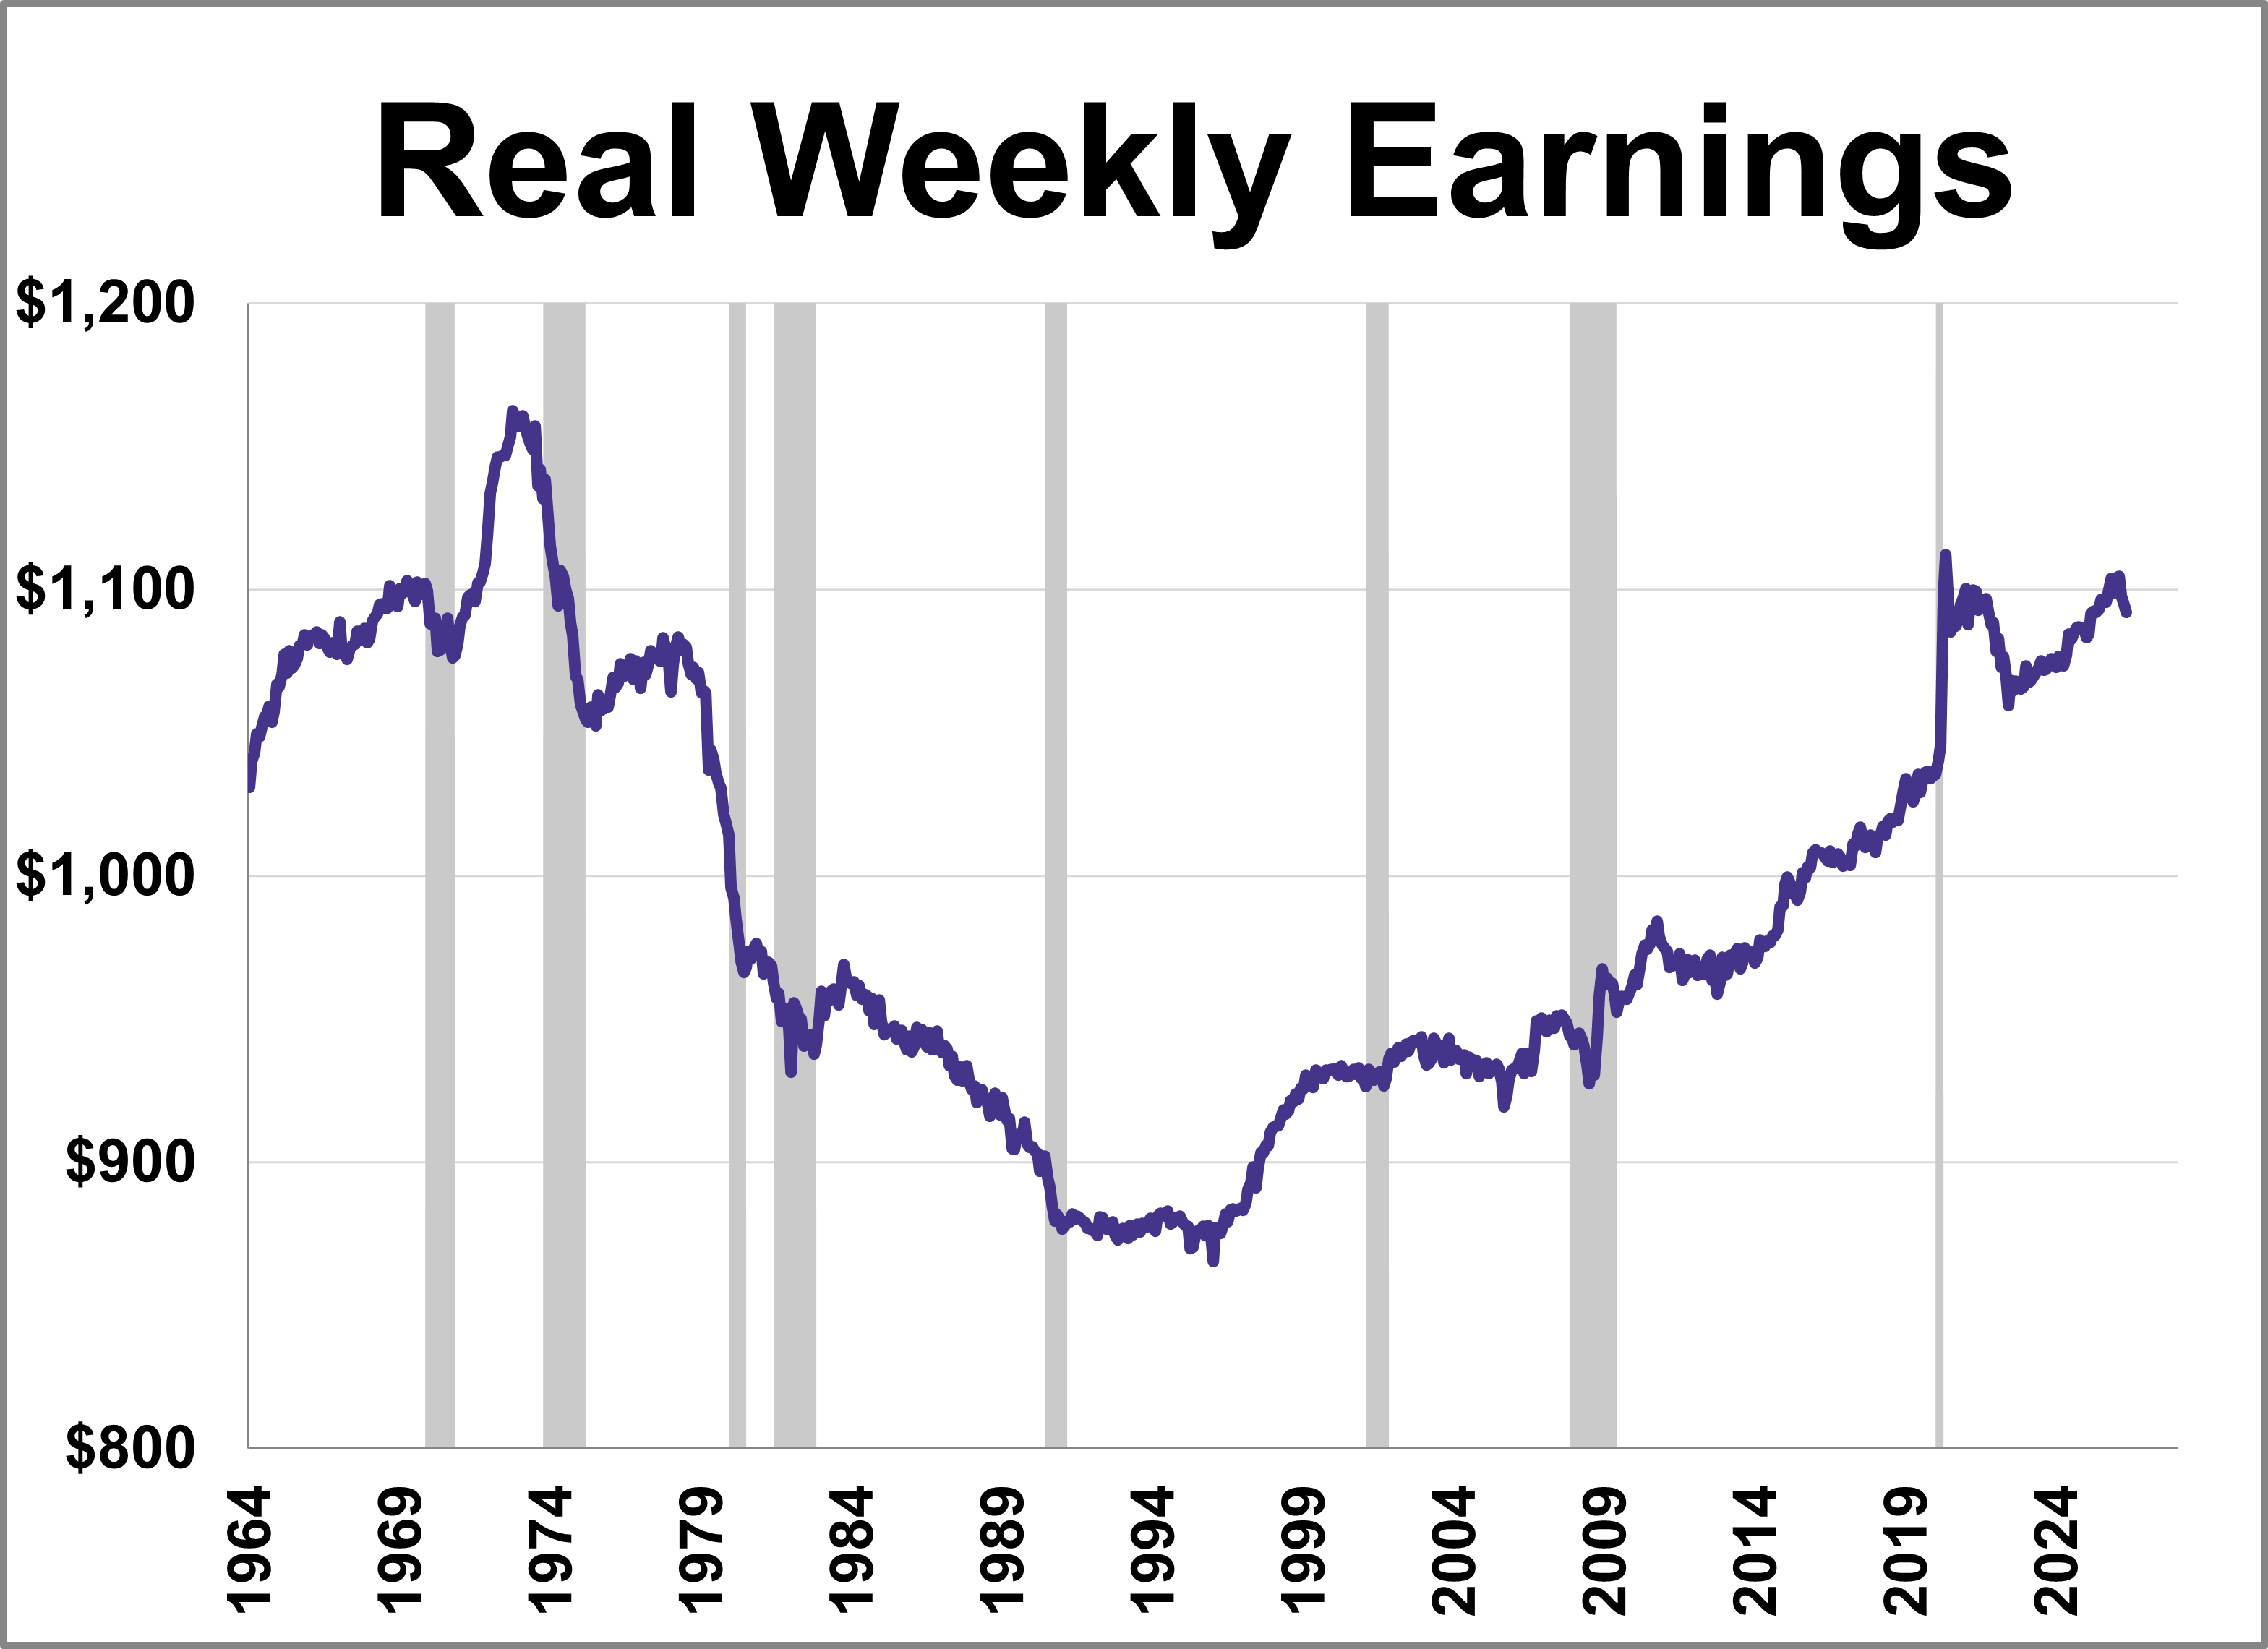
This series has been updated to include the May release of the consumer price index as the deflator and the monthly employment update. The latest hypothetical real (inflation-adjusted) annual earnings are at $54,604, down 6.1% from over 50 years ago.
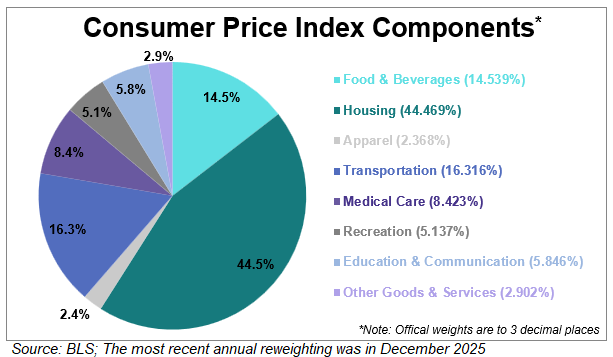
Inflation affects everything from grocery bills to rent, making the Consumer Price Index (CPI) one of the most closely watched economic indicators. The Bureau of Labor Statistics (BLS) tracks this by categorizing spending into eight categories, each weighted by its relative importance.
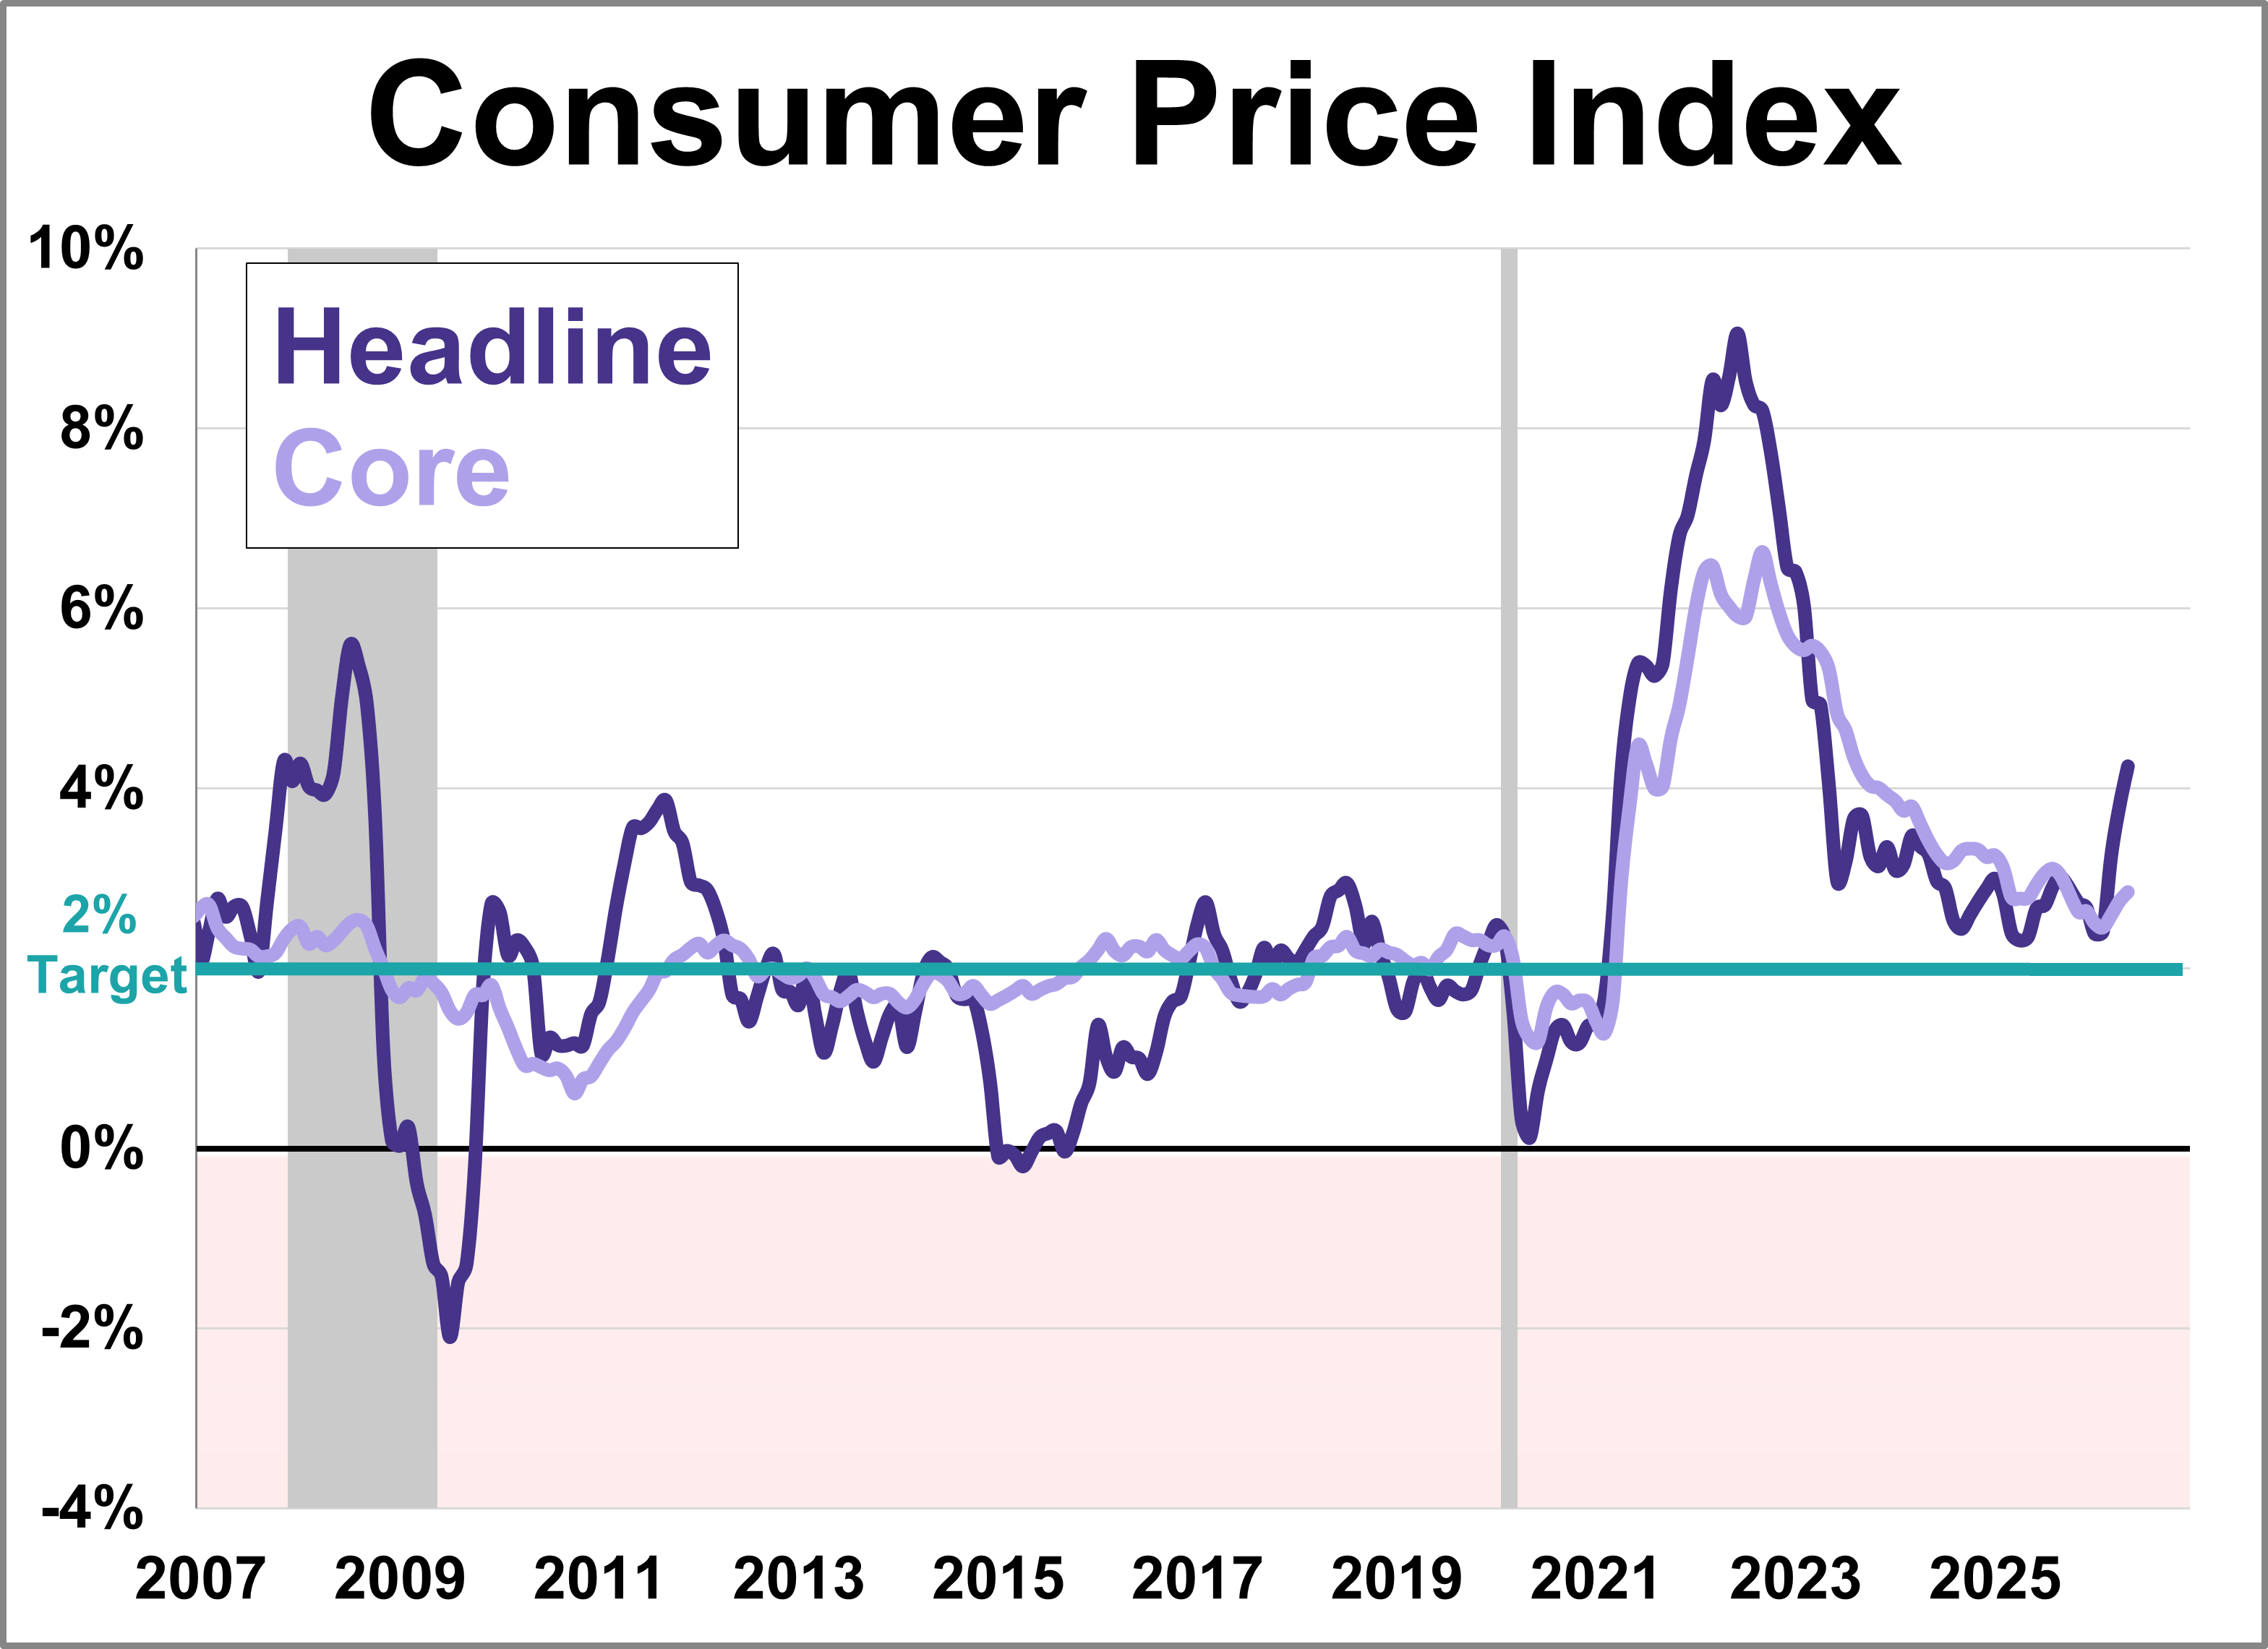
Inflation surged to 4.2% year-over-year in May, hitting its highest level in over three years. The headline figure for the Consumer Price Index (CPI) was consistent with the forecast, driven primarily by cost increases in energy, shelter, and food.
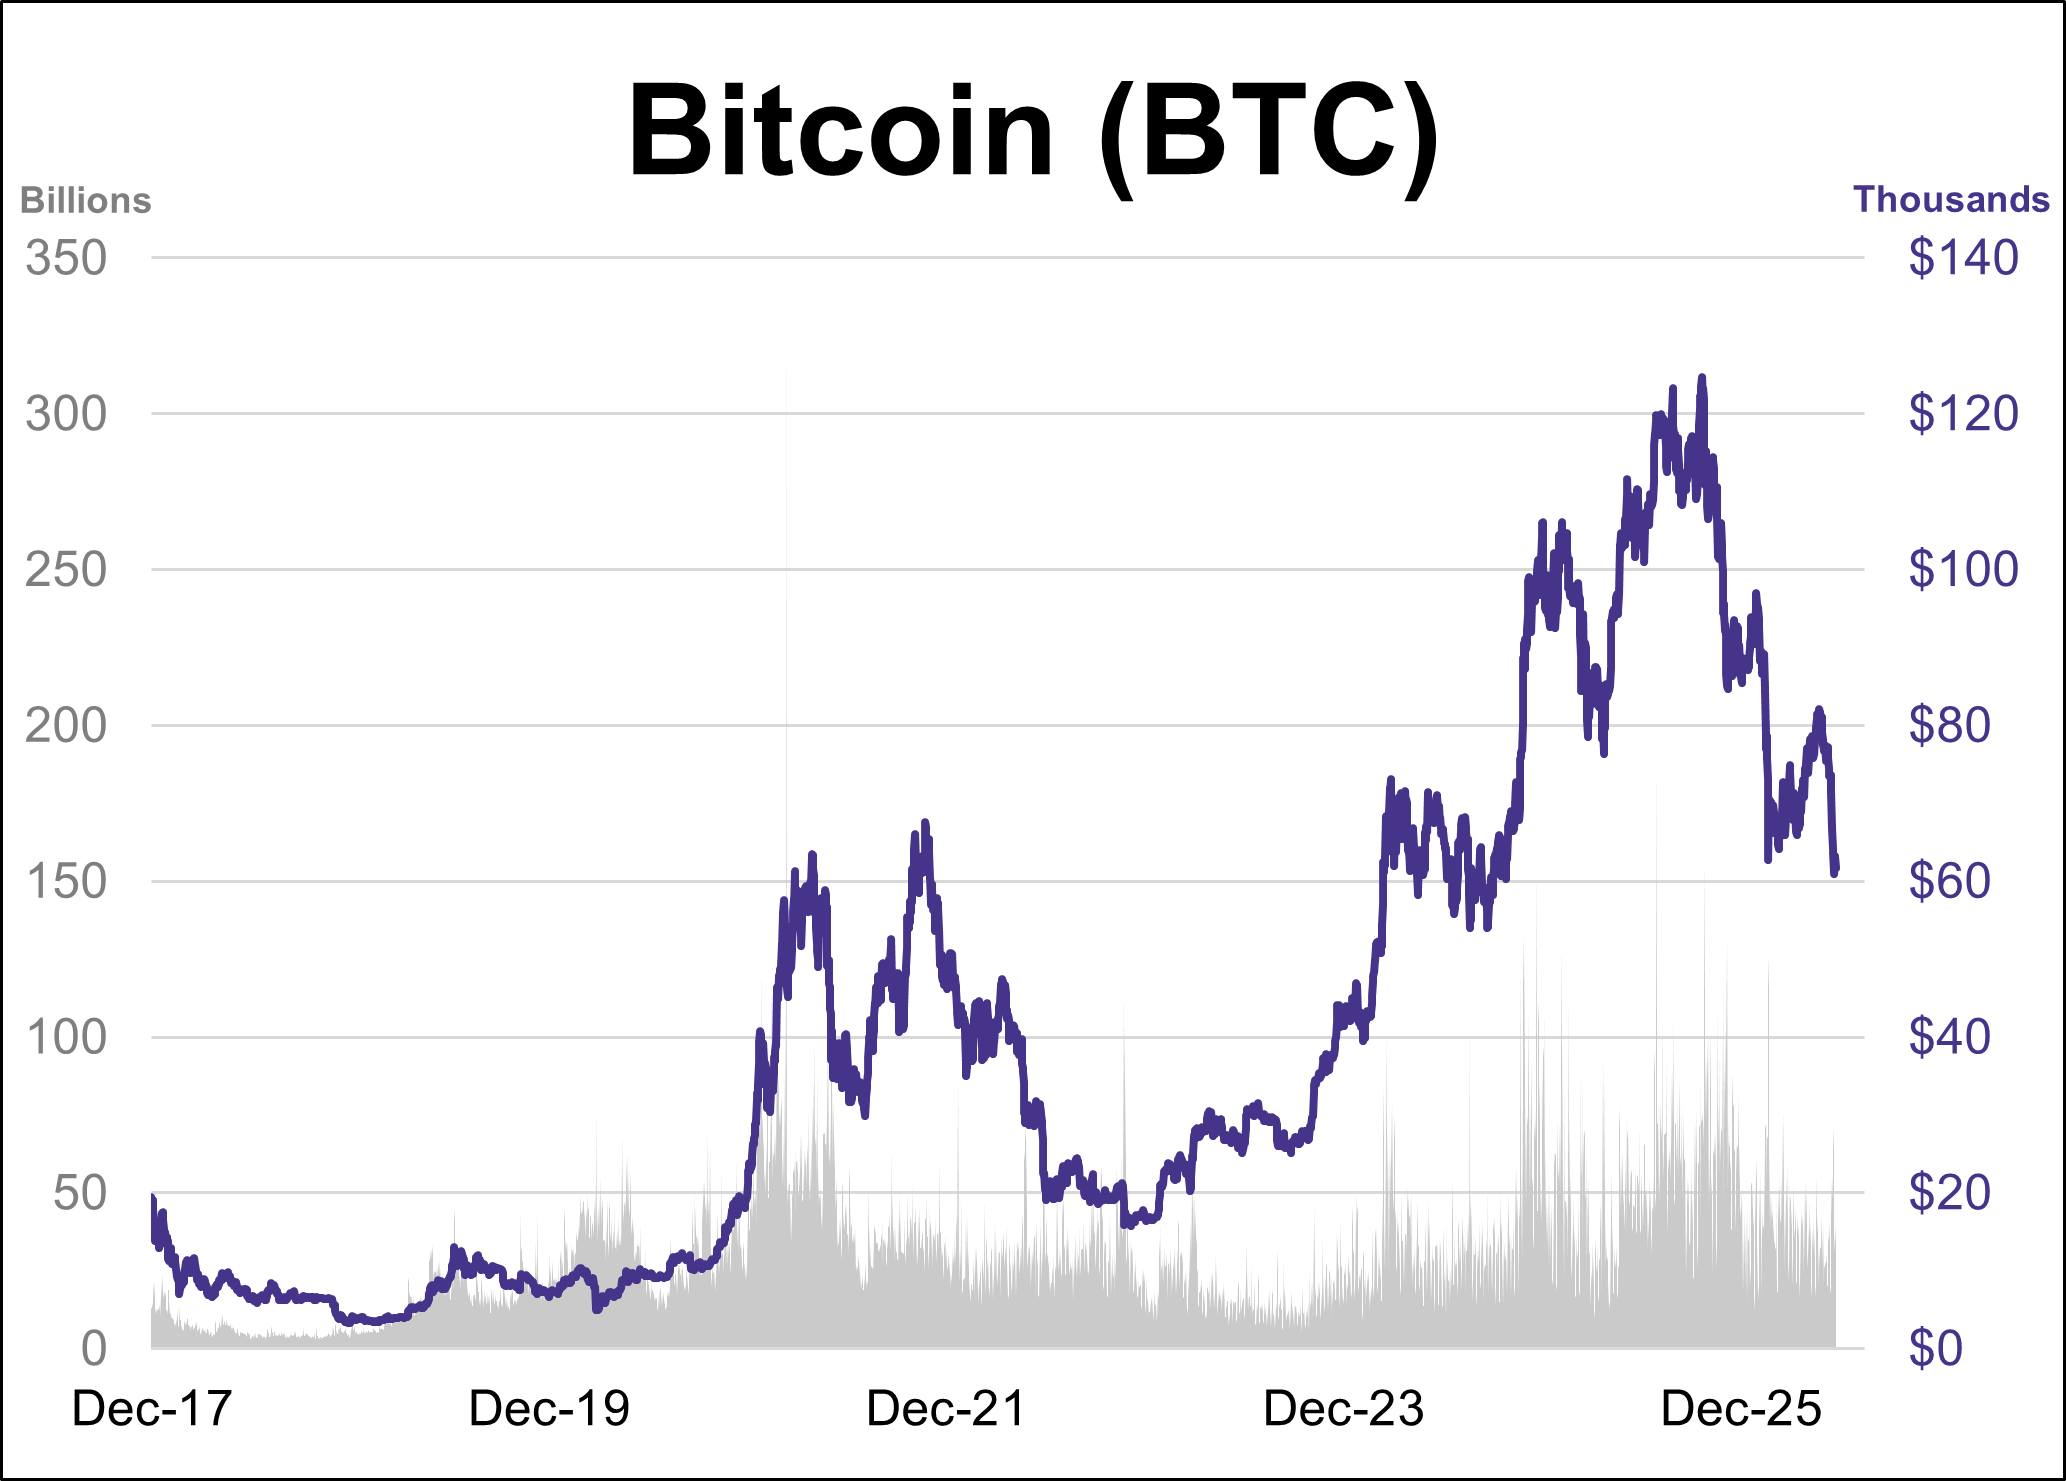
Bitcoin struggled for a fourth straight week, plummeting to its lowest level since October 2024. BTC is currently down approximately 30% year-to-date and sits ~51% below its October 2025 record high.
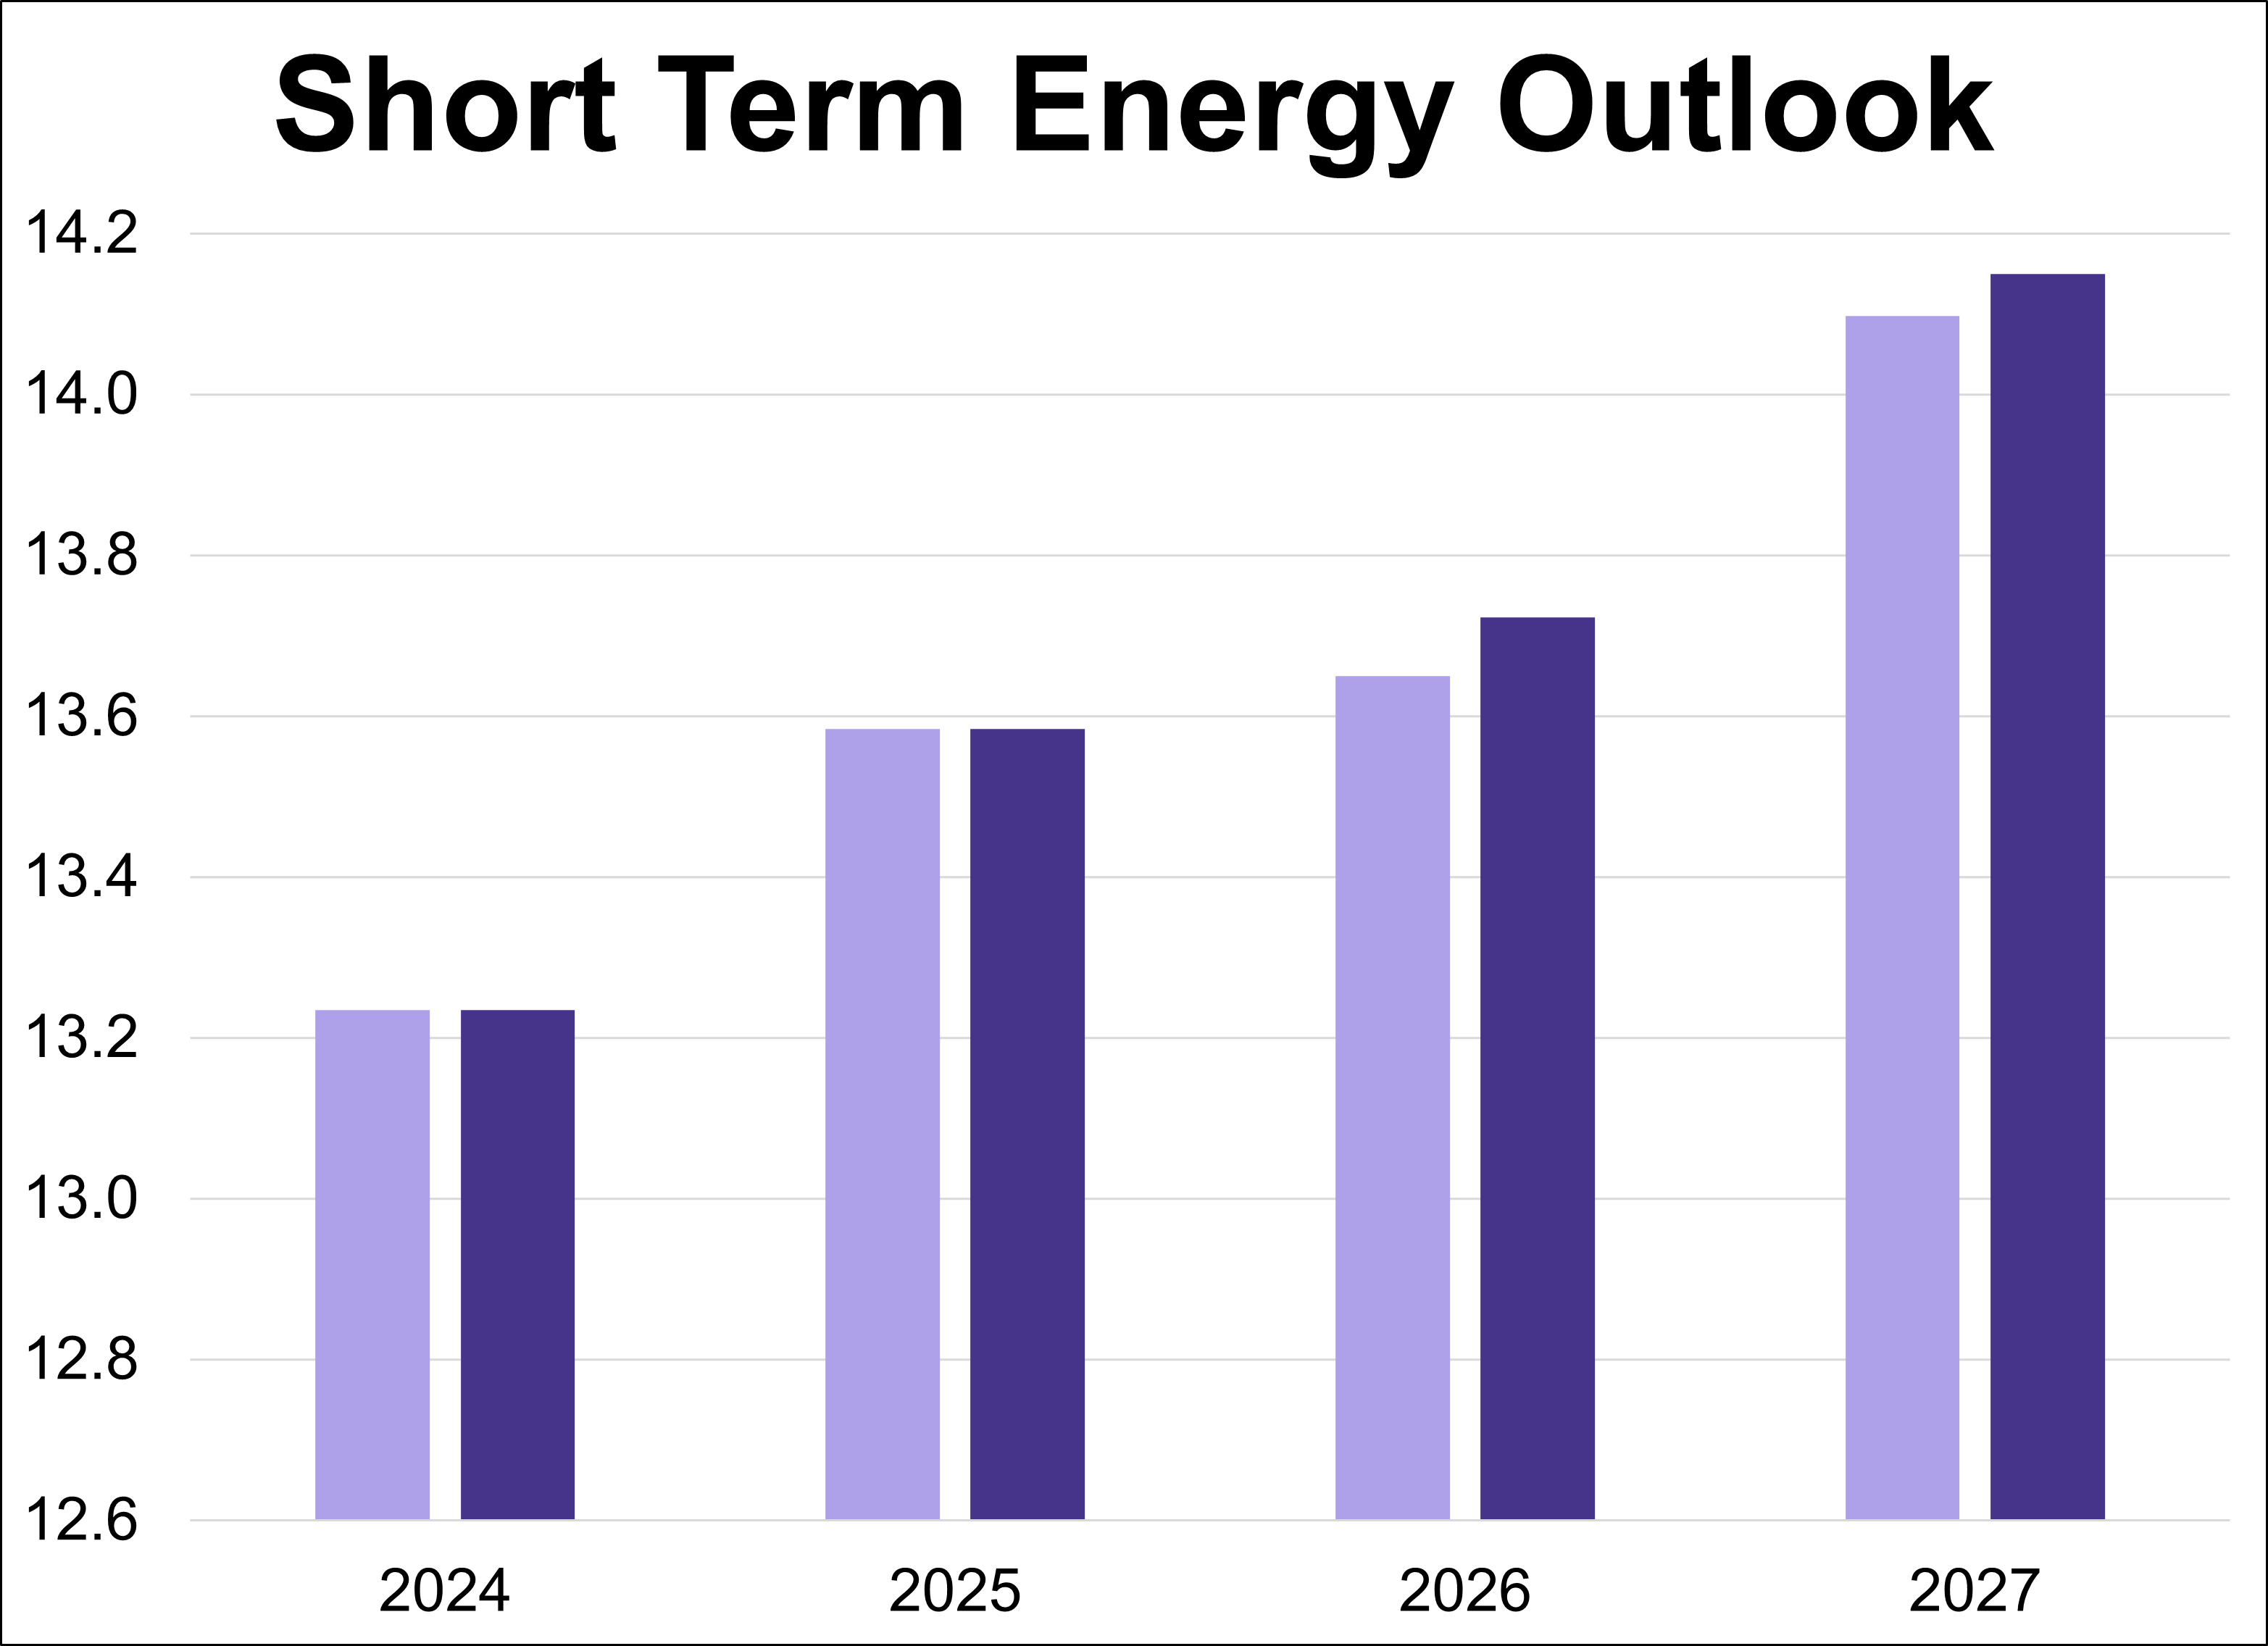
The U.S. Energy Information Administration (EIA) has released its latest Short-Term Energy Outlook (STEO), providing forecasts for energy markets. This article presents the annual production outlooks for crude oil, natural gas, and natural gas liquids (NGLs), comparing the June 2026 projections against the previous month's estimates.
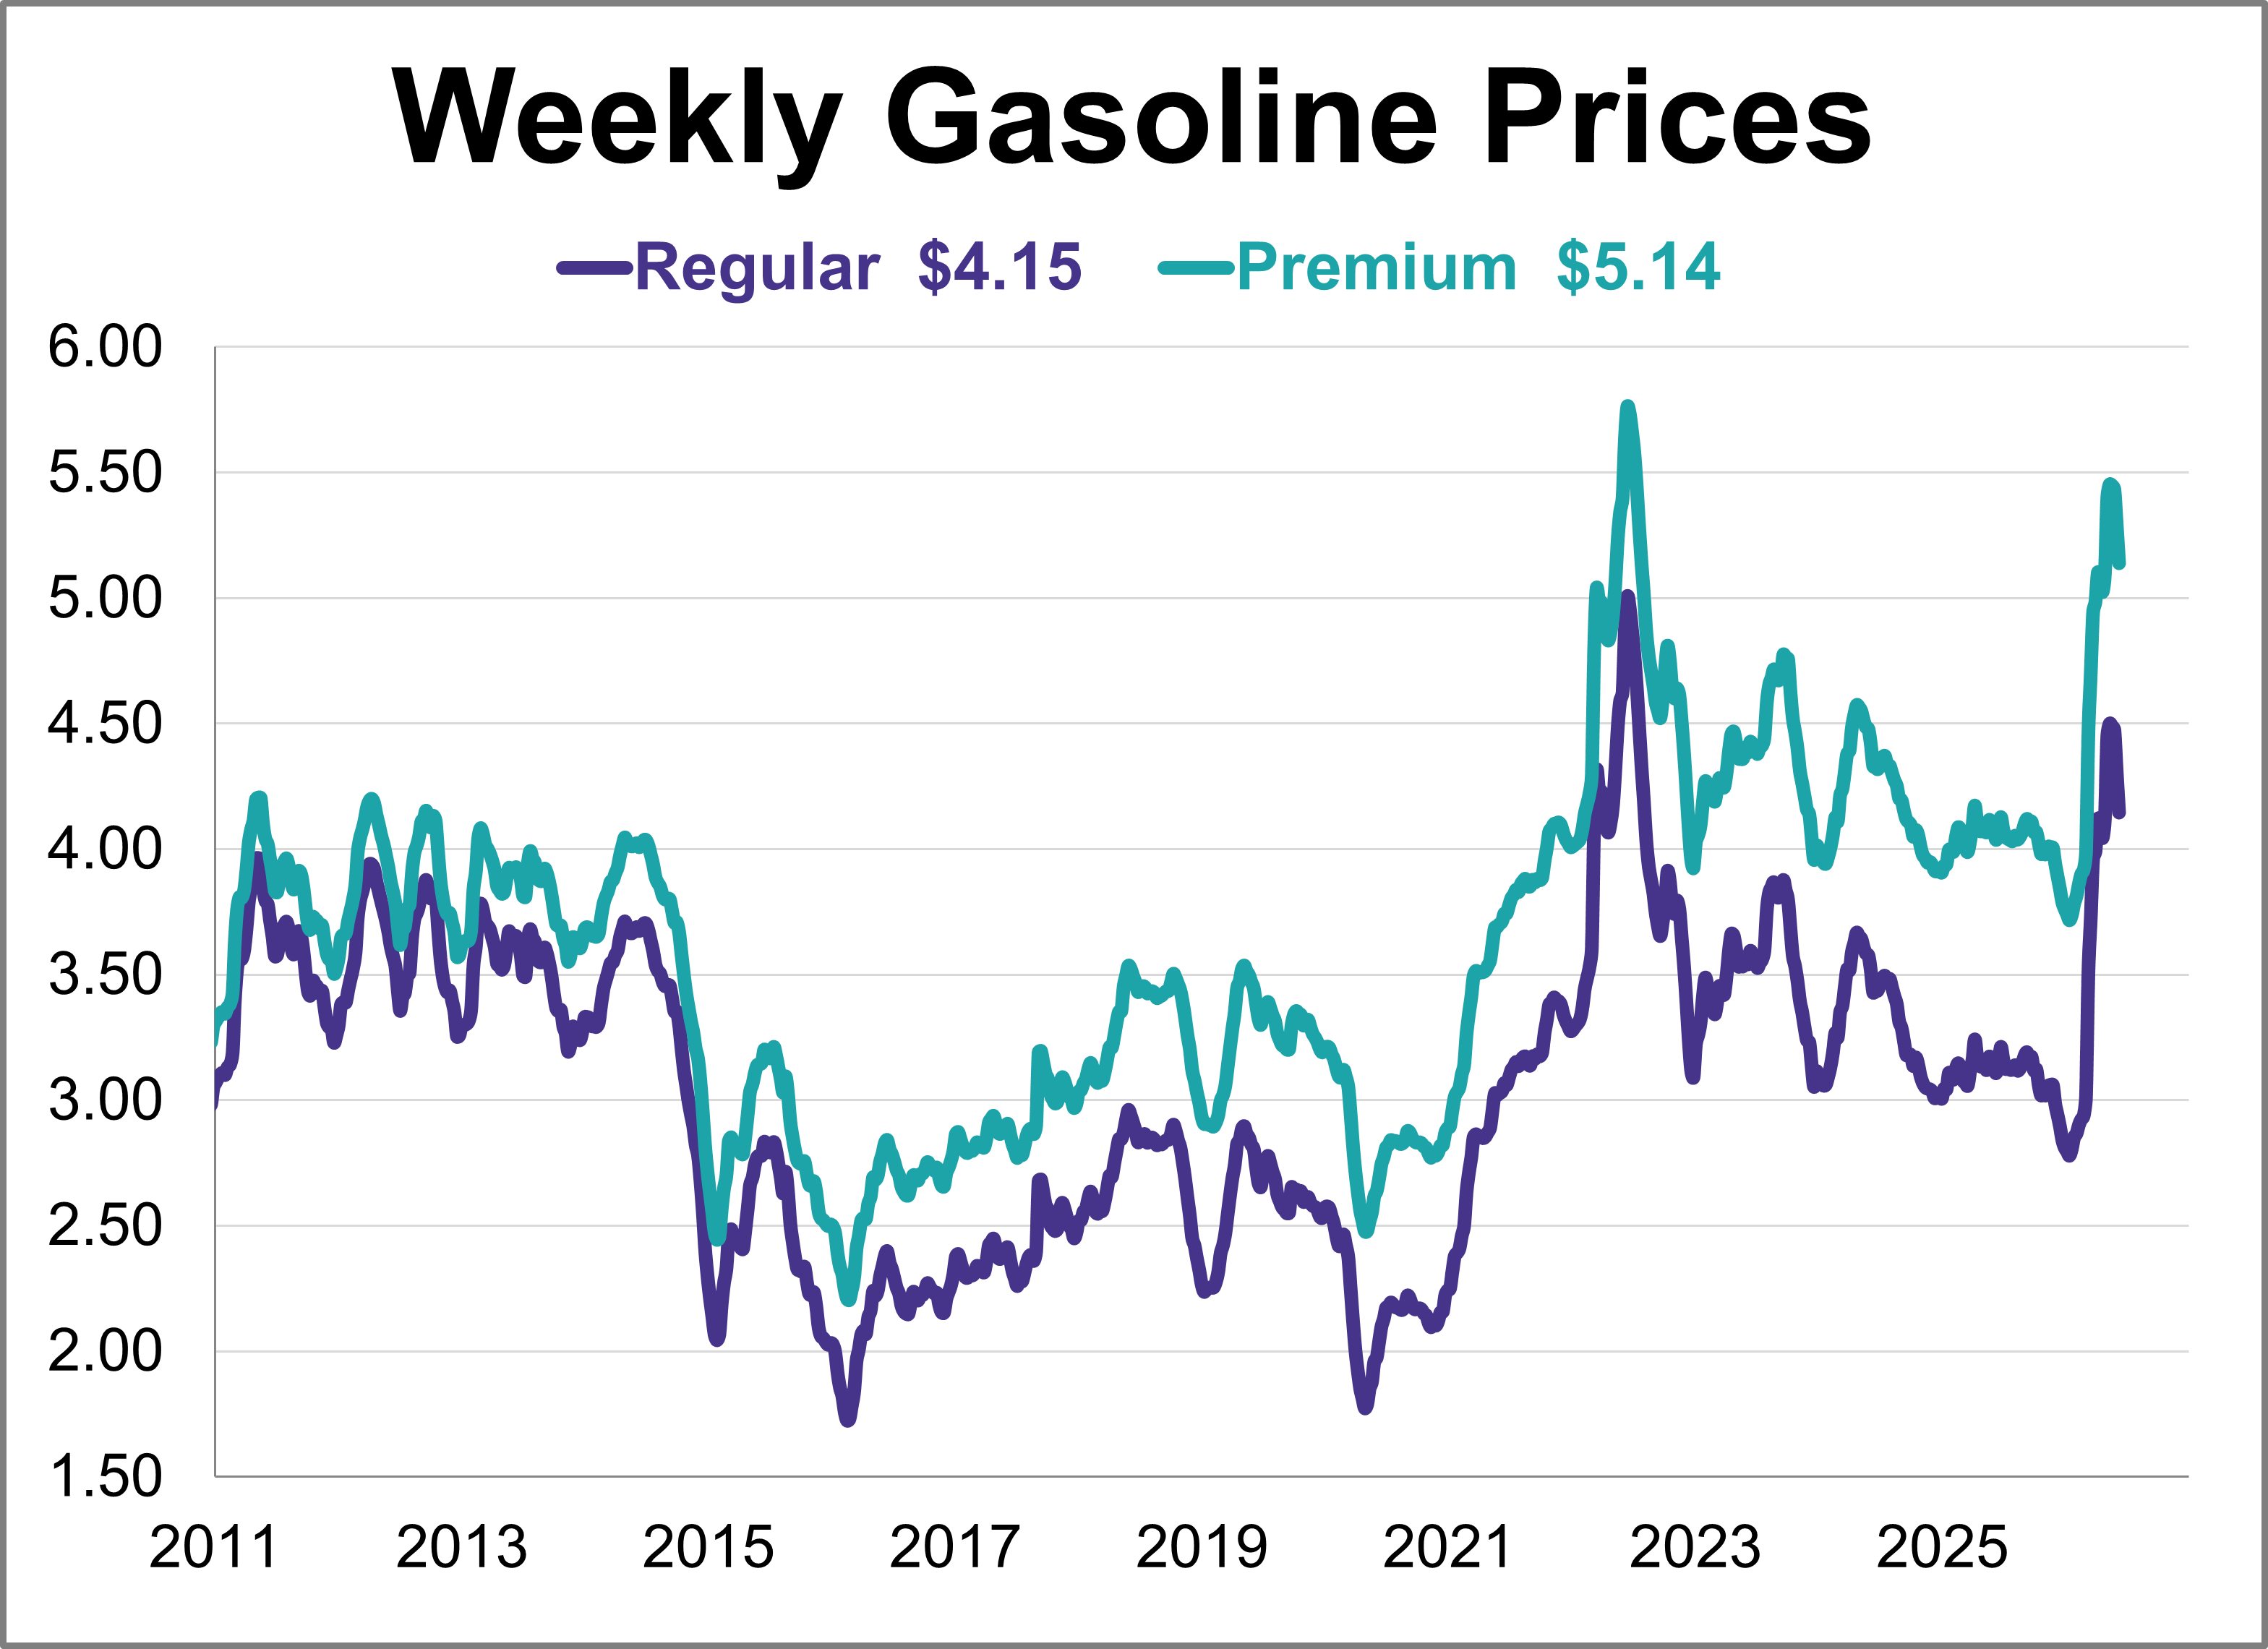
Gas prices fell for a fourth straight week, reaching their lowest level in six weeks. As of June 8th, weekly prices were down 16 cents for regular and down 15 cents for premium gasoline.
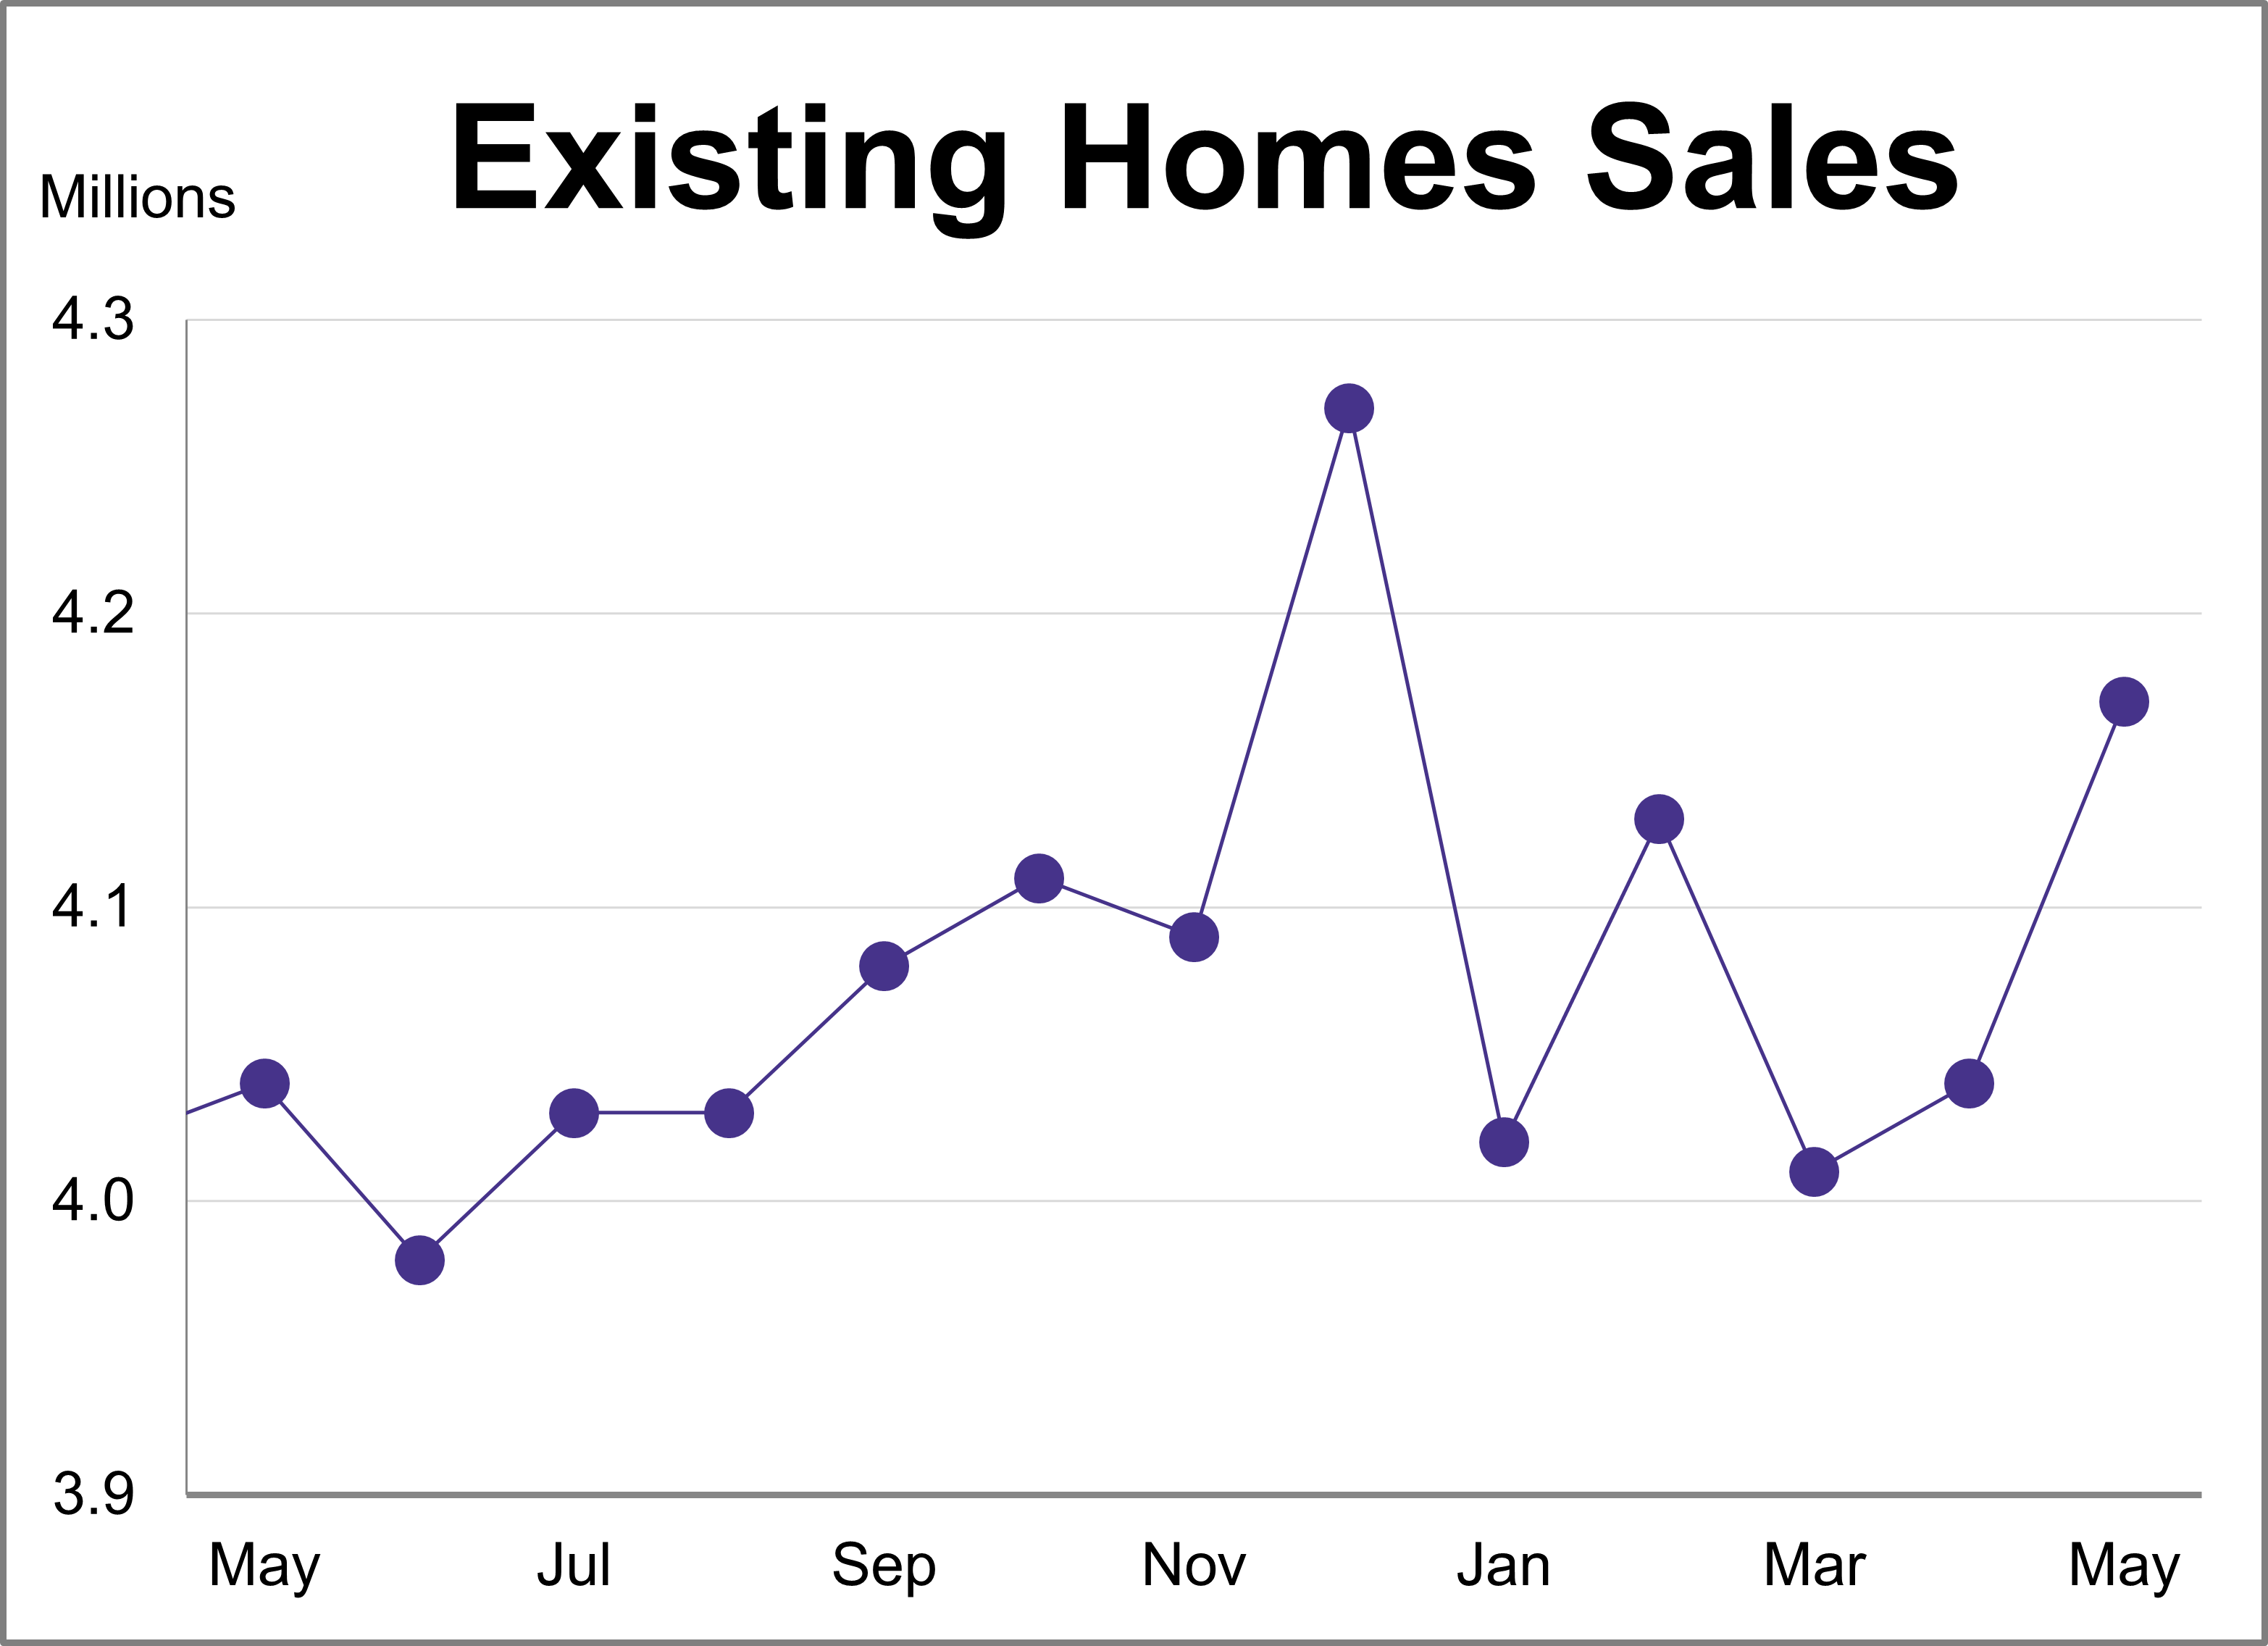
Existing home sales reached their highest level of the year in May, rising 3.2% after a 0.7% increase in April. According to the National Association of Realtors (NAR), sales reached a seasonally adjusted annual rate of 4.17 million units, surpassing the projected 4.07 million.
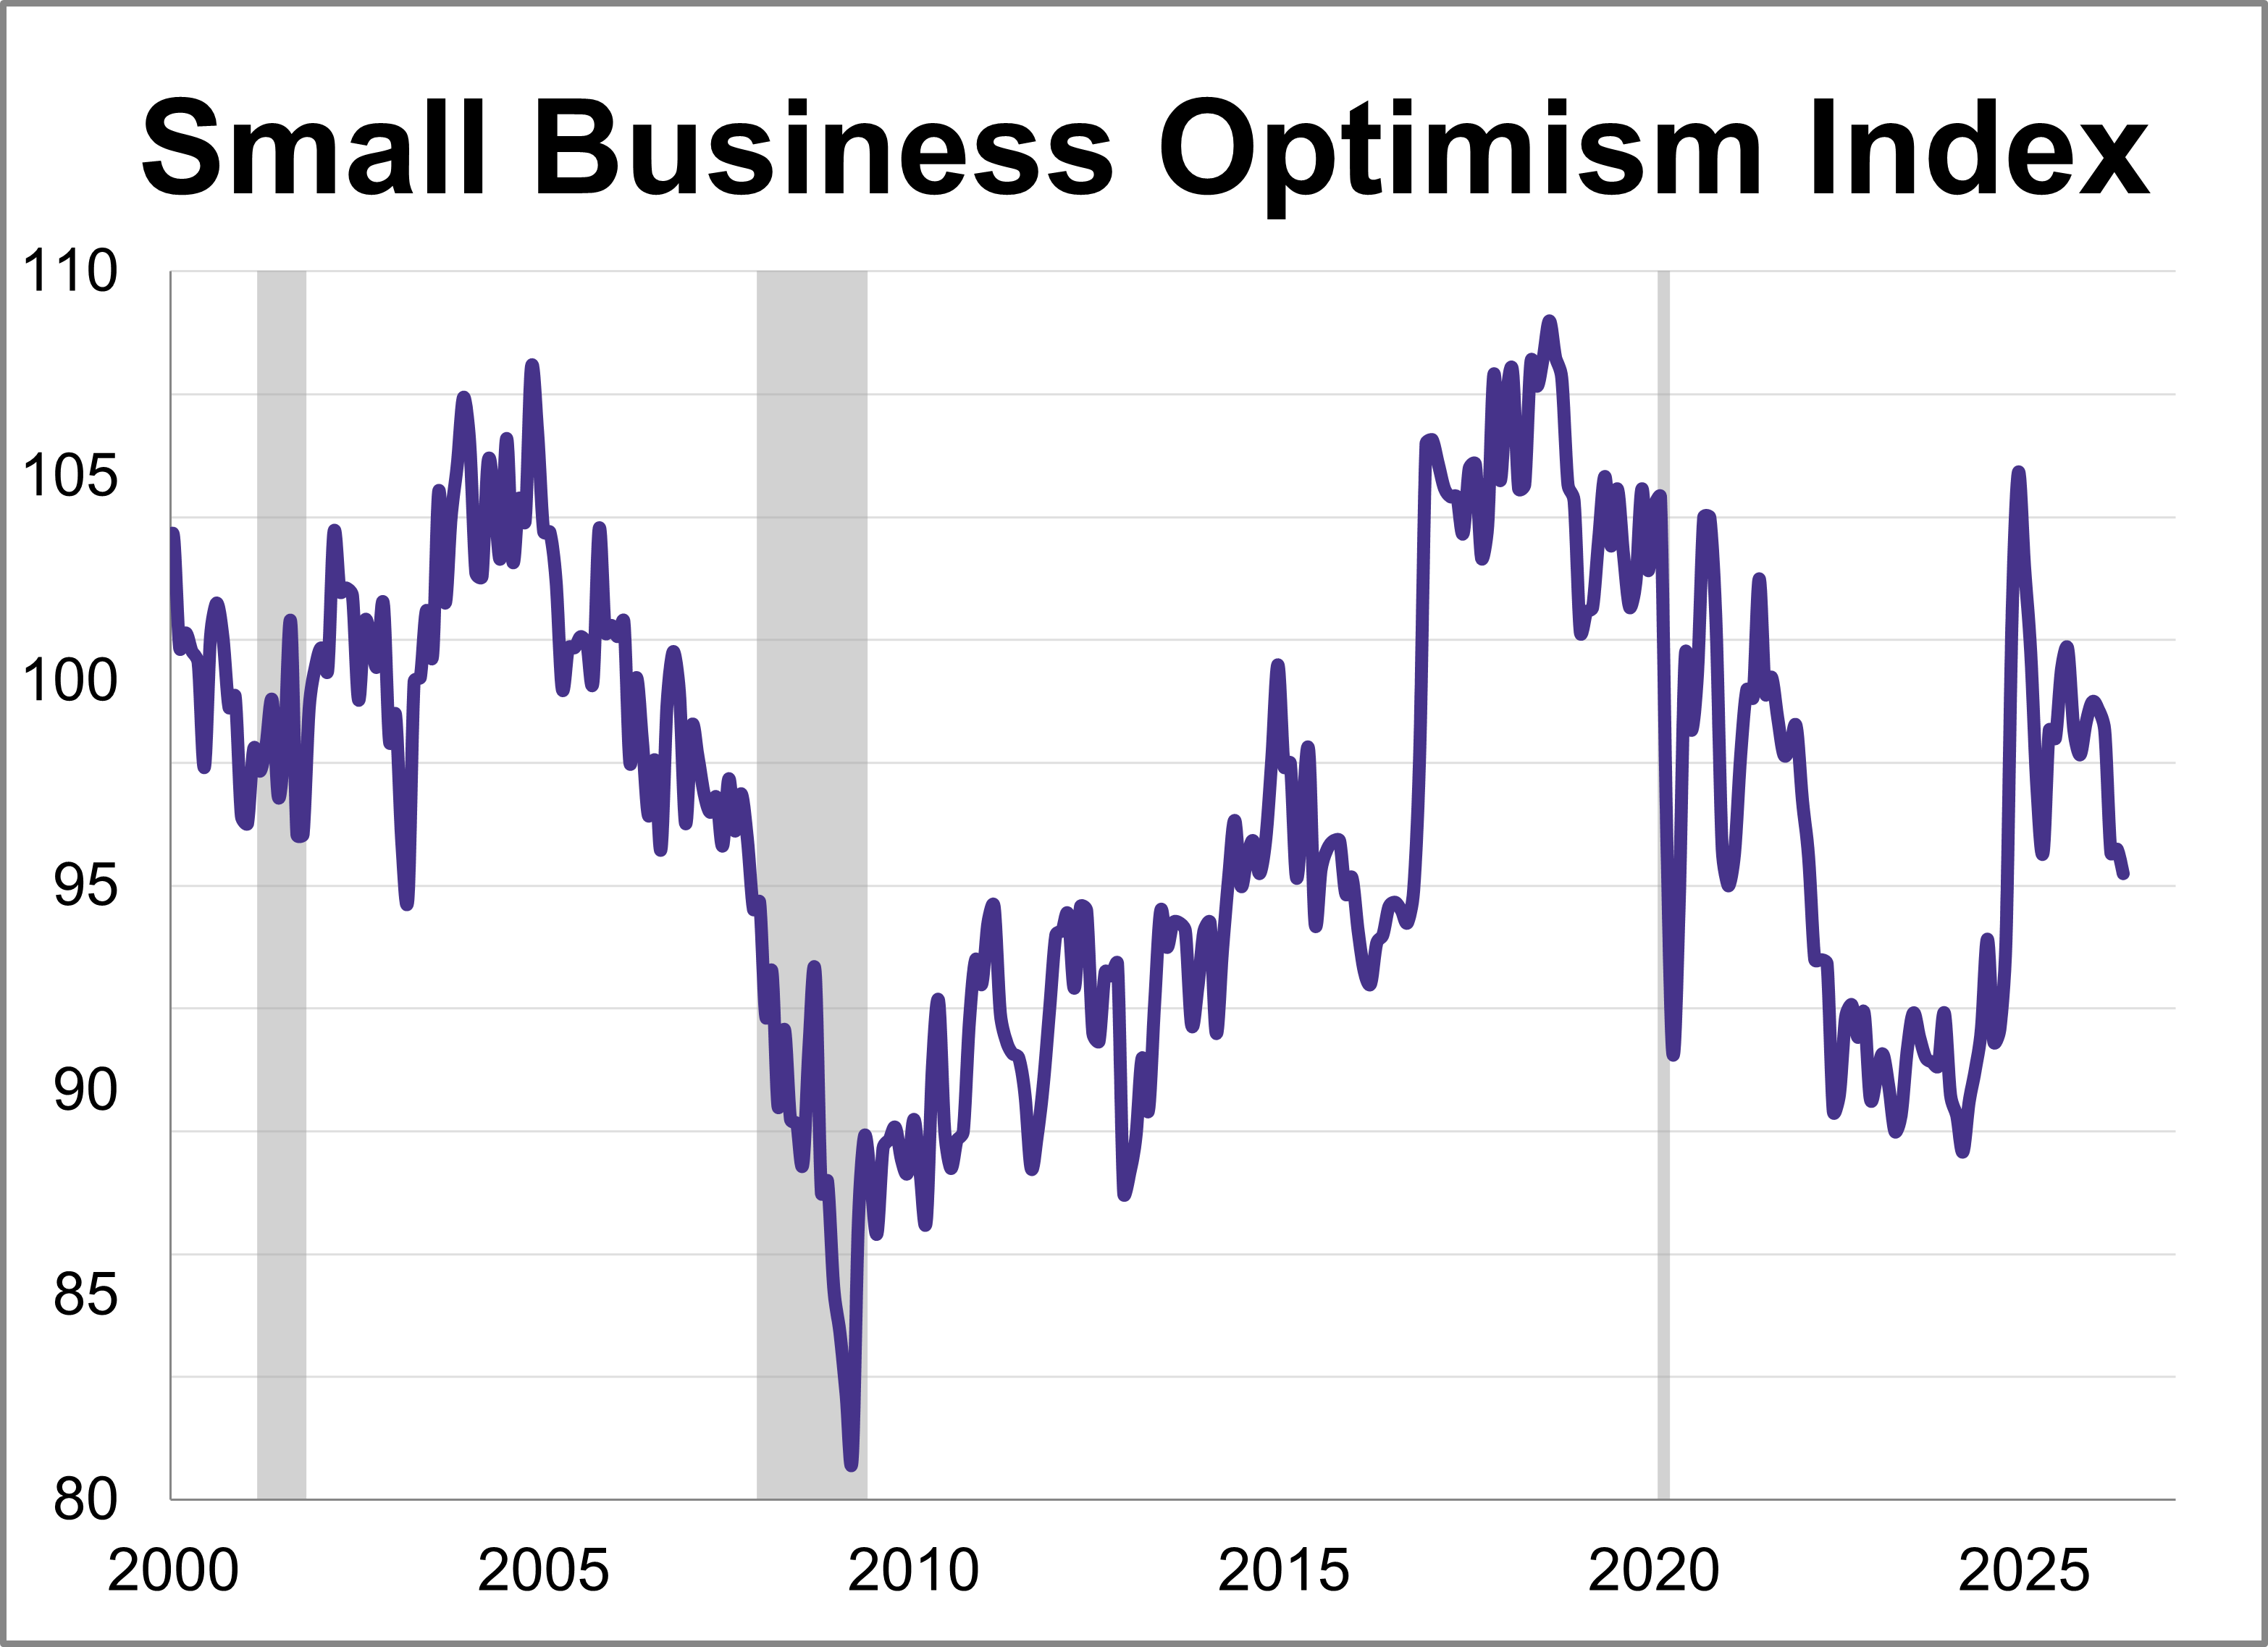
The NFIB Small Business Optimism Index dropped 0.6 points to 95.3, reaching its lowest level since October 2024. The index remains below its historical average for a third straight month.
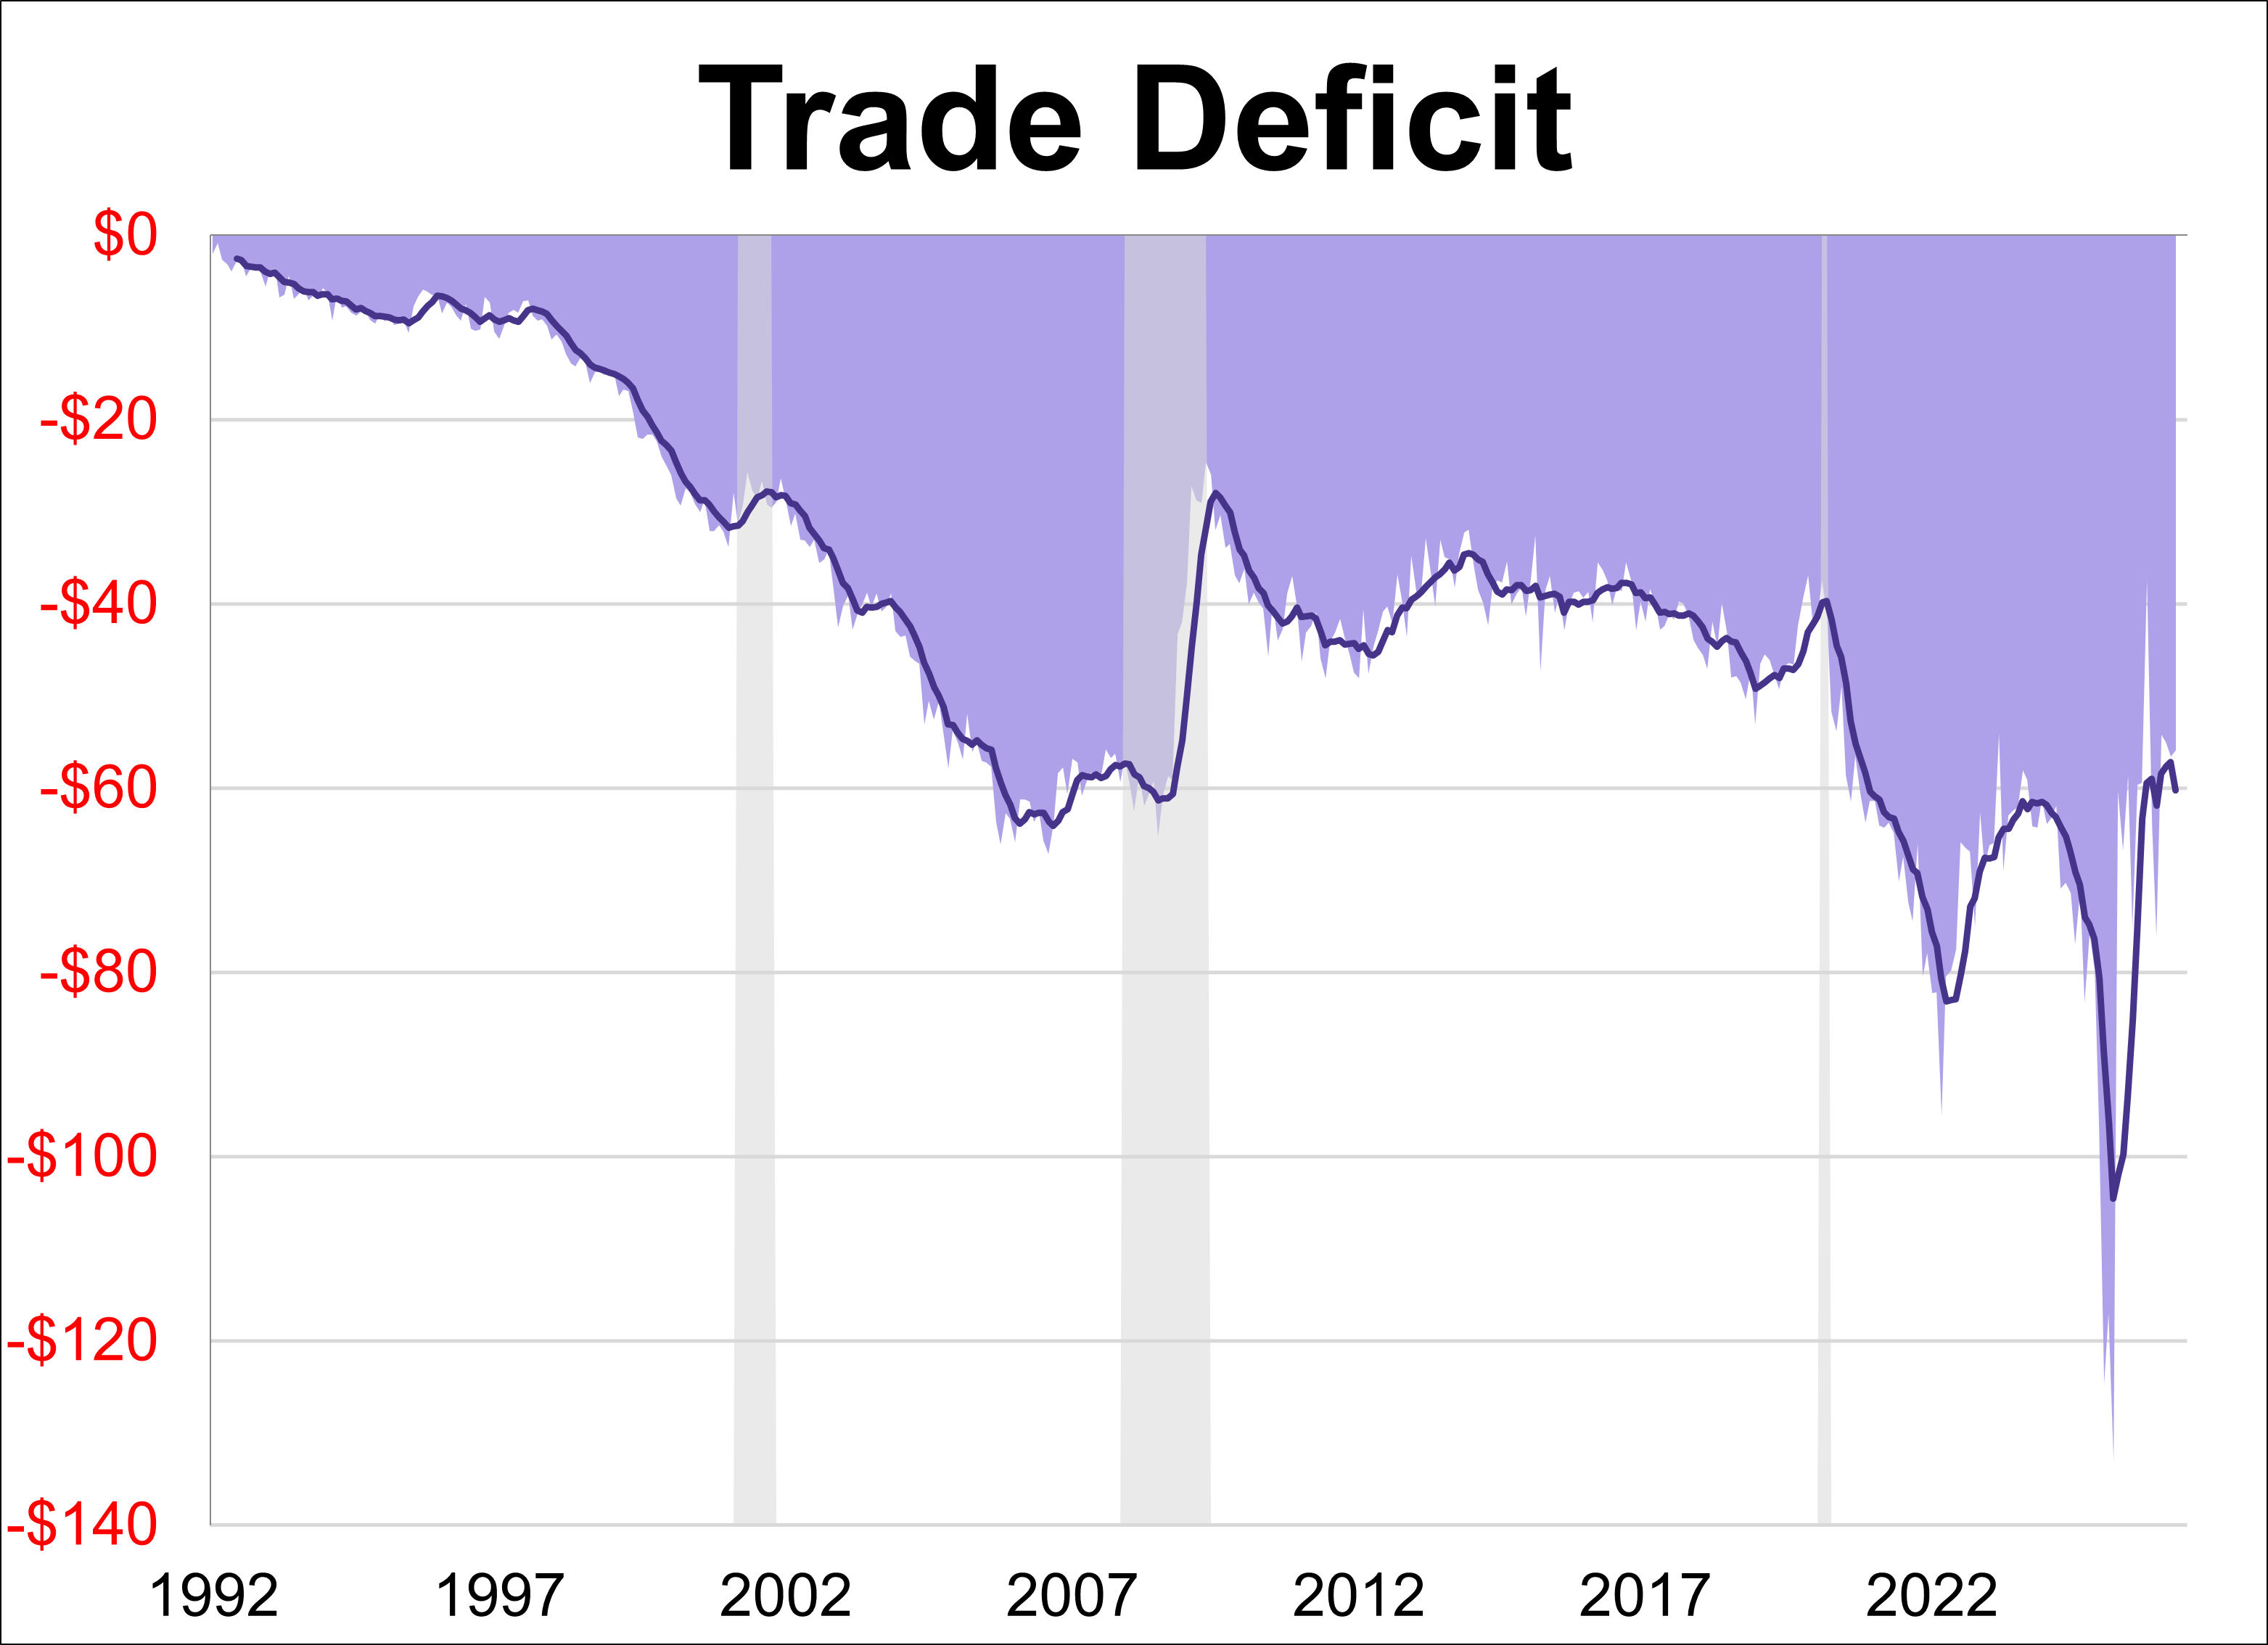
The U.S. trade deficit shrunk just over 1% in April to $55.88B after expanding nearly 3% the previous month. The latest reading barely missed the forecast of -$56.20B.
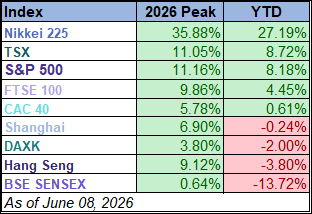
Five of the nine indexes on our world markets watch list posted year-to-date gains through June 8, 2026.
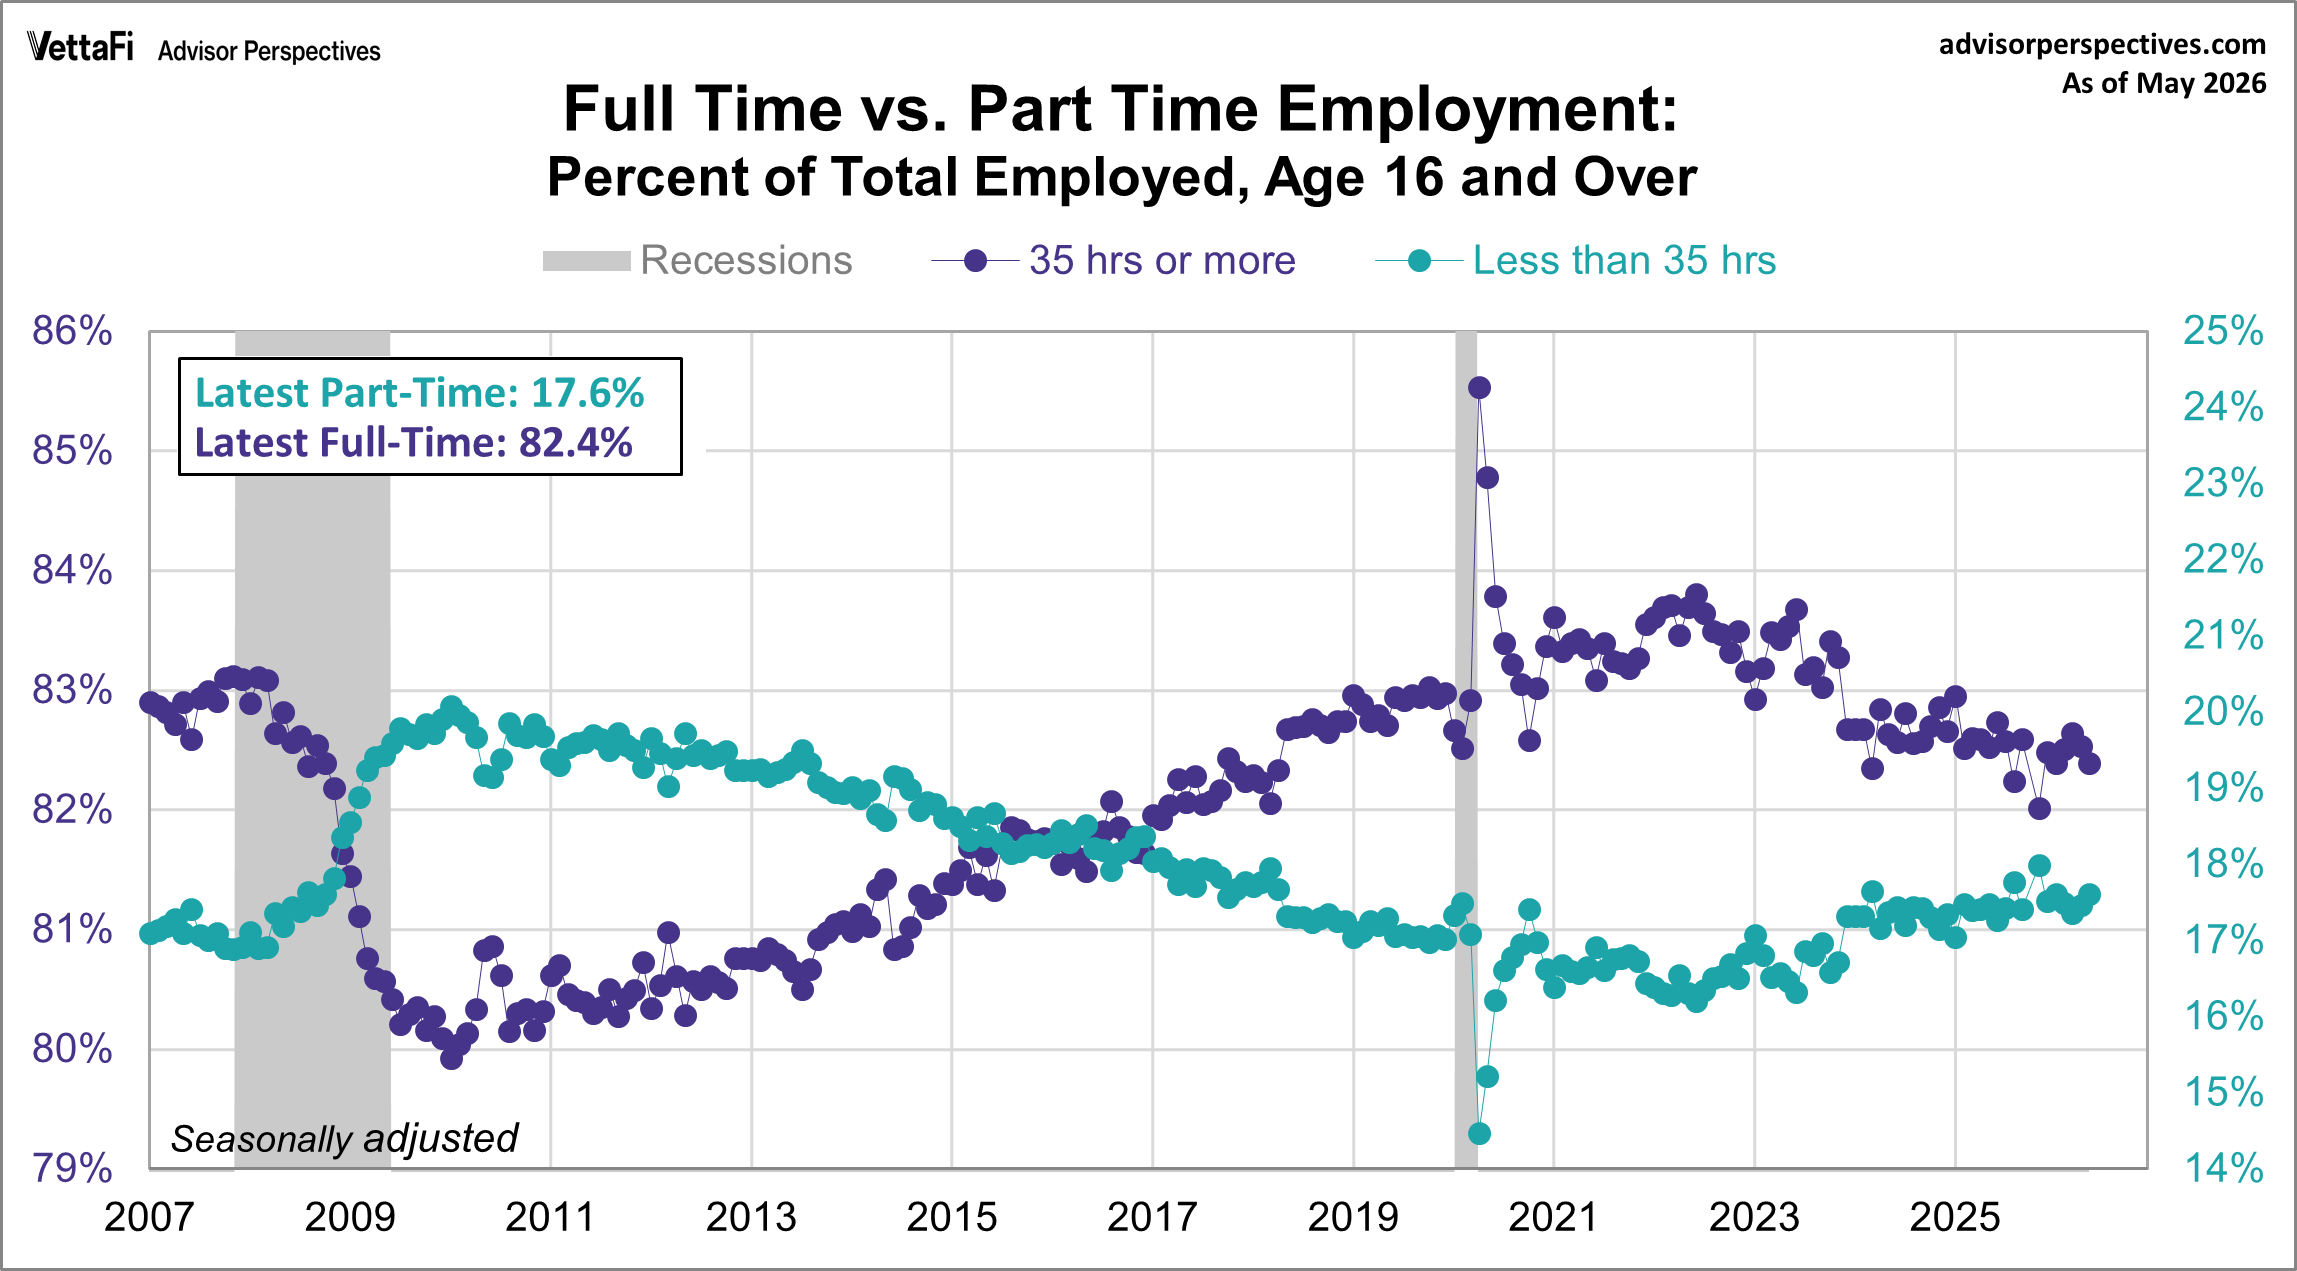
May's employment report showed that 17.6% of total employed workers were part time and 82.4% of total employed workers were full-time.
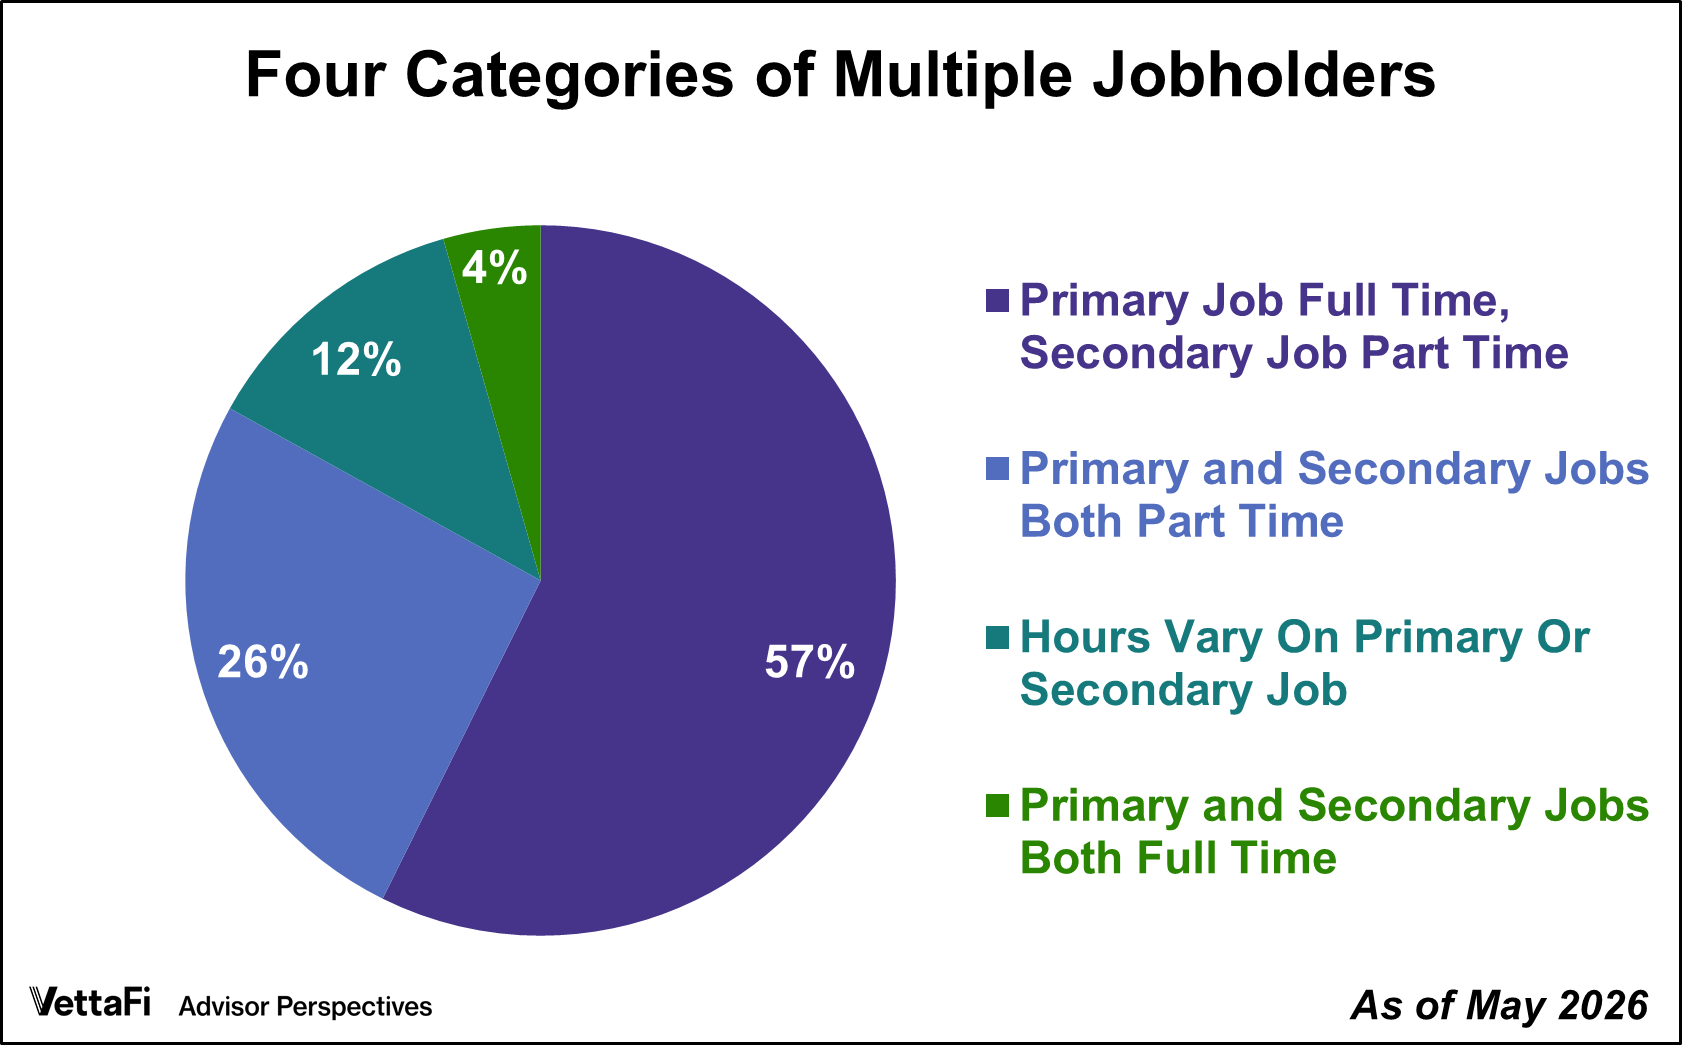
Multiple jobholders accounted for 5.1% of civilian employment in May, the lowest level in ten months.
What does the ratio of unemployment claims to the civilian labor force tell us about where we are in the business cycle and recession risk?
The U.S. labor market took center stage last week as three major labor market indicators outperformed forecasts. Robust payroll additions in both the public and private sectors, paired with a massive surge in job openings, point to a workforce on solid footing.
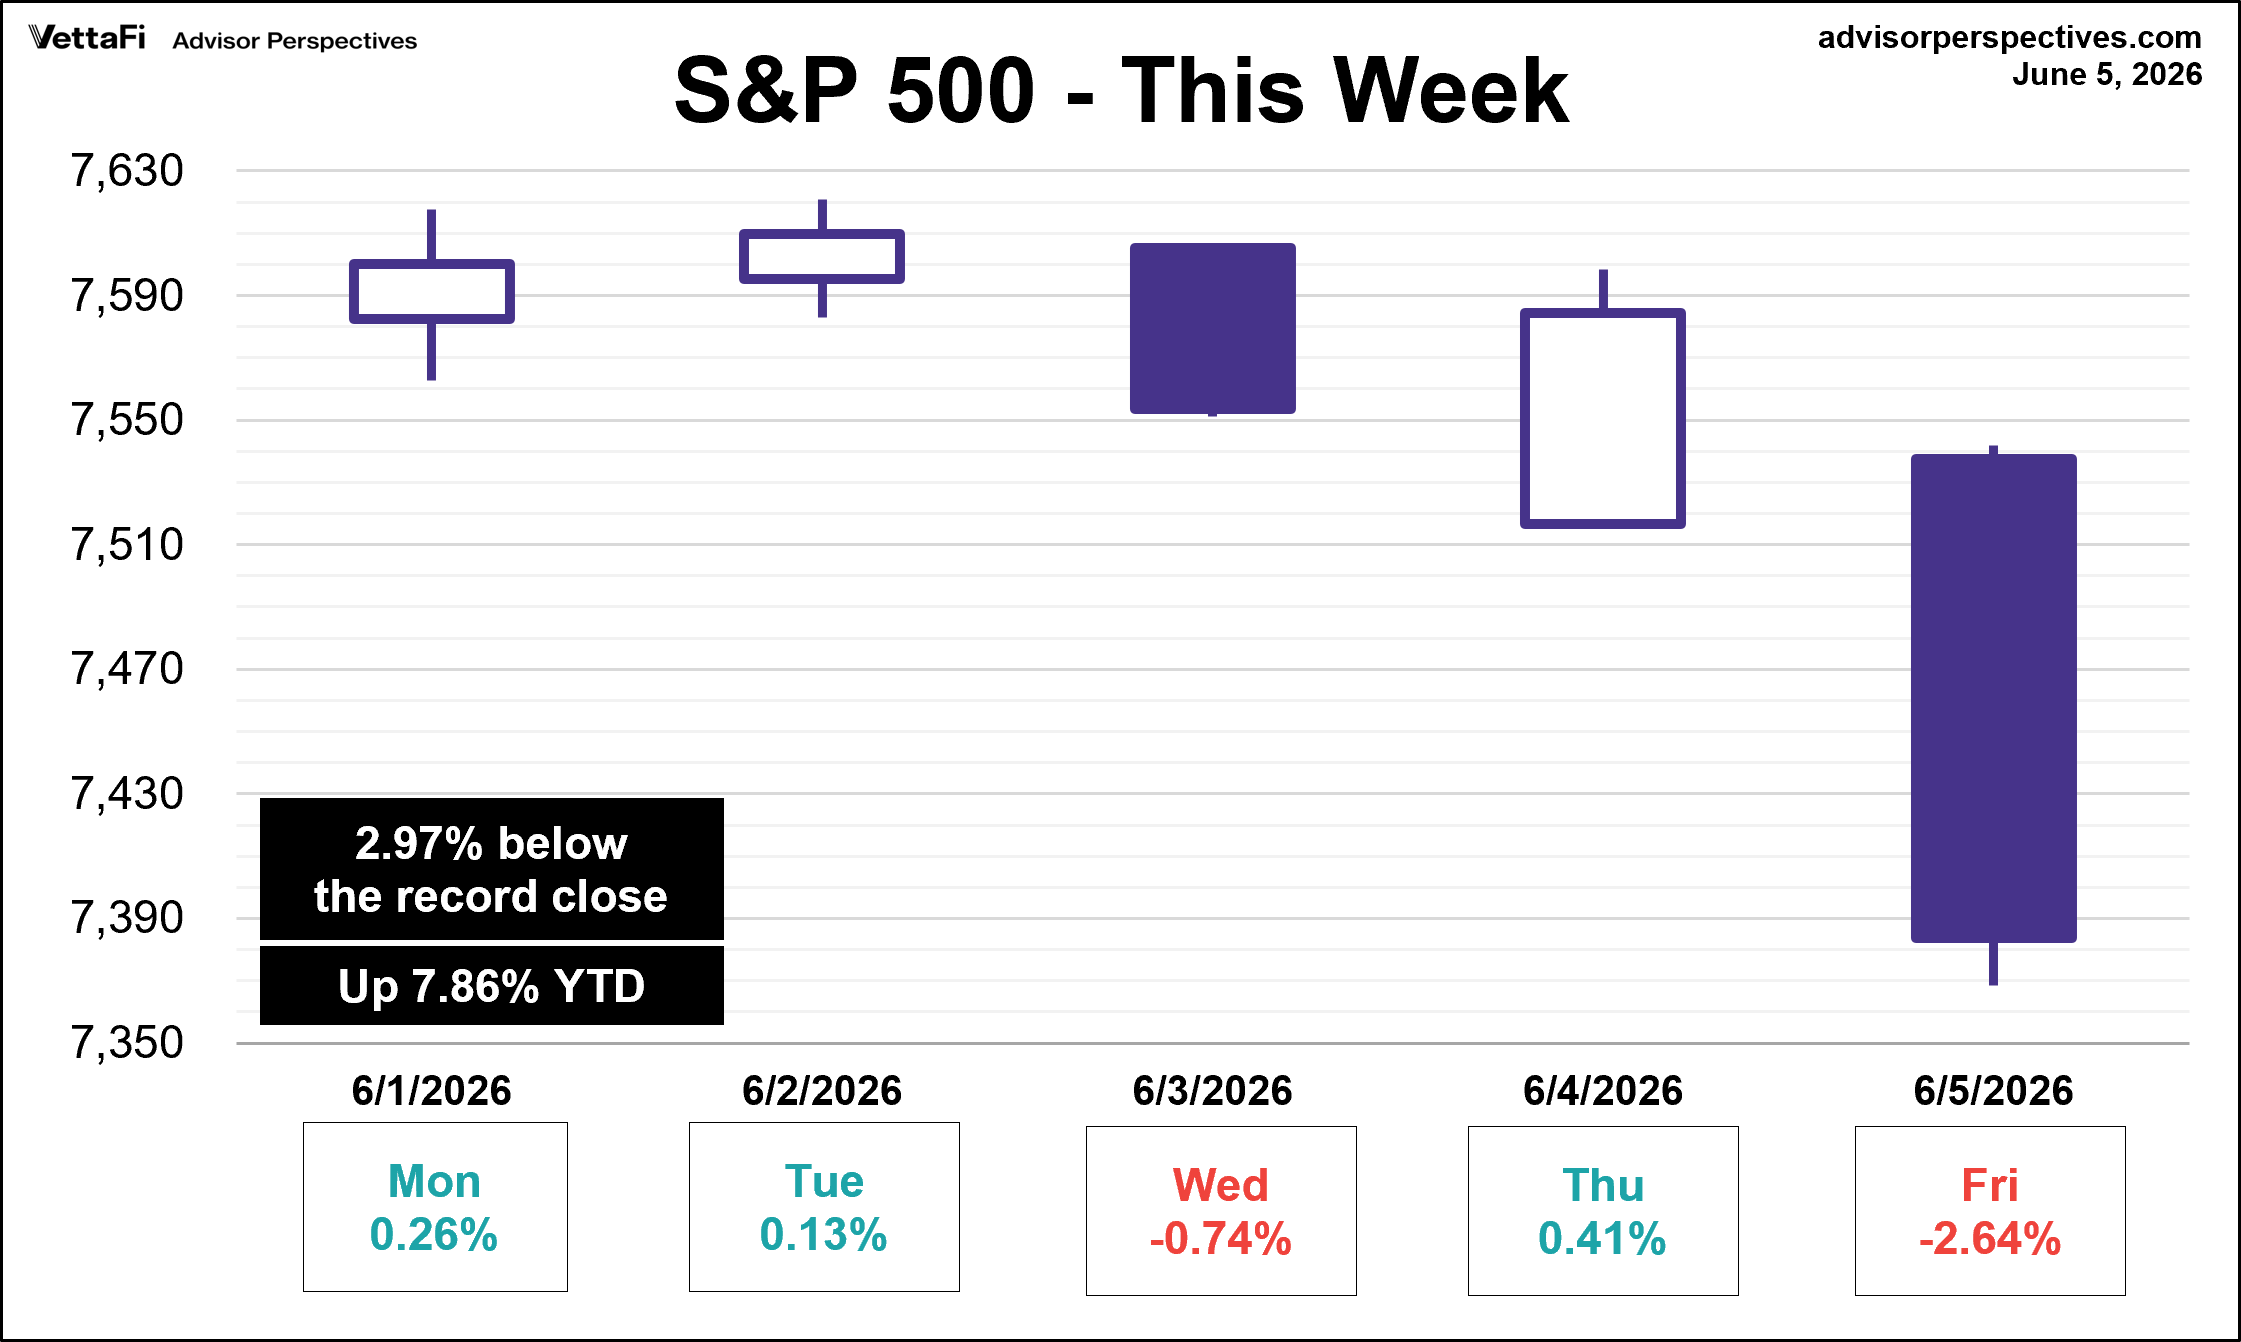
Although the S&P 500 reached multiple record highs early in the week, its upward momentum was halted on Friday by the stronger-than-expected jobs report, which triggered the index's largest single-day drop since April 2025.
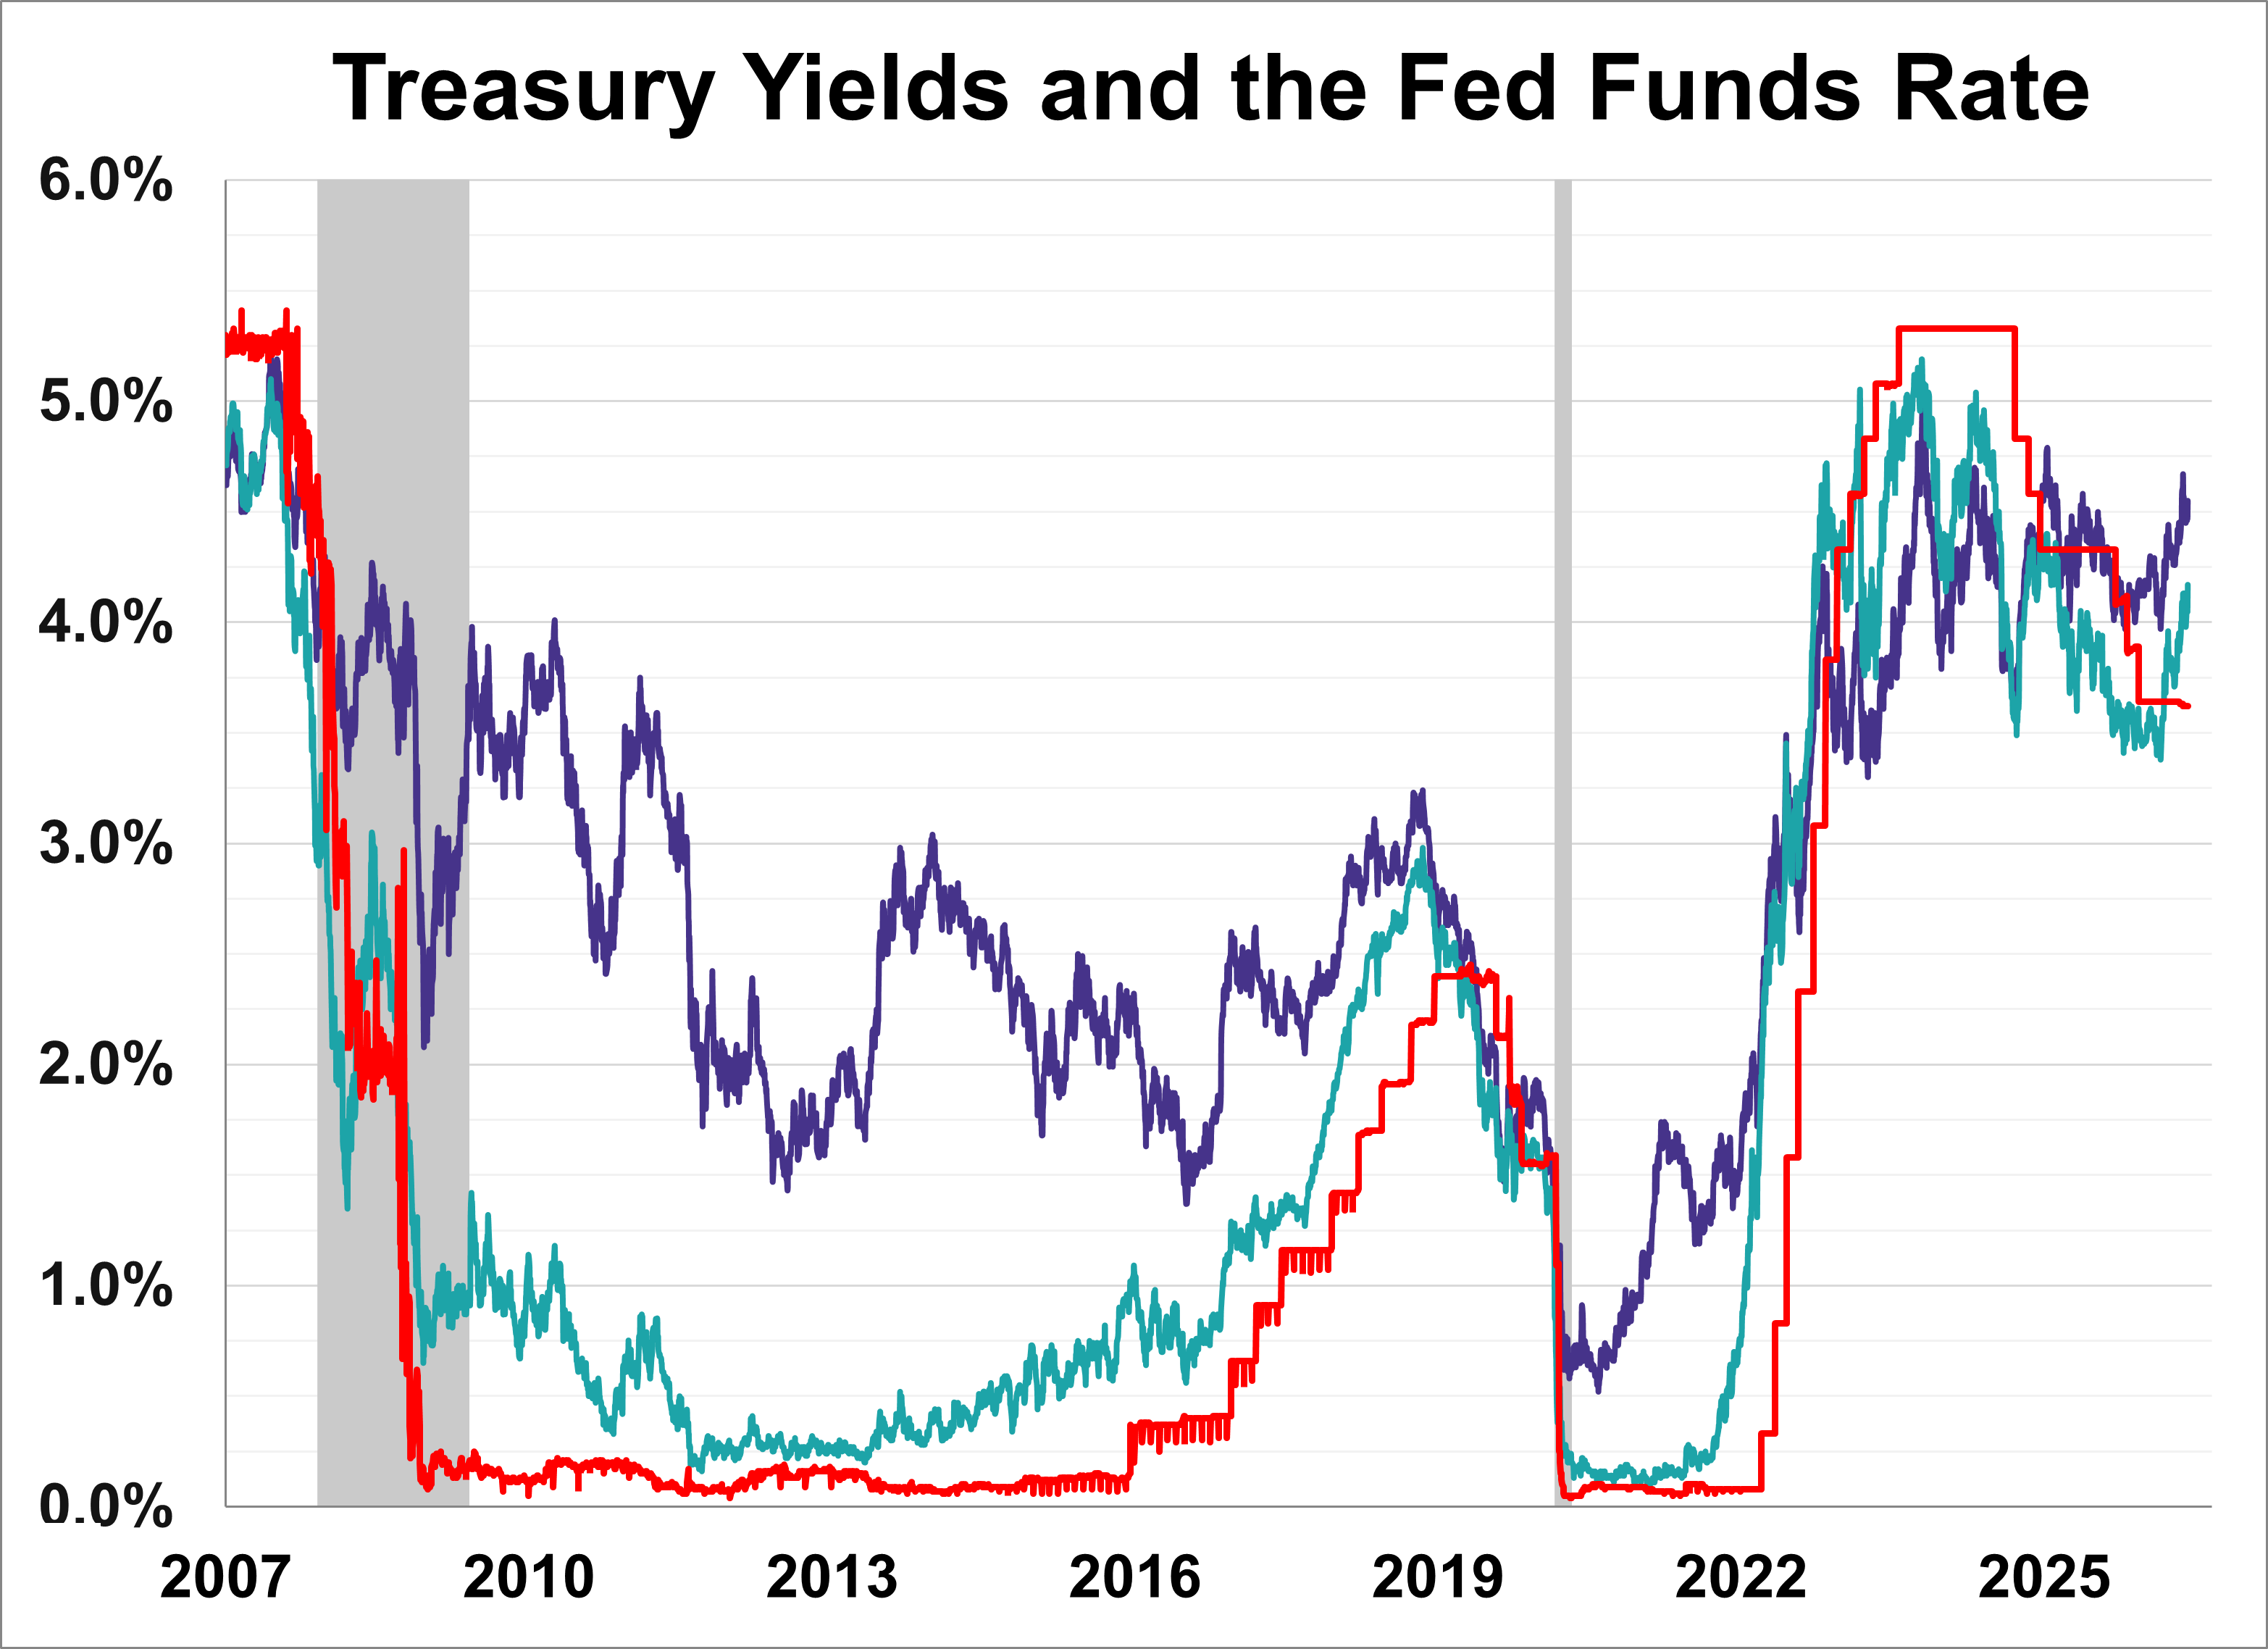
The yield on the 10-year note finished June 5, 2026 at 4.55% while the 2-year note ended at 4.17%, its highest level since February 2025.
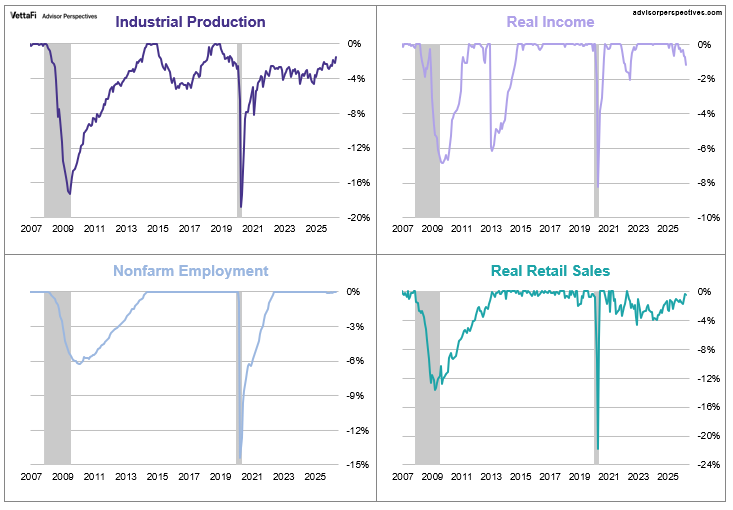
Official recession calls are the responsibility of the NBER Business Cycle Dating Committee, which is understandably vague about the specific indicators on which they base their decisions. There is, however, a general belief that there are four big indicators that the committee weighs heavily in their cycle identification process.
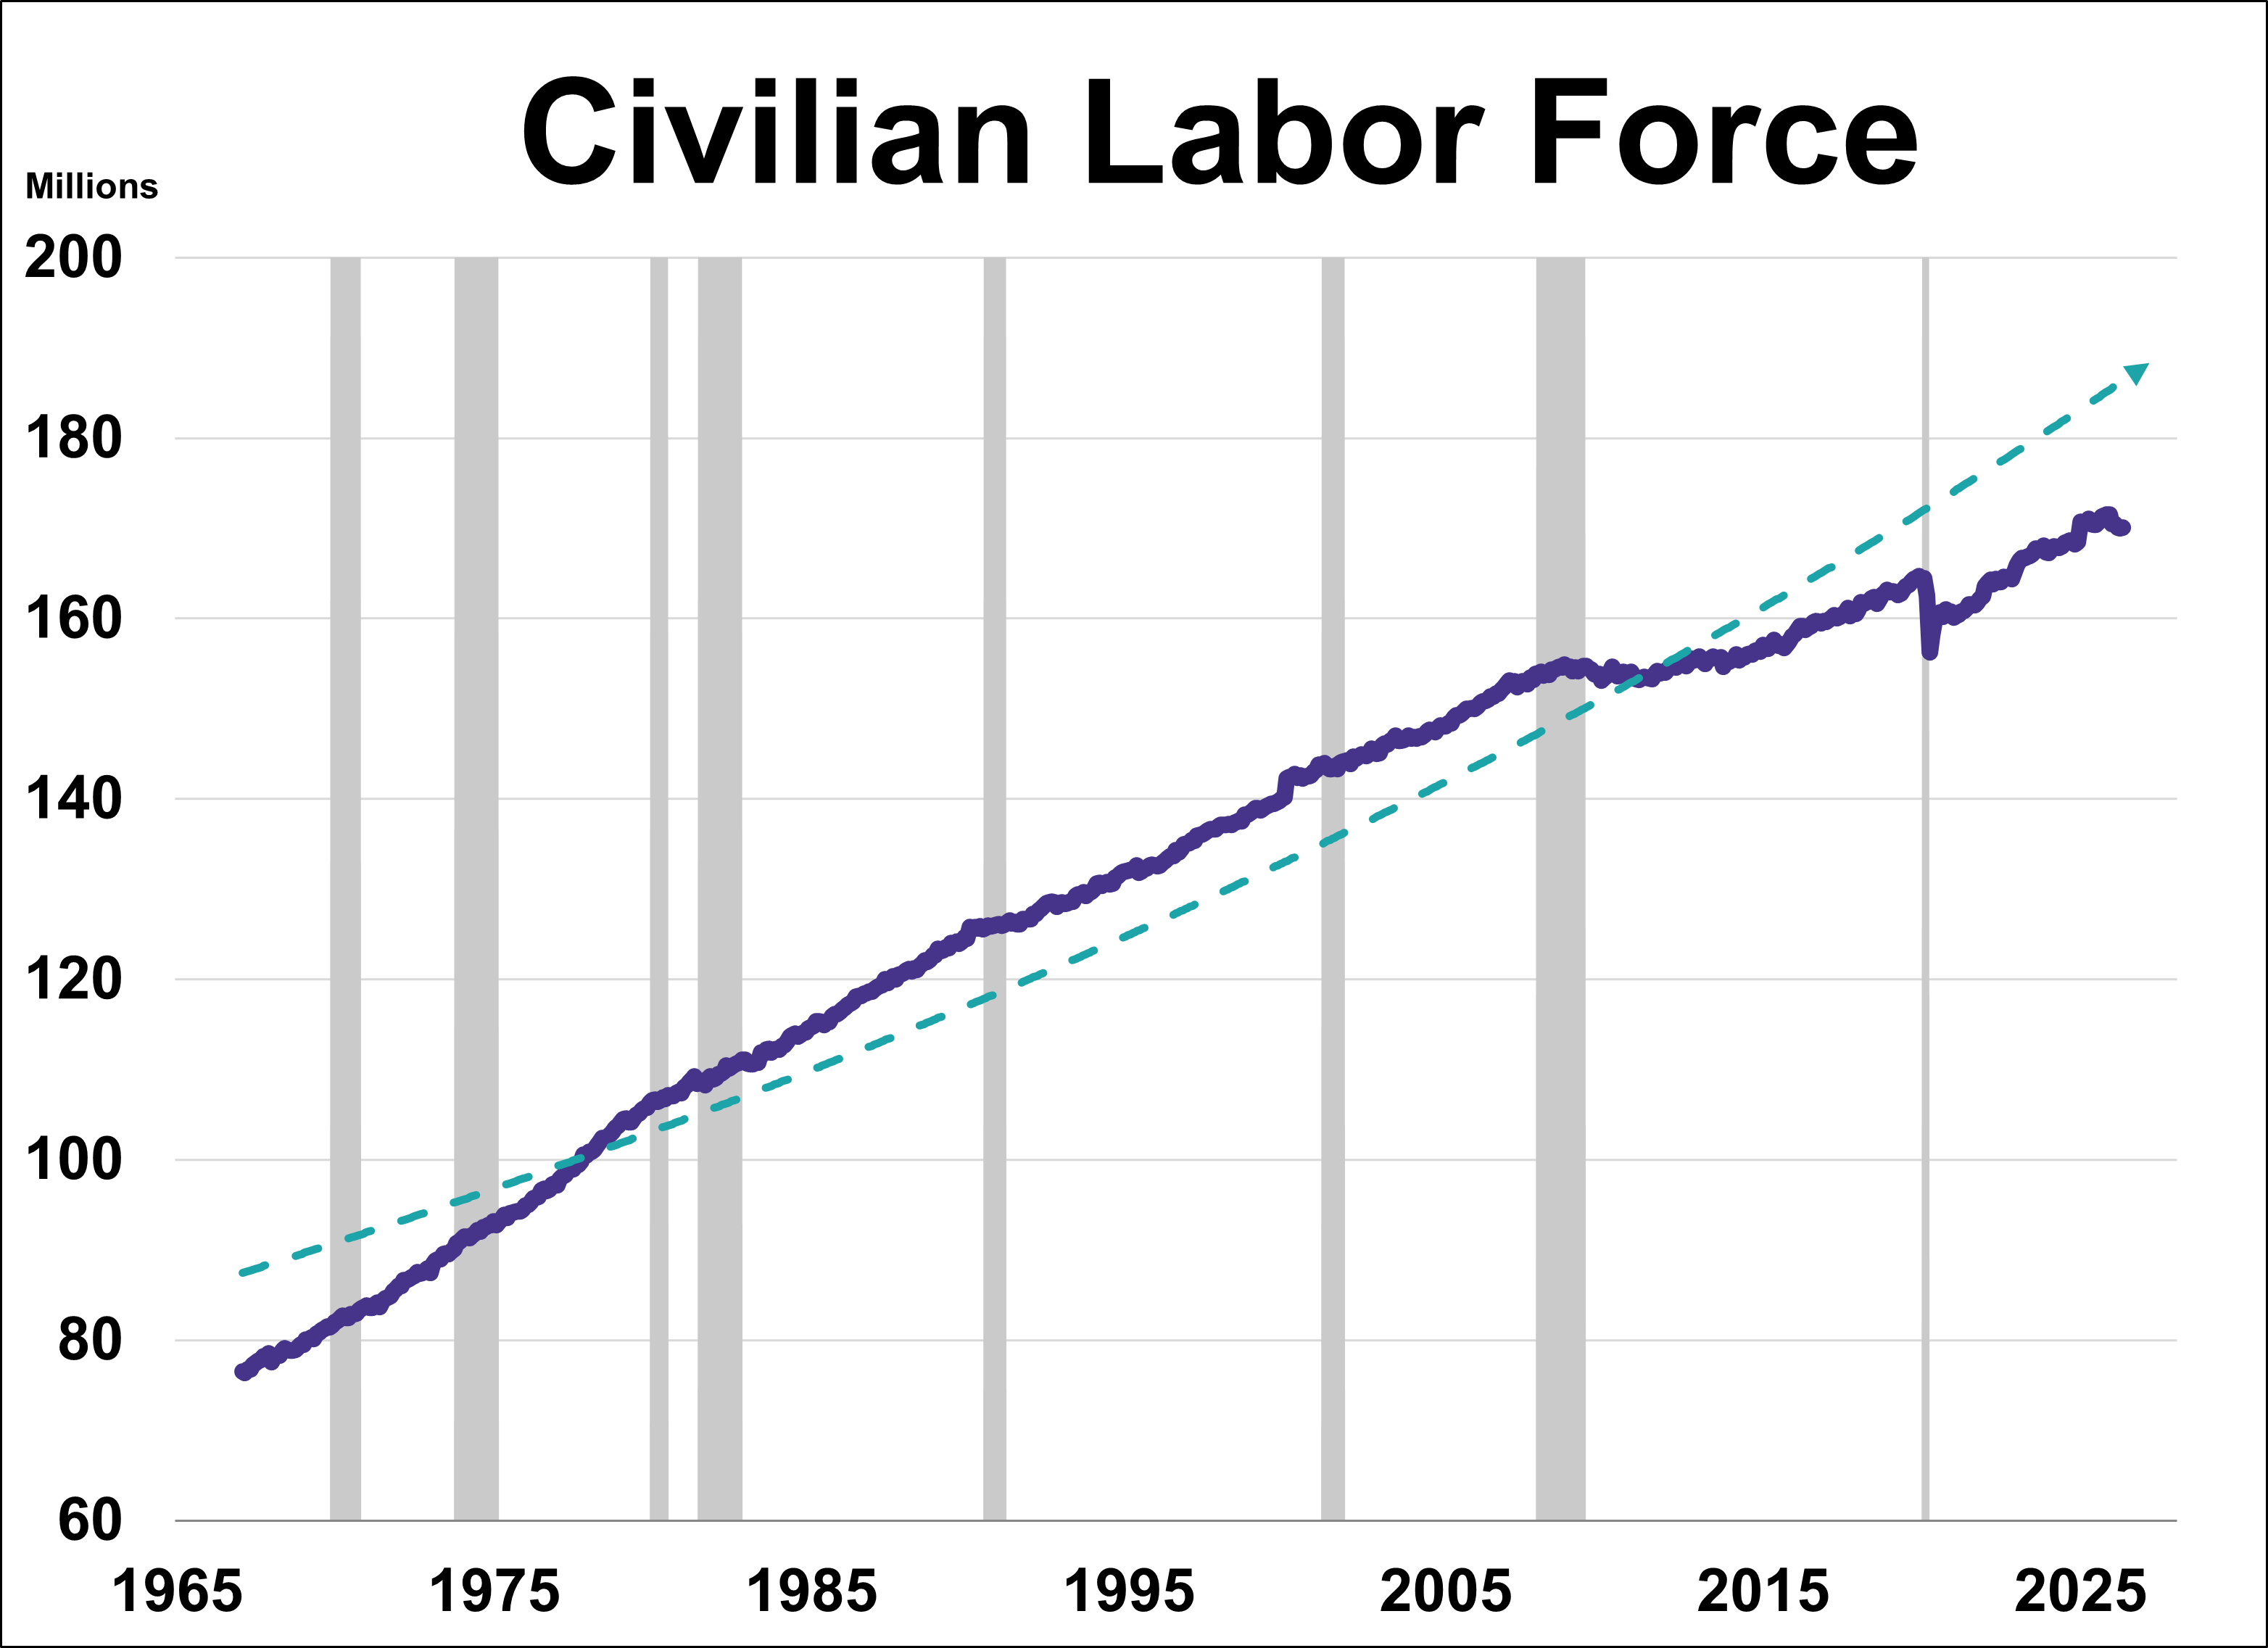
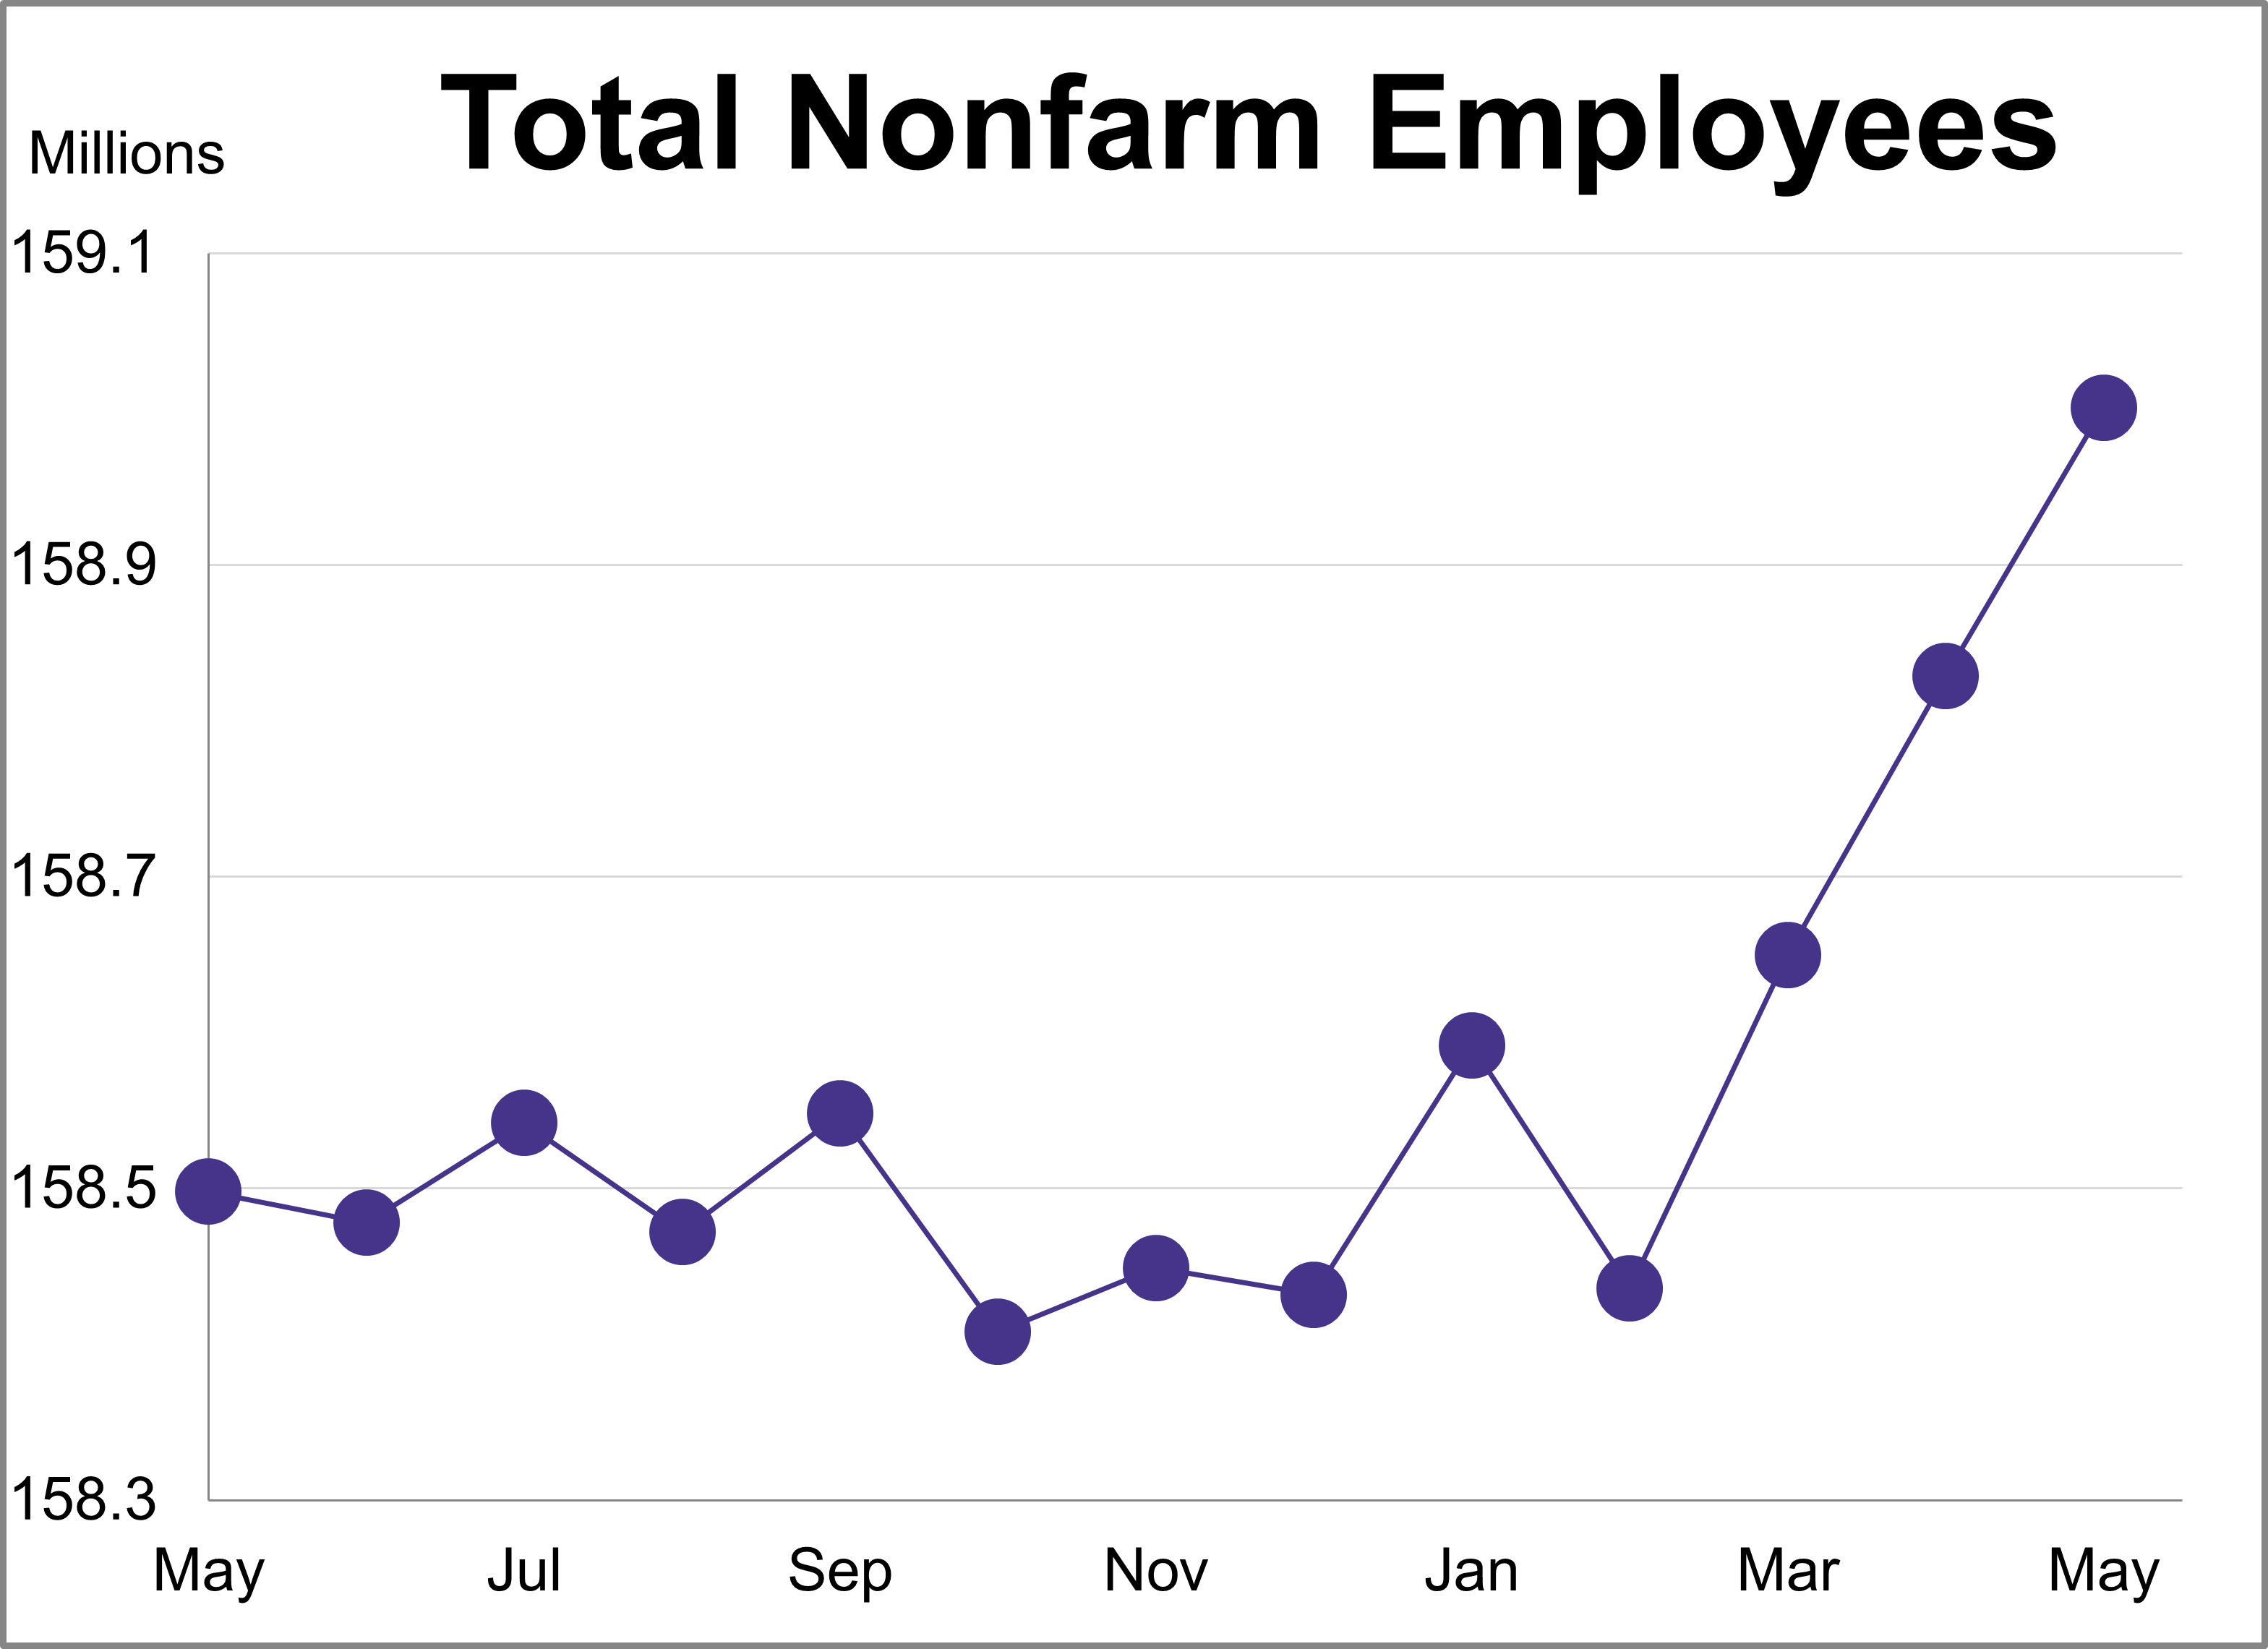
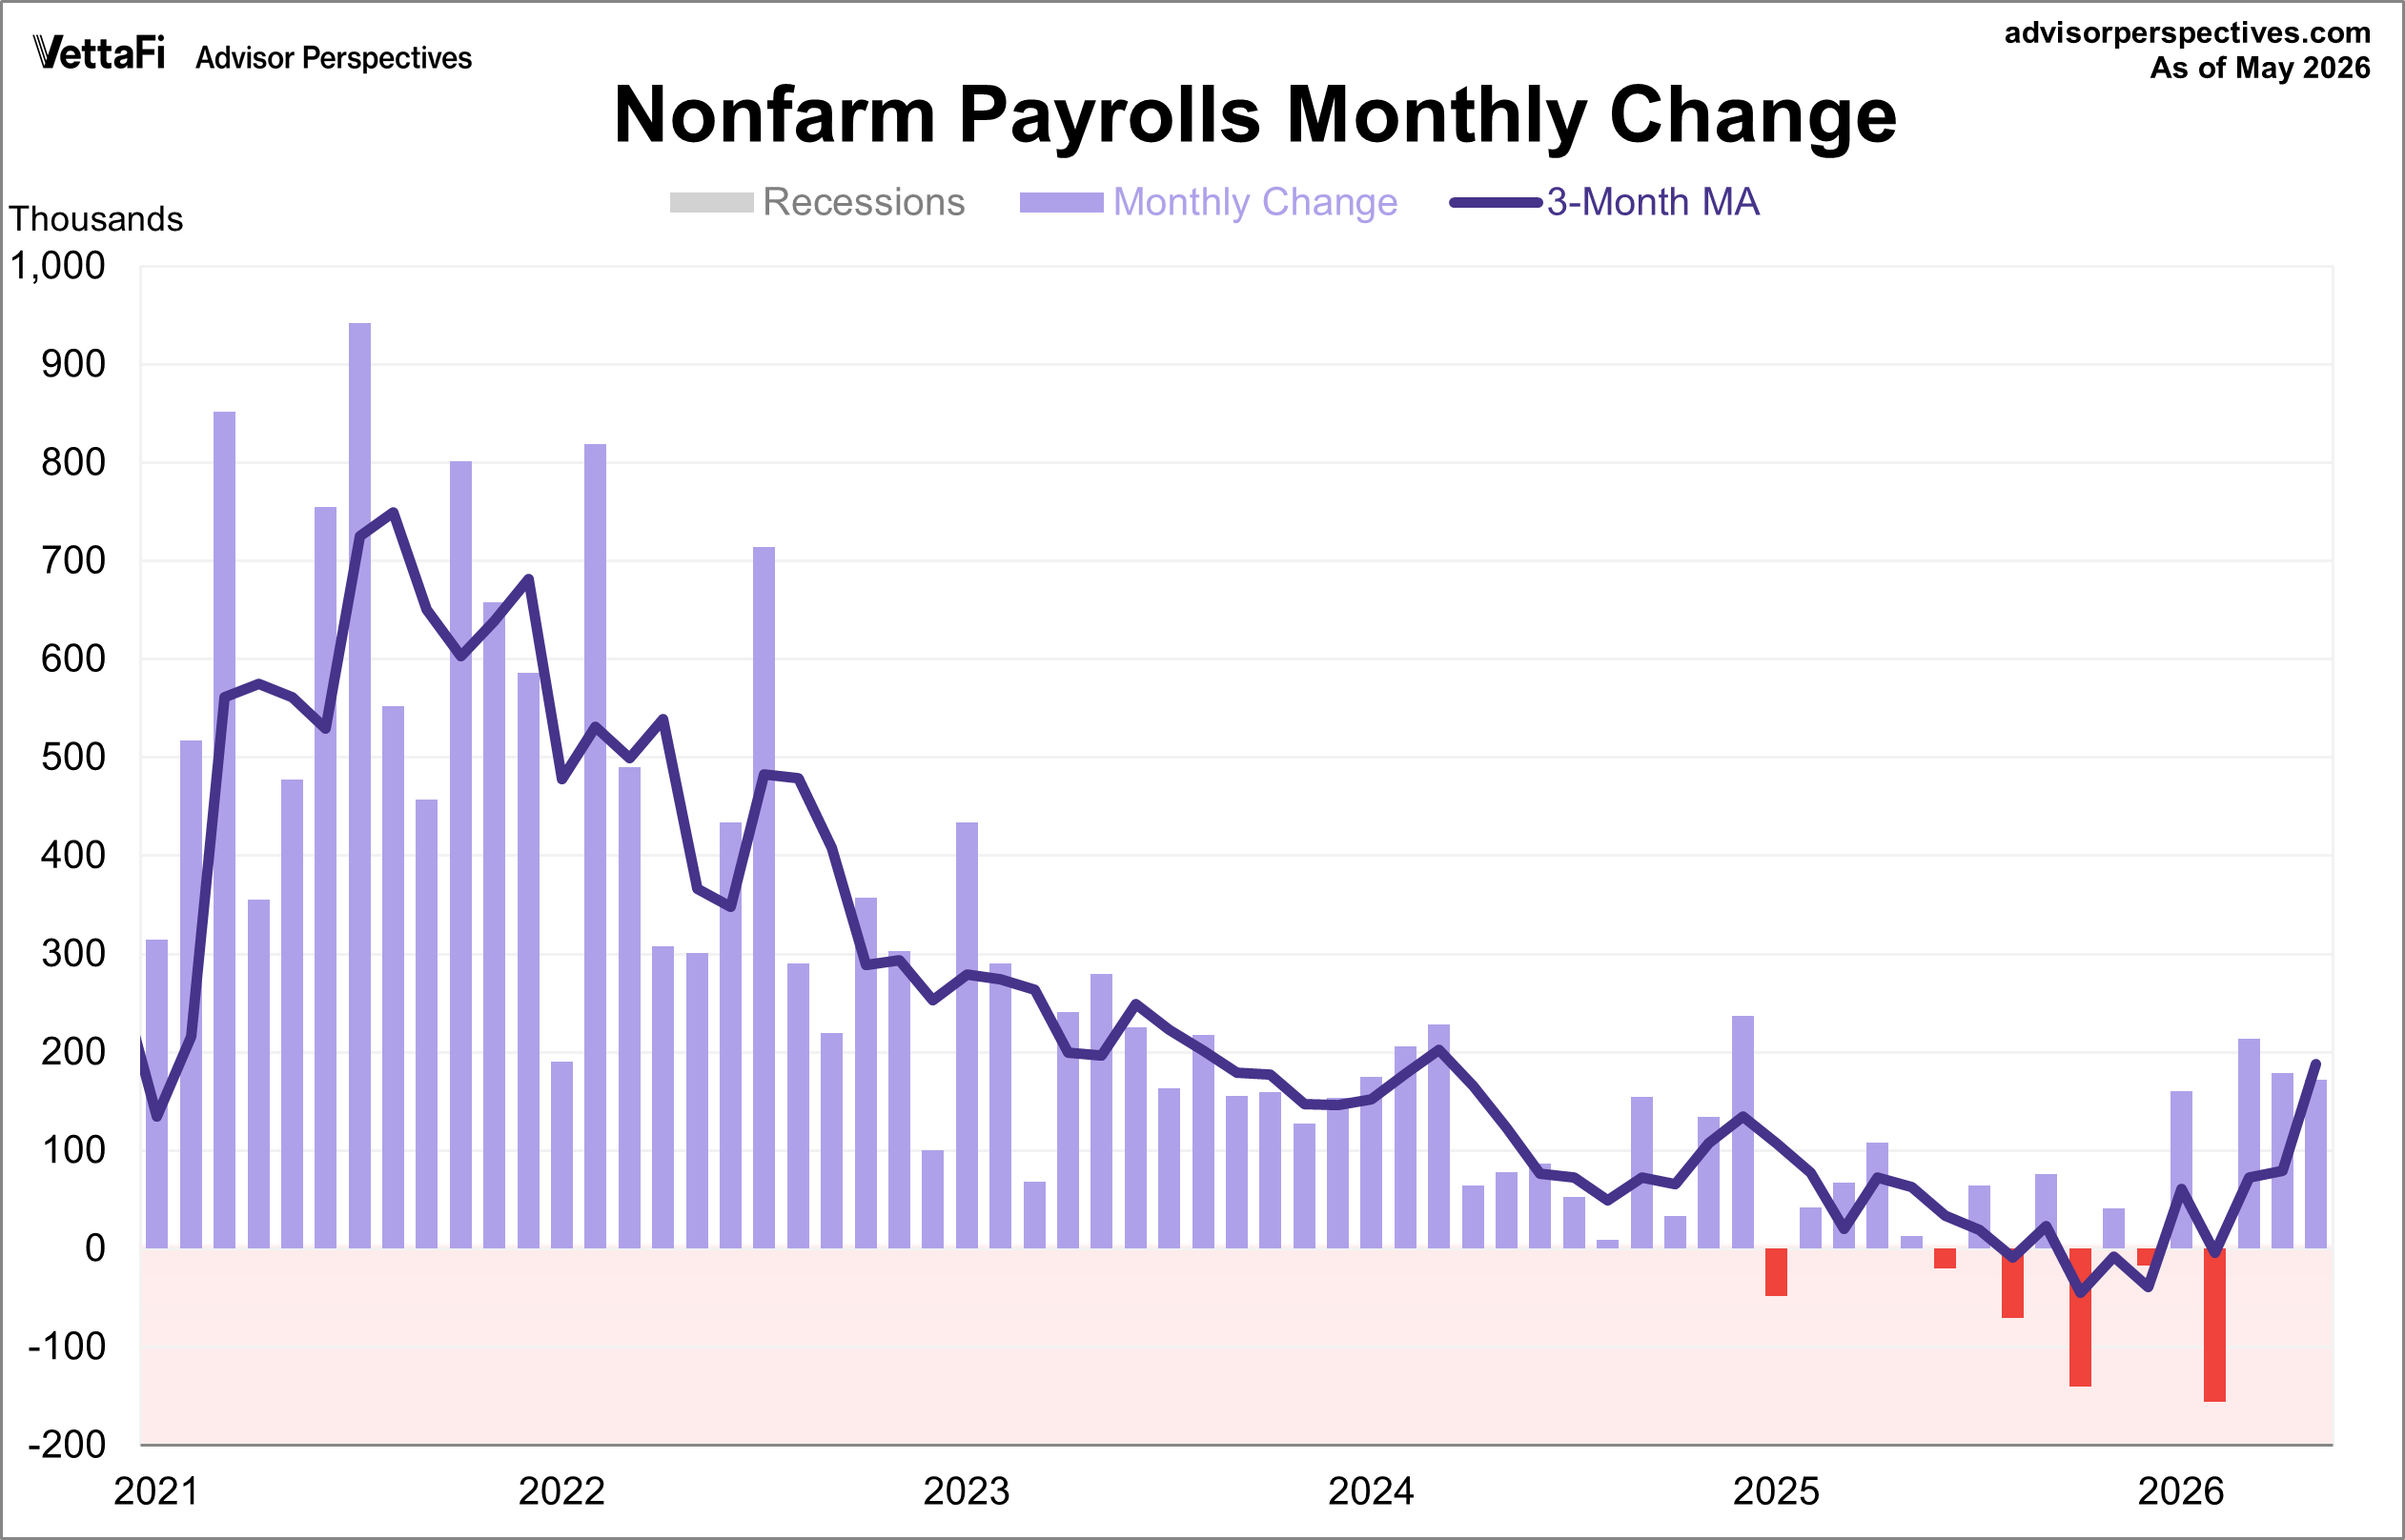
There is a general belief that there are four big indicators that the NBER Business Cycle Dating Committee weighs heavily in their cycle identification process. This commentary focuses on one of these indicators: nonfarm employment. In May, total nonfarm payrolls increased by 172,000 while the unemployment rate remained at 4.3%.
The latest employment report showed that 172,000 jobs were added in May, down slightly from April's 179,000 gain. This figure was more than double the projected addition of 85,000 jobs. Meanwhile, the unemployment rate remained at 4.3%, as expected.
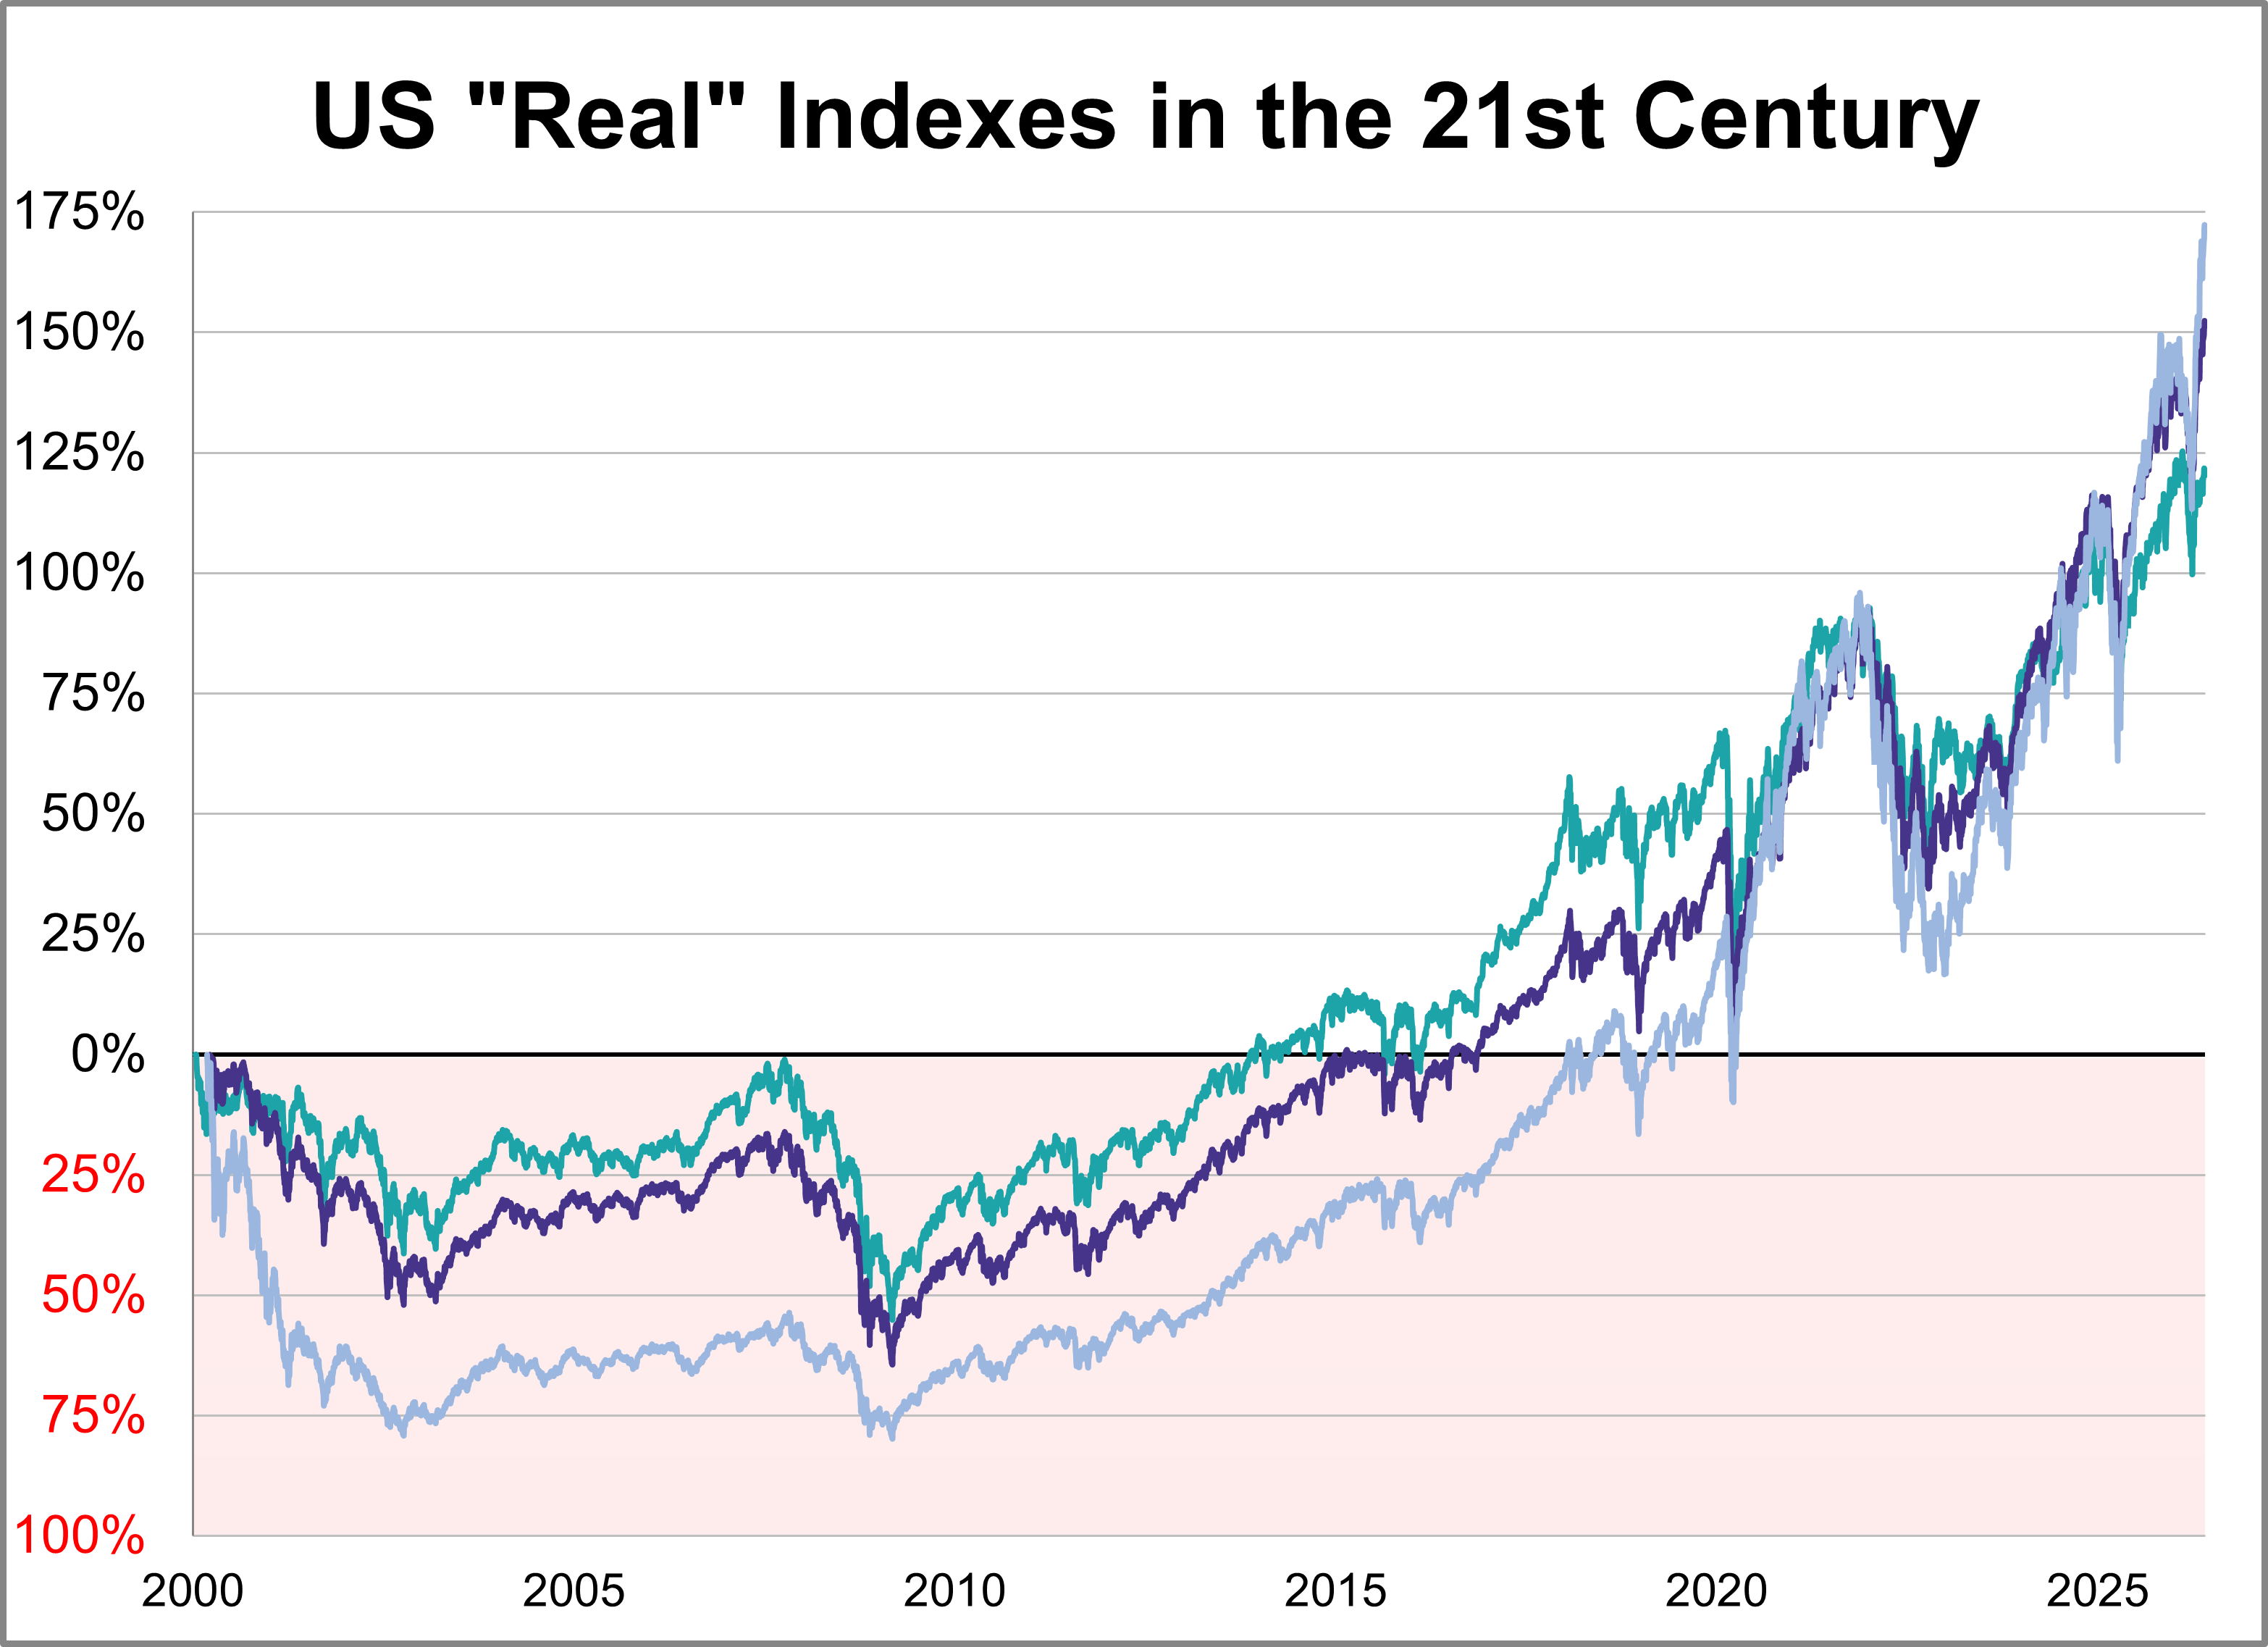
Here is a look at real (inflation-adjusted) charts of the S&P 500, Dow 30, and Nasdaq composite since their 2000 highs. We've updated this through the May 2026 close.
Here's an interesting set of charts that will especially resonate with those of us who follow economic and market cycles. Imagine that five years ago you invested $10,000 in the S&P 500. How much would it be worth today, with dividends reinvested but adjusted for inflation?
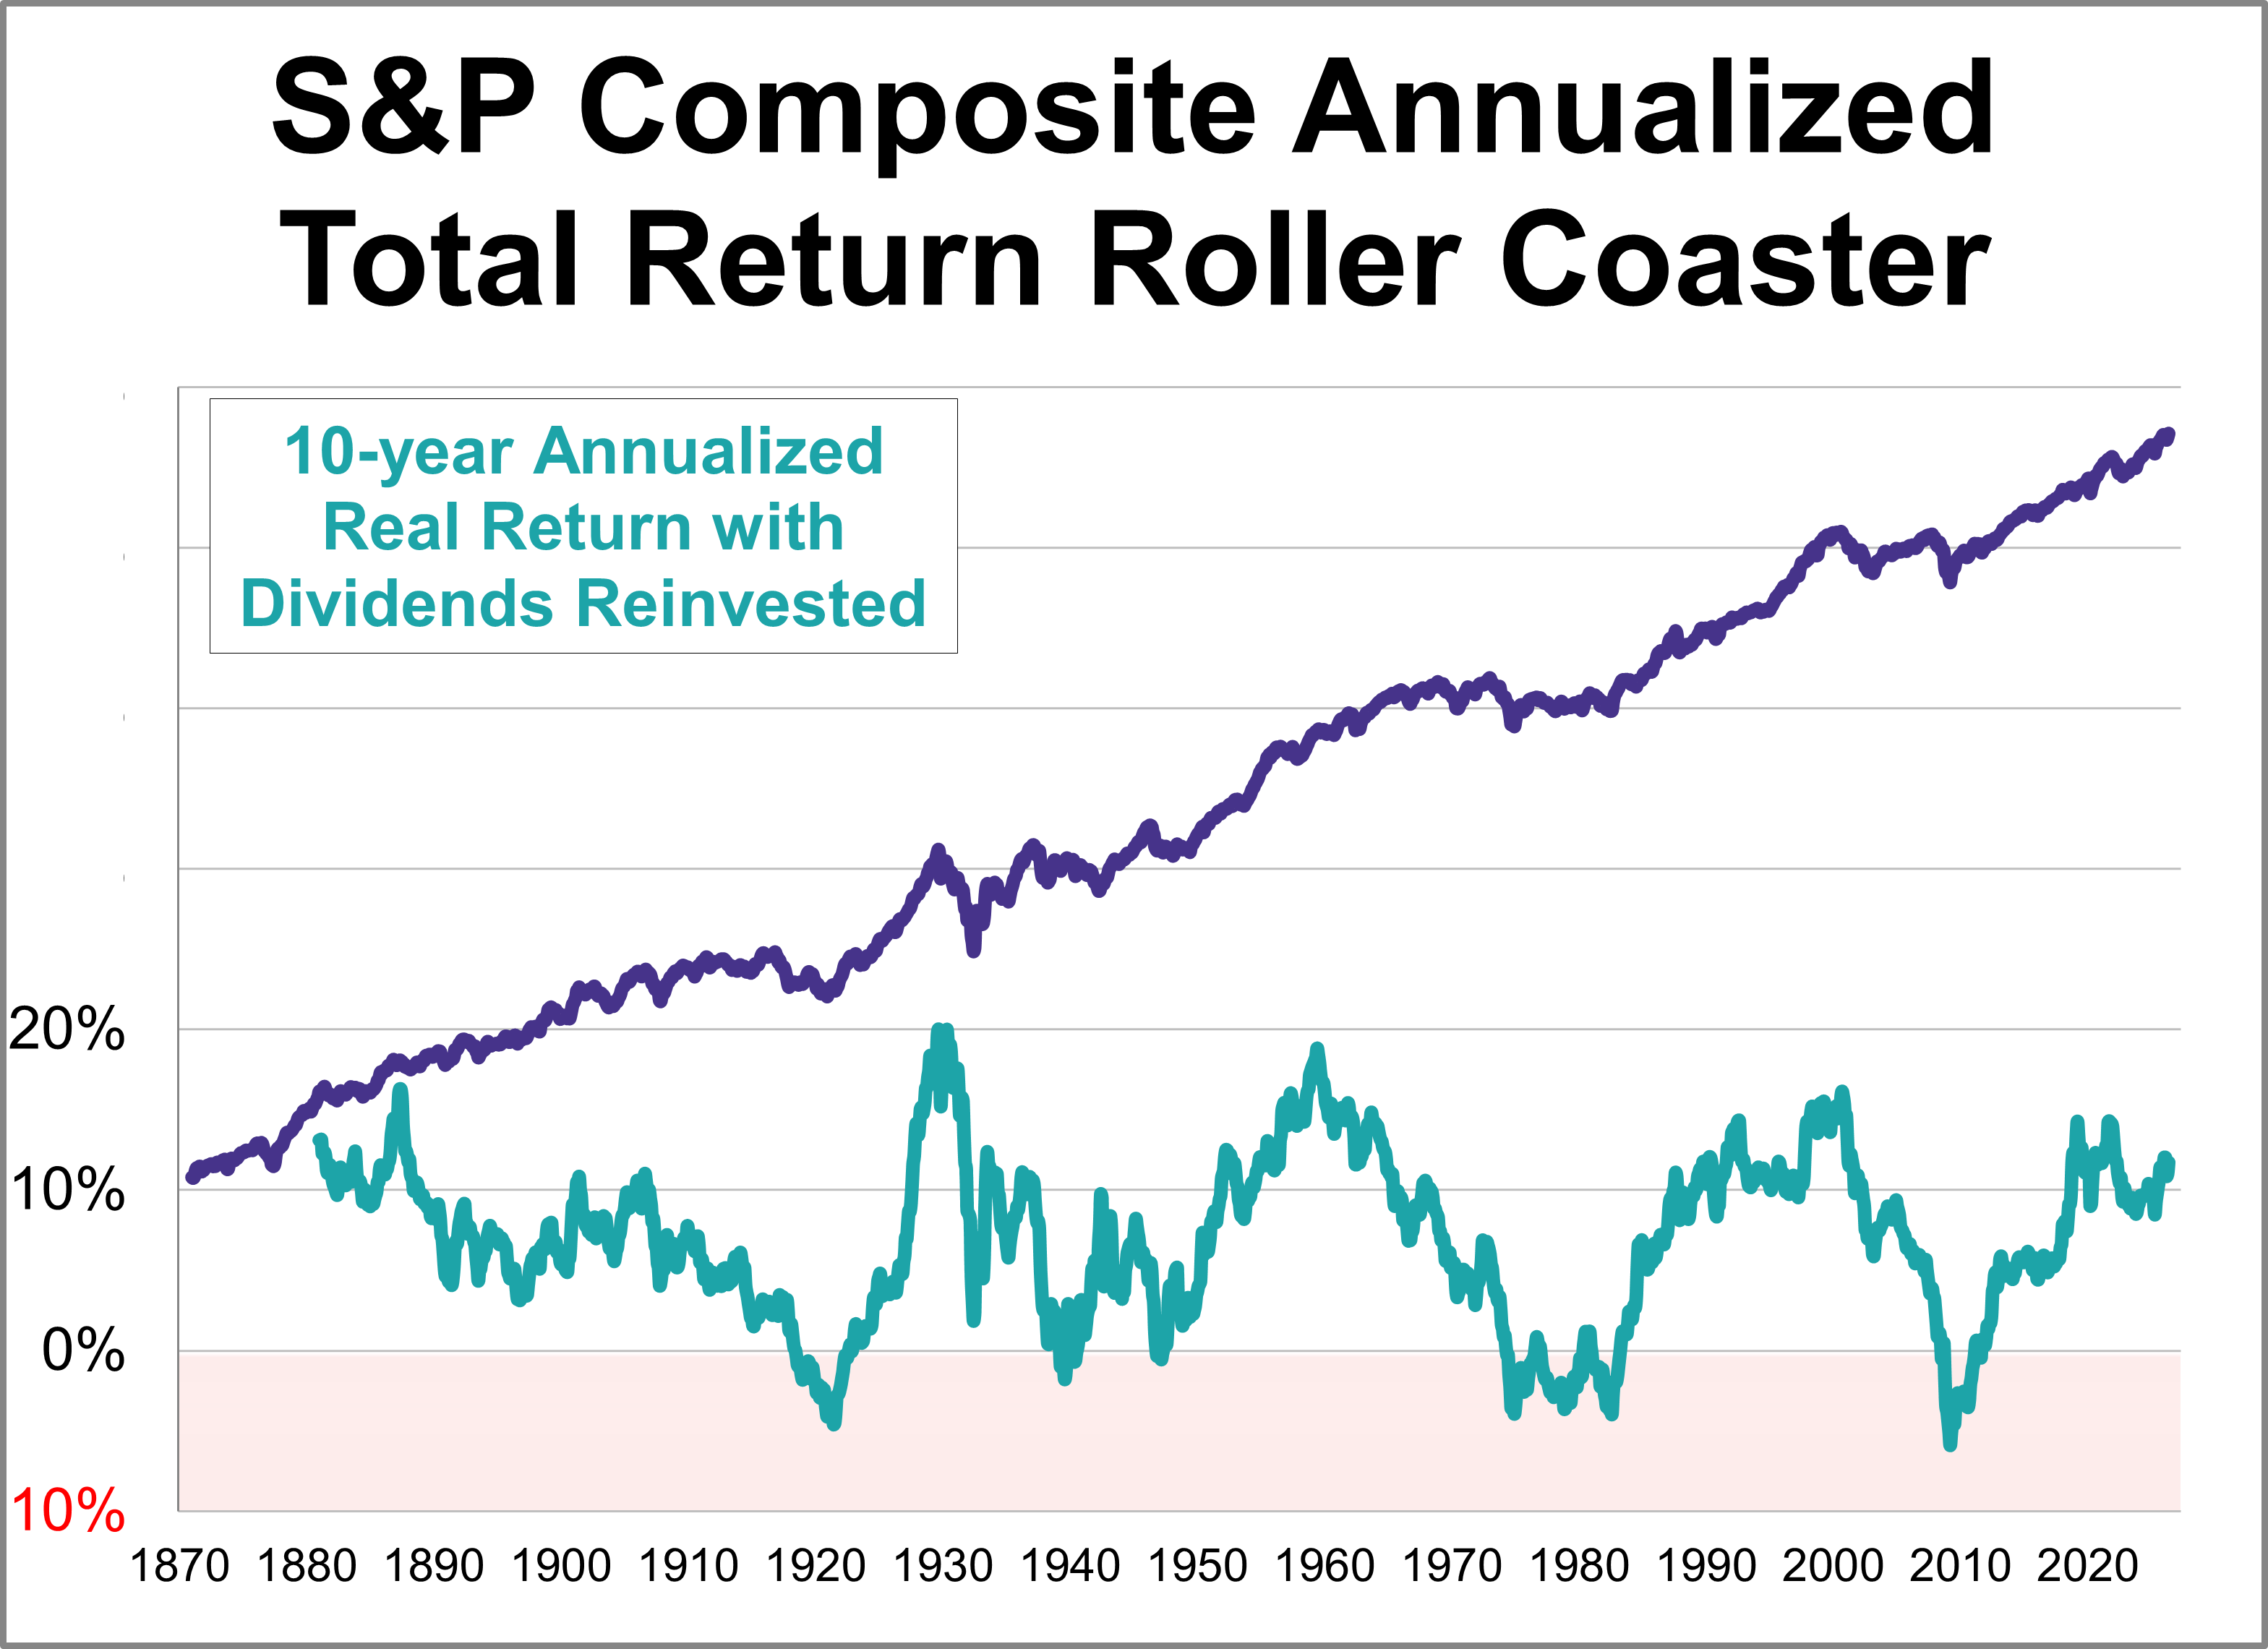
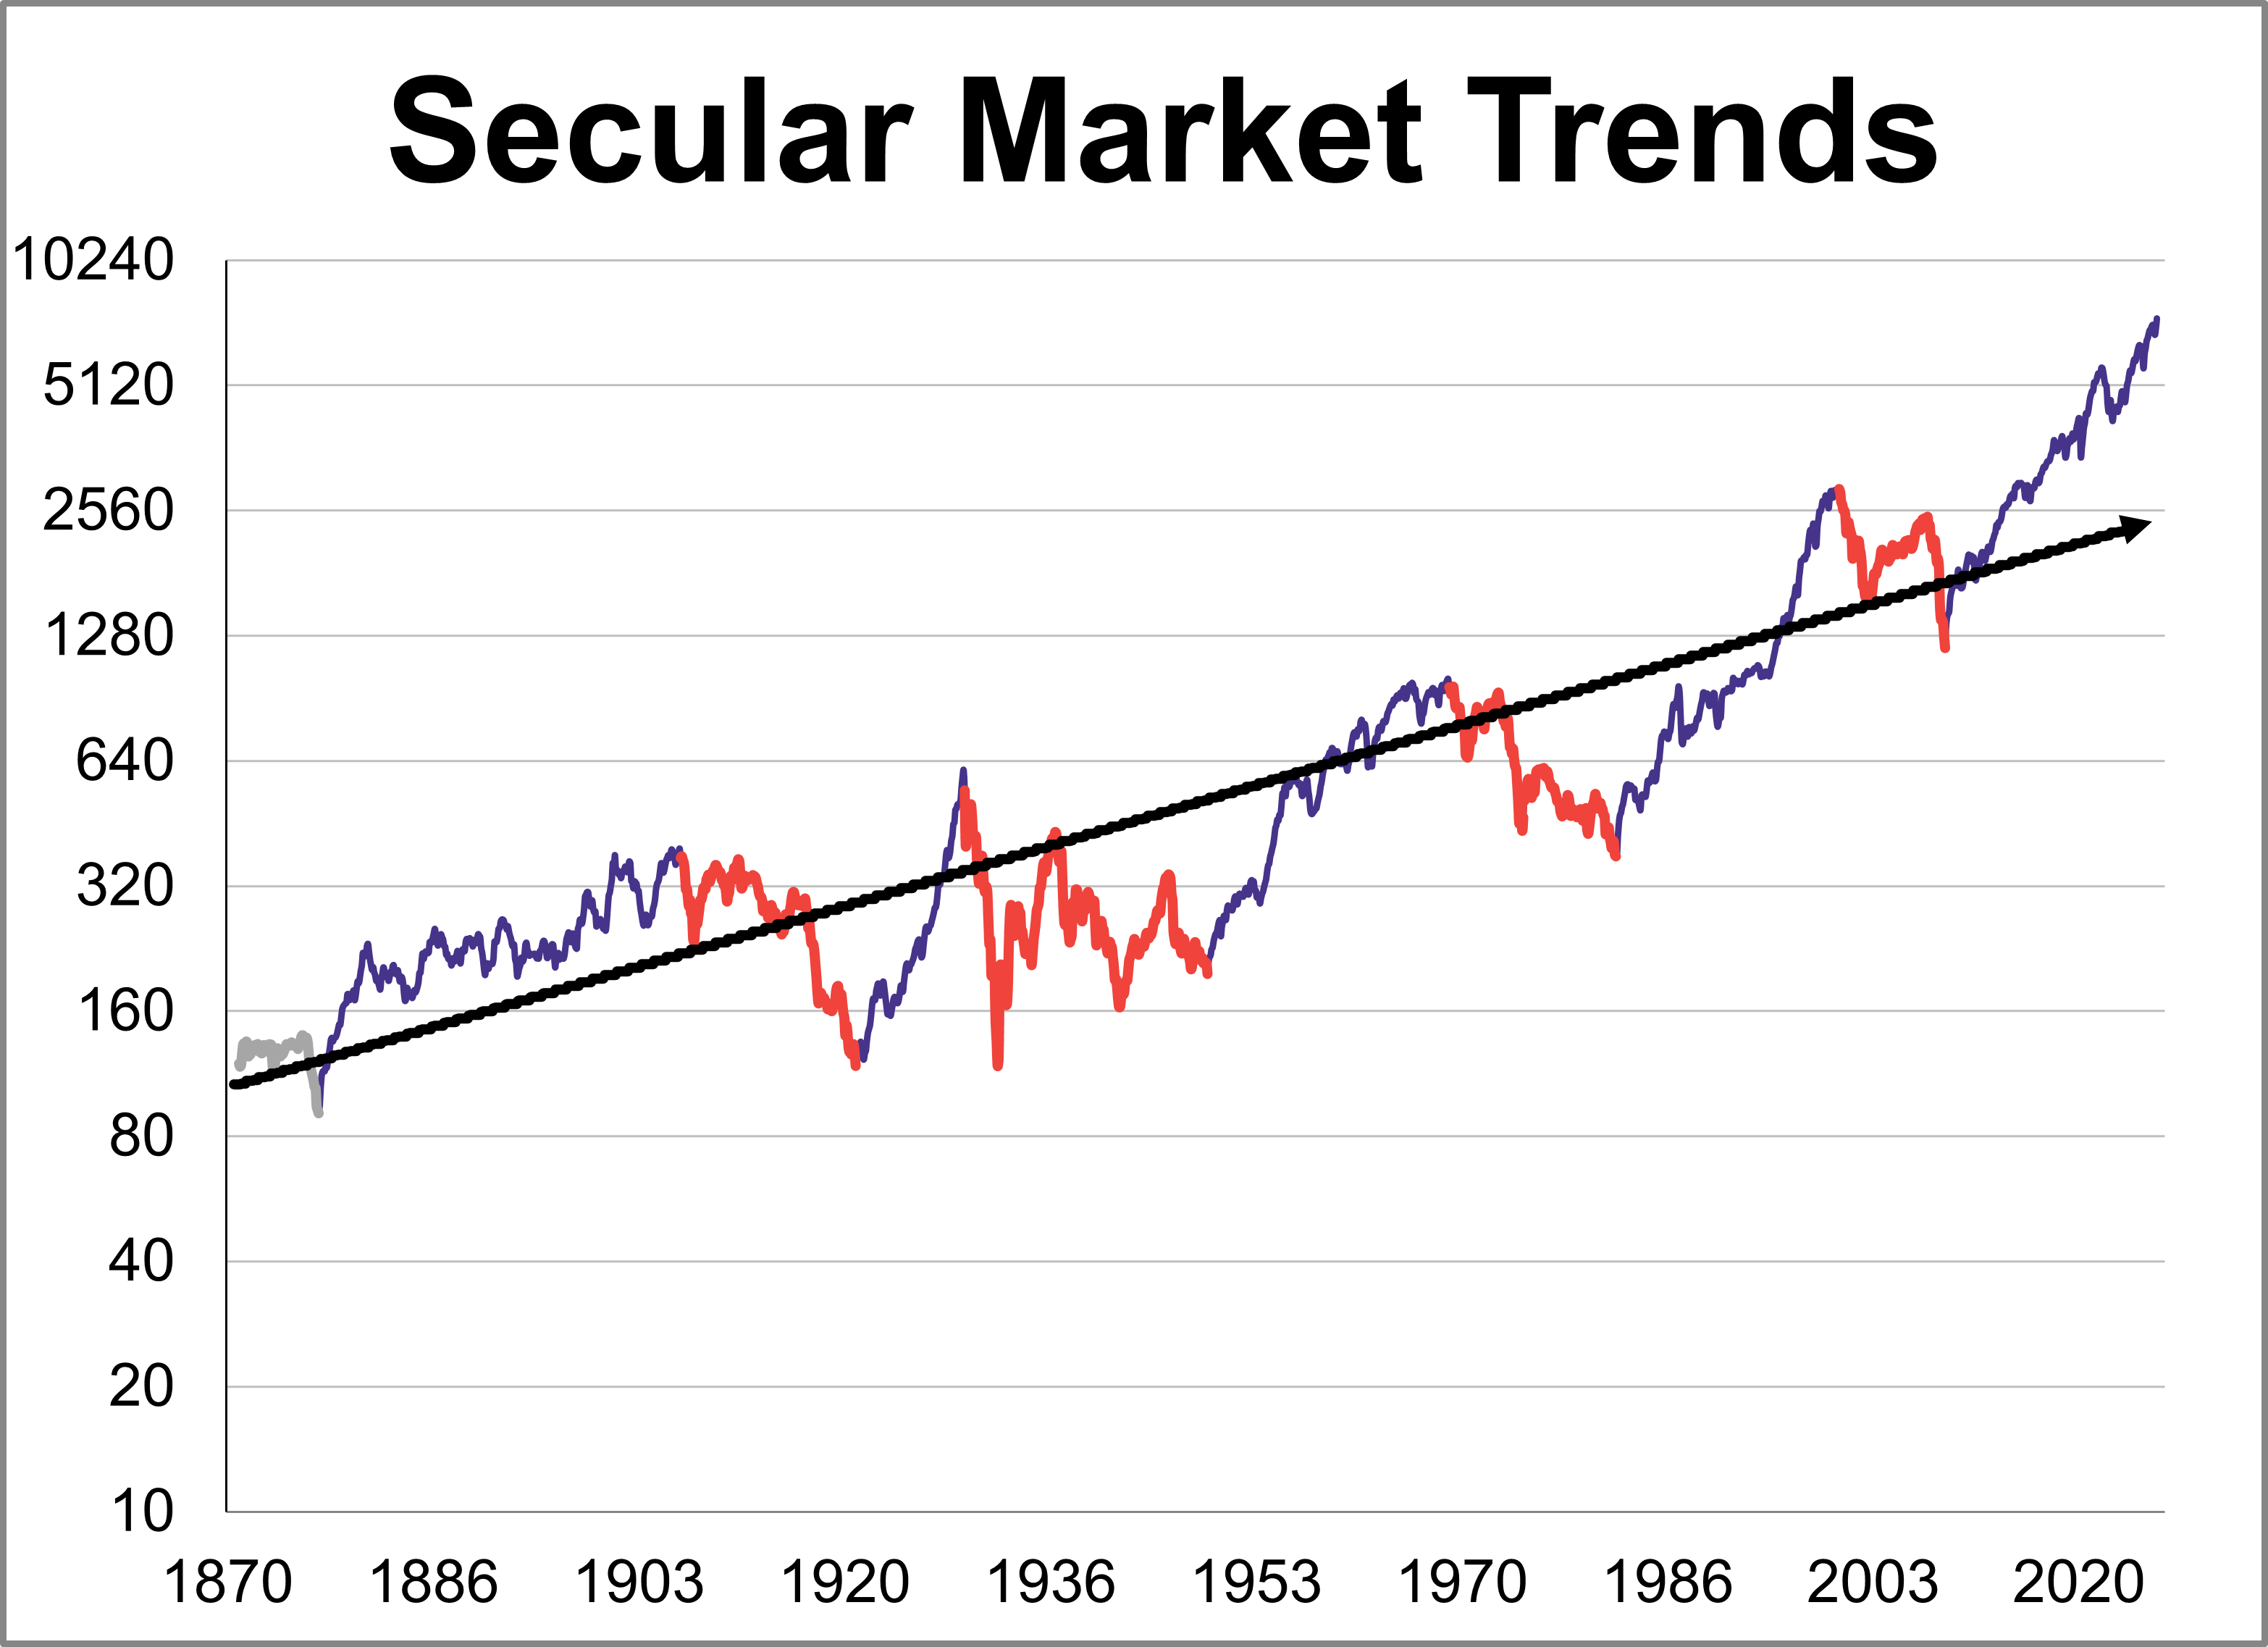
The S&P 500 real monthly averages of daily closes reached a its all-time high in May 2026. Let's examine the past to broaden our understanding of the range of historical bull and bear market trends in market performance.
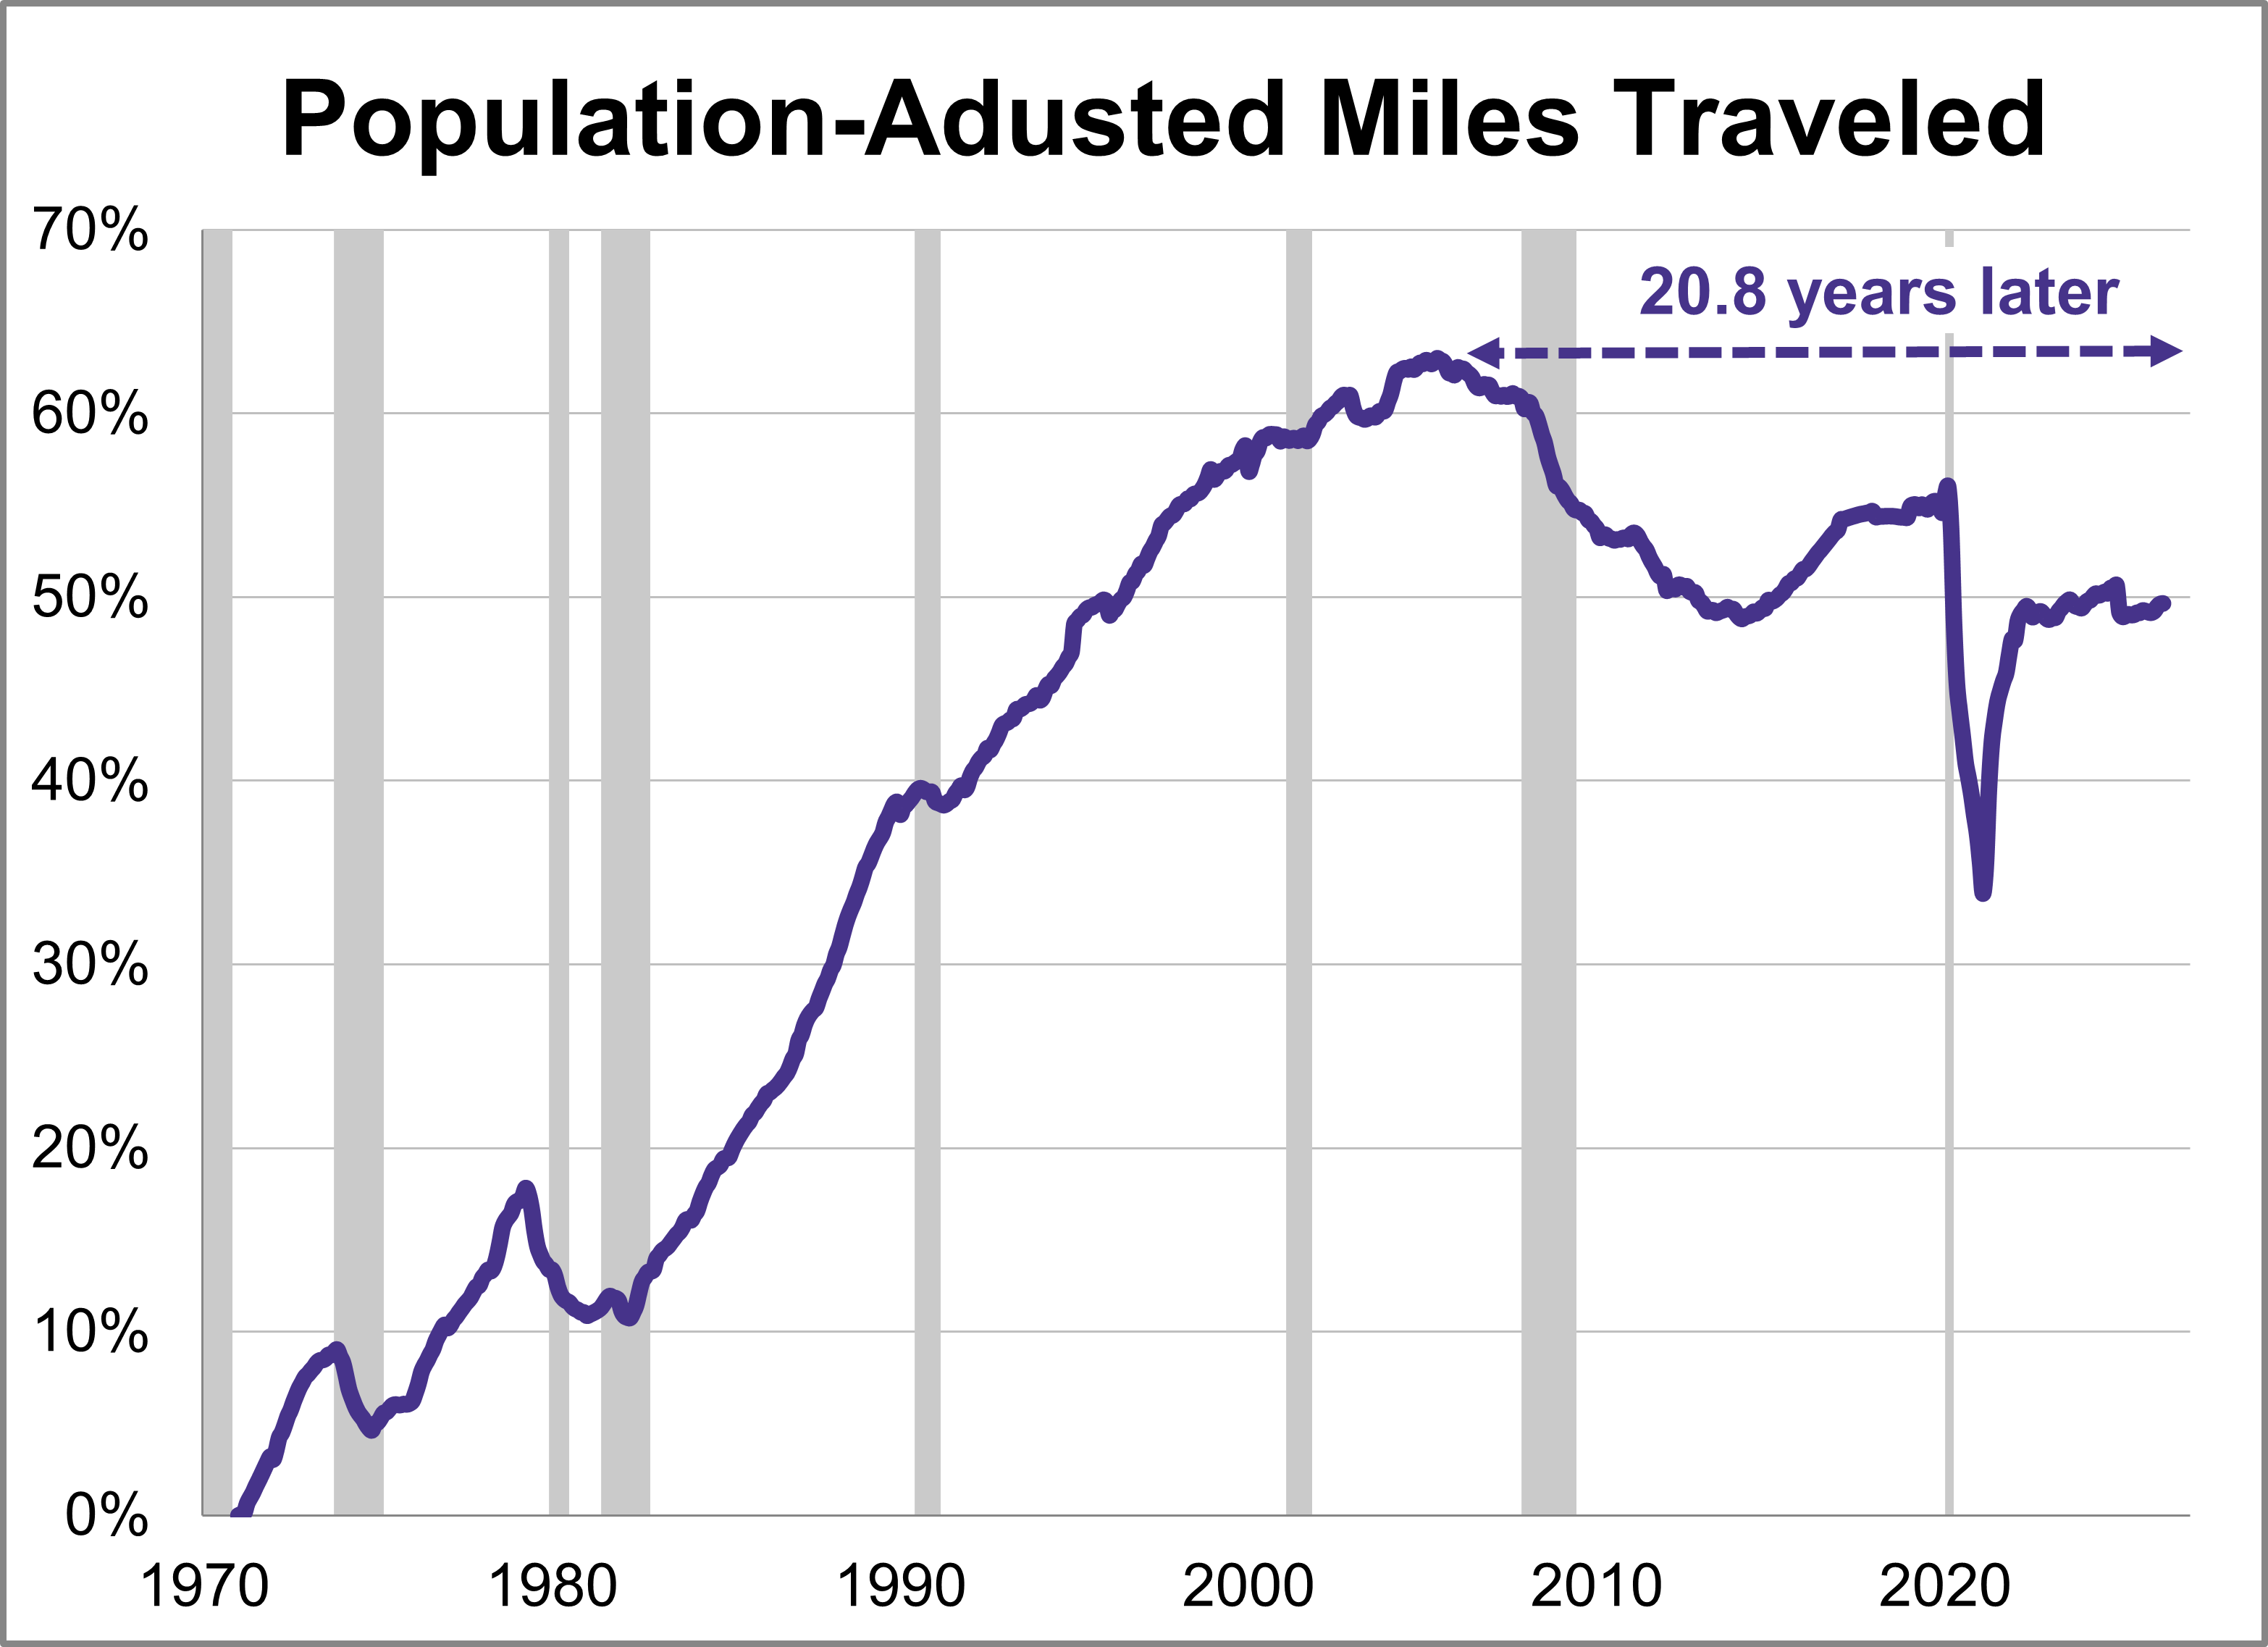
Travel on all roads and streets increased in April. The 12-month moving average was up 0.05% month-over-month and was up 1.04% year-over-year. However, if we factor in population growth, the 12-month MA of the civilian population-adjusted data (age 16-and-over) was up 0.02% month-over-month and up 0.40% year-over-year.
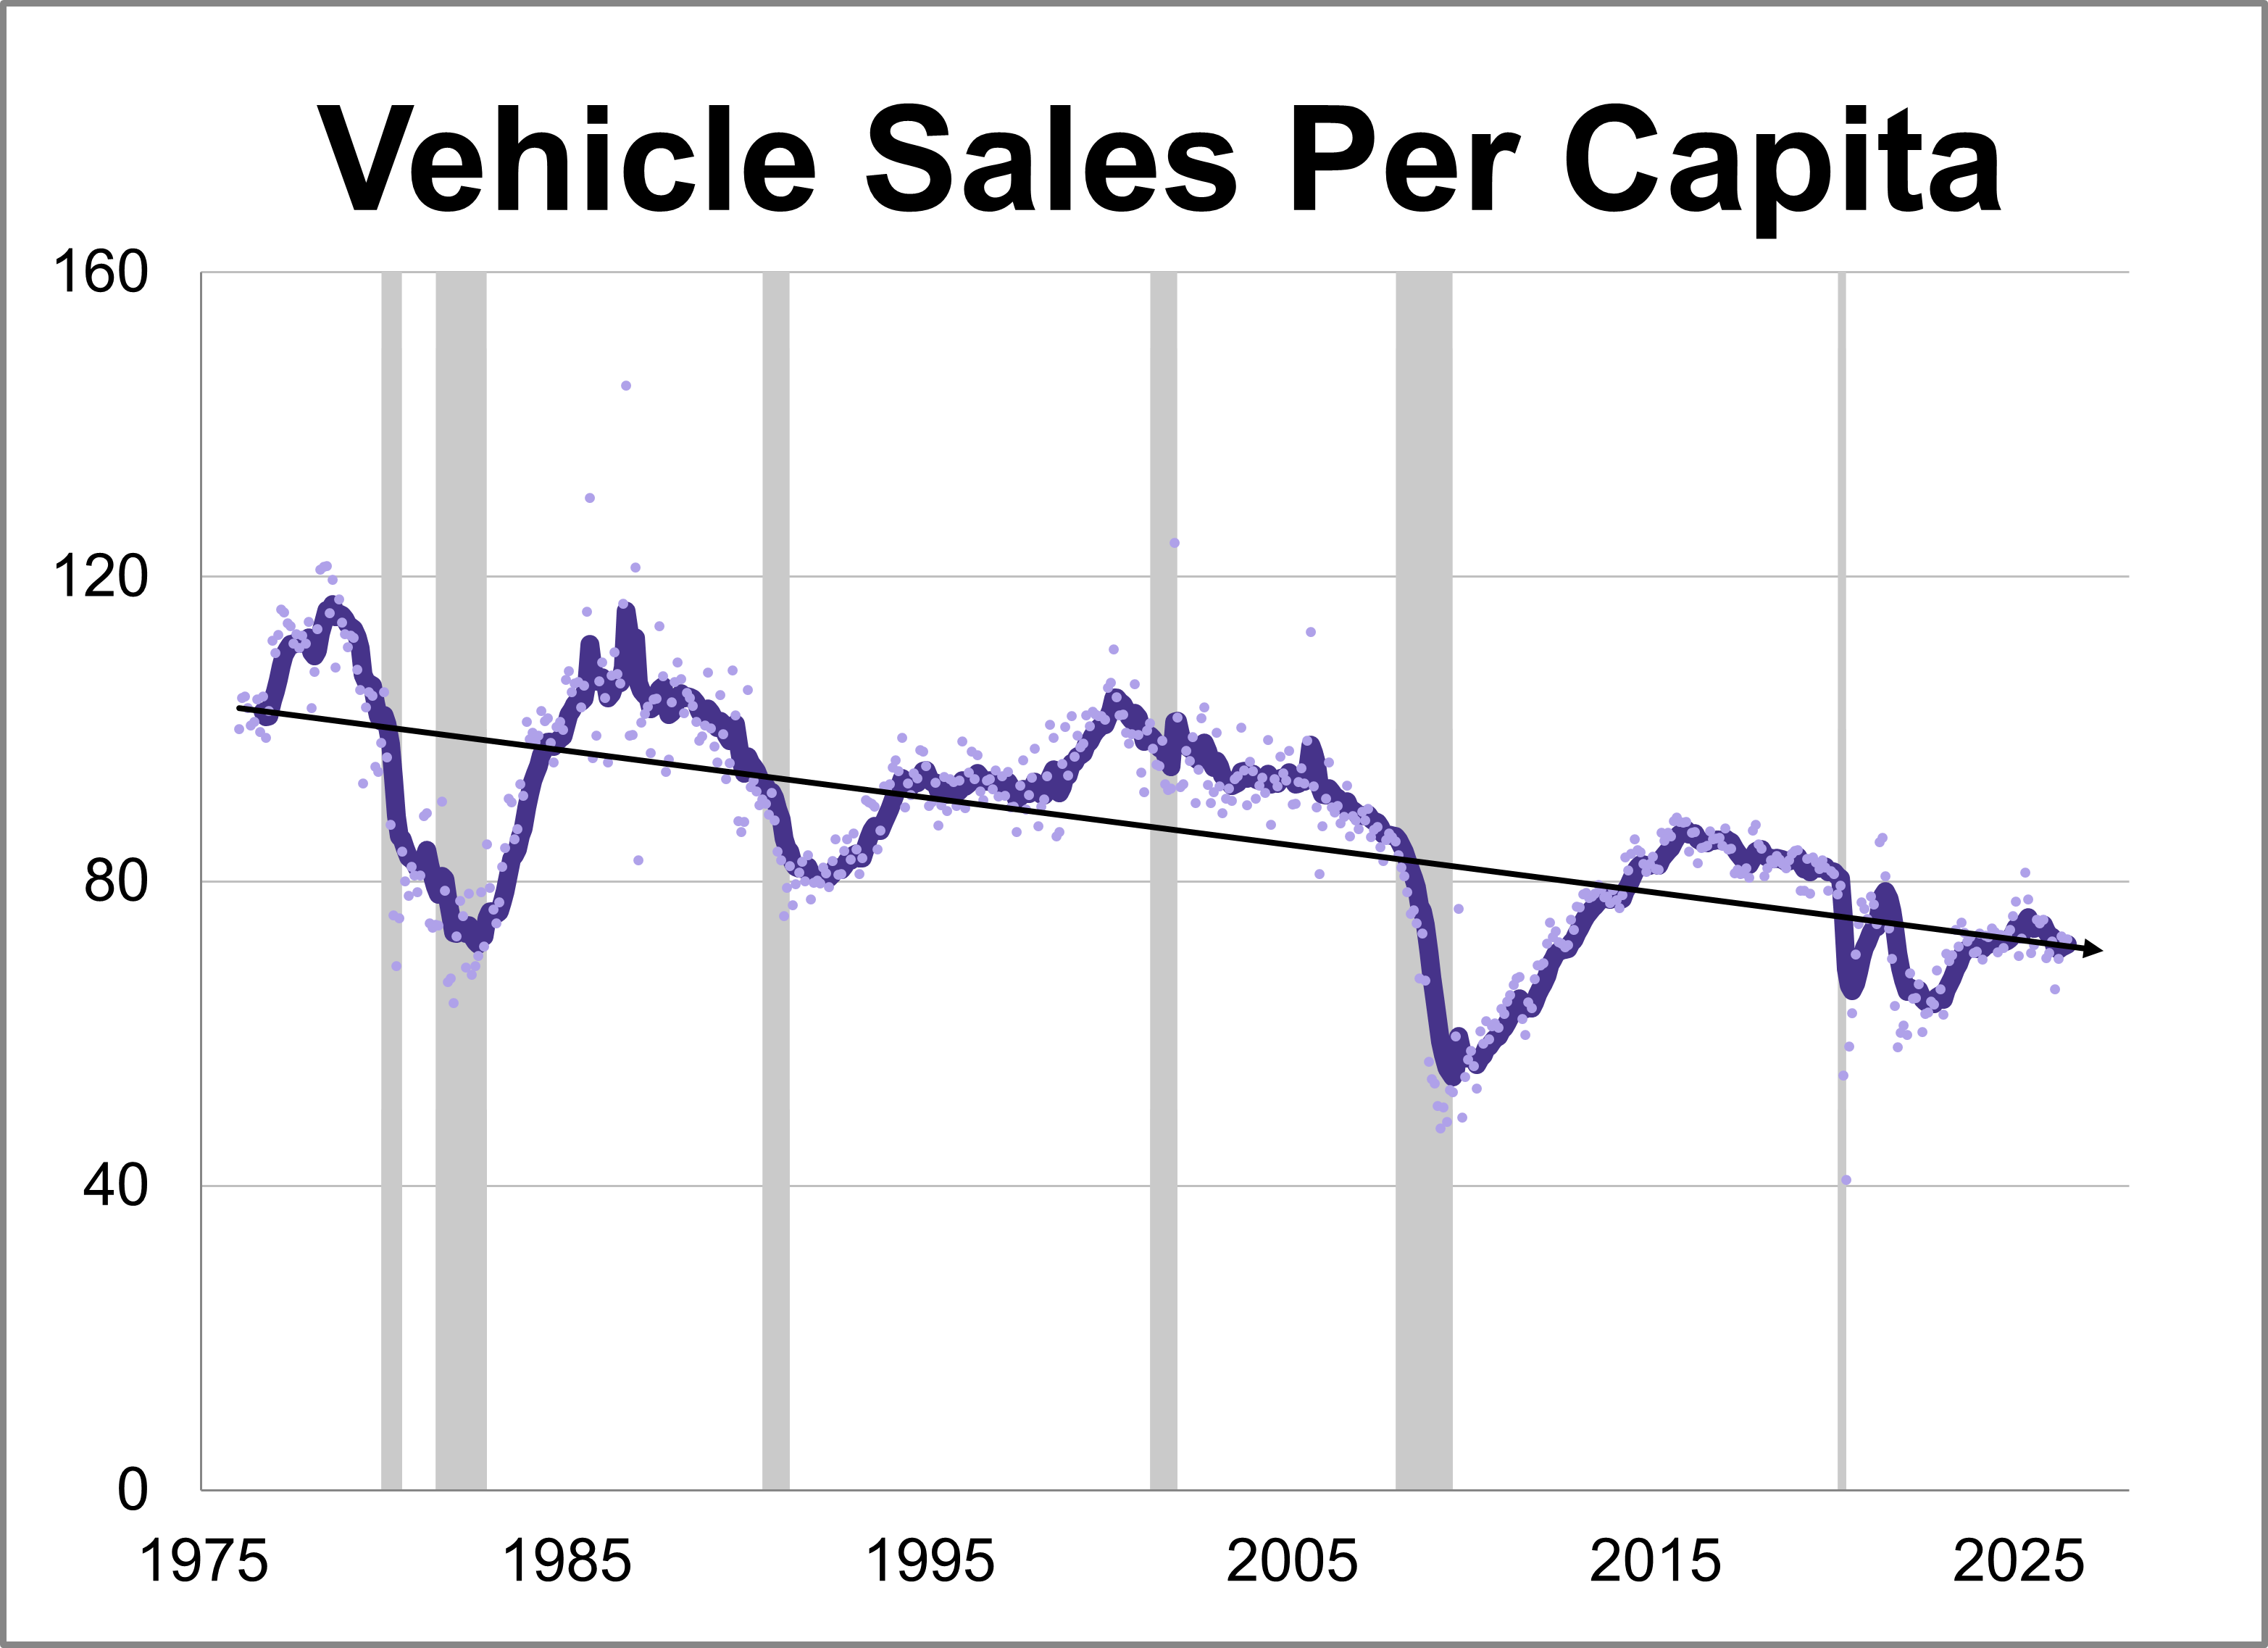
Vehicle sales inched up in May, coming in at a seasonally adjusted annual rate of 16.083 million units. This represents a 0.4% increase from the previous month and a 3.2% rise from one year ago.
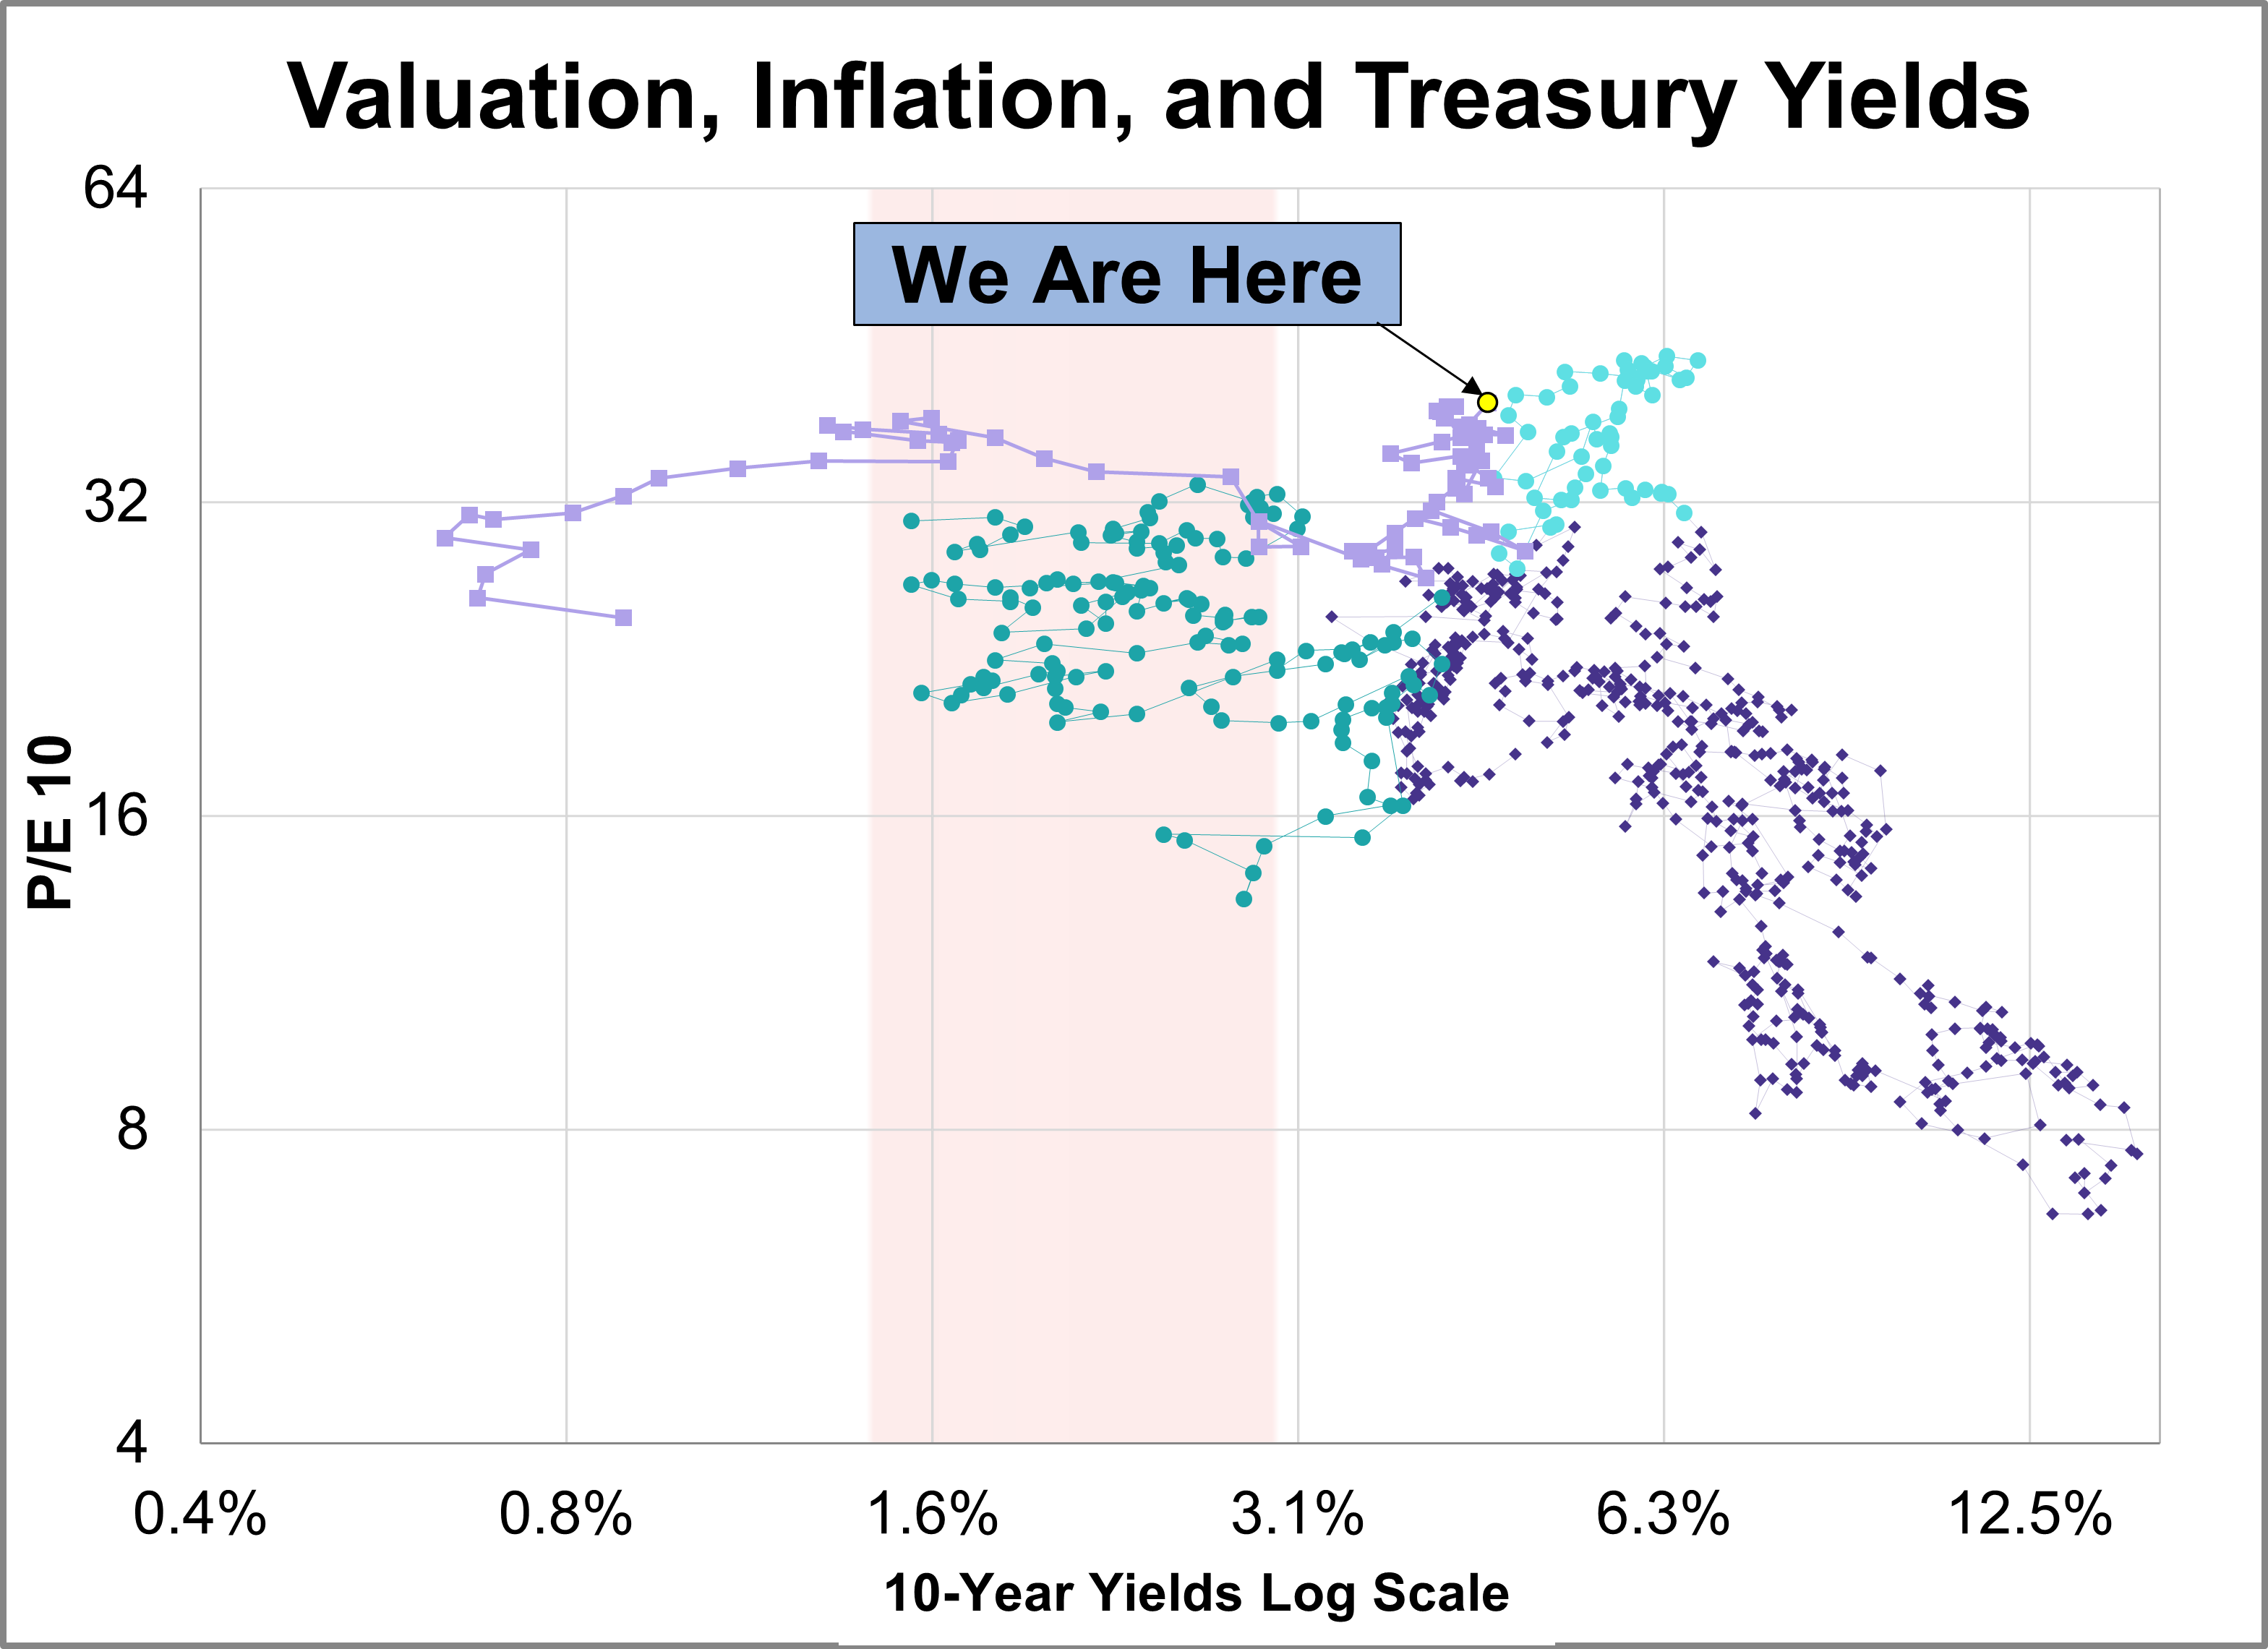
Our monthly market valuation updates have long had the same conclusion: US stock indexes are significantly overvalued, which suggests cautious expectations for investment returns. This analysis focuses on the P/E10 ratio, key indicator of market valuation, and its correlation with inflation and the 10-year Treasury yield.
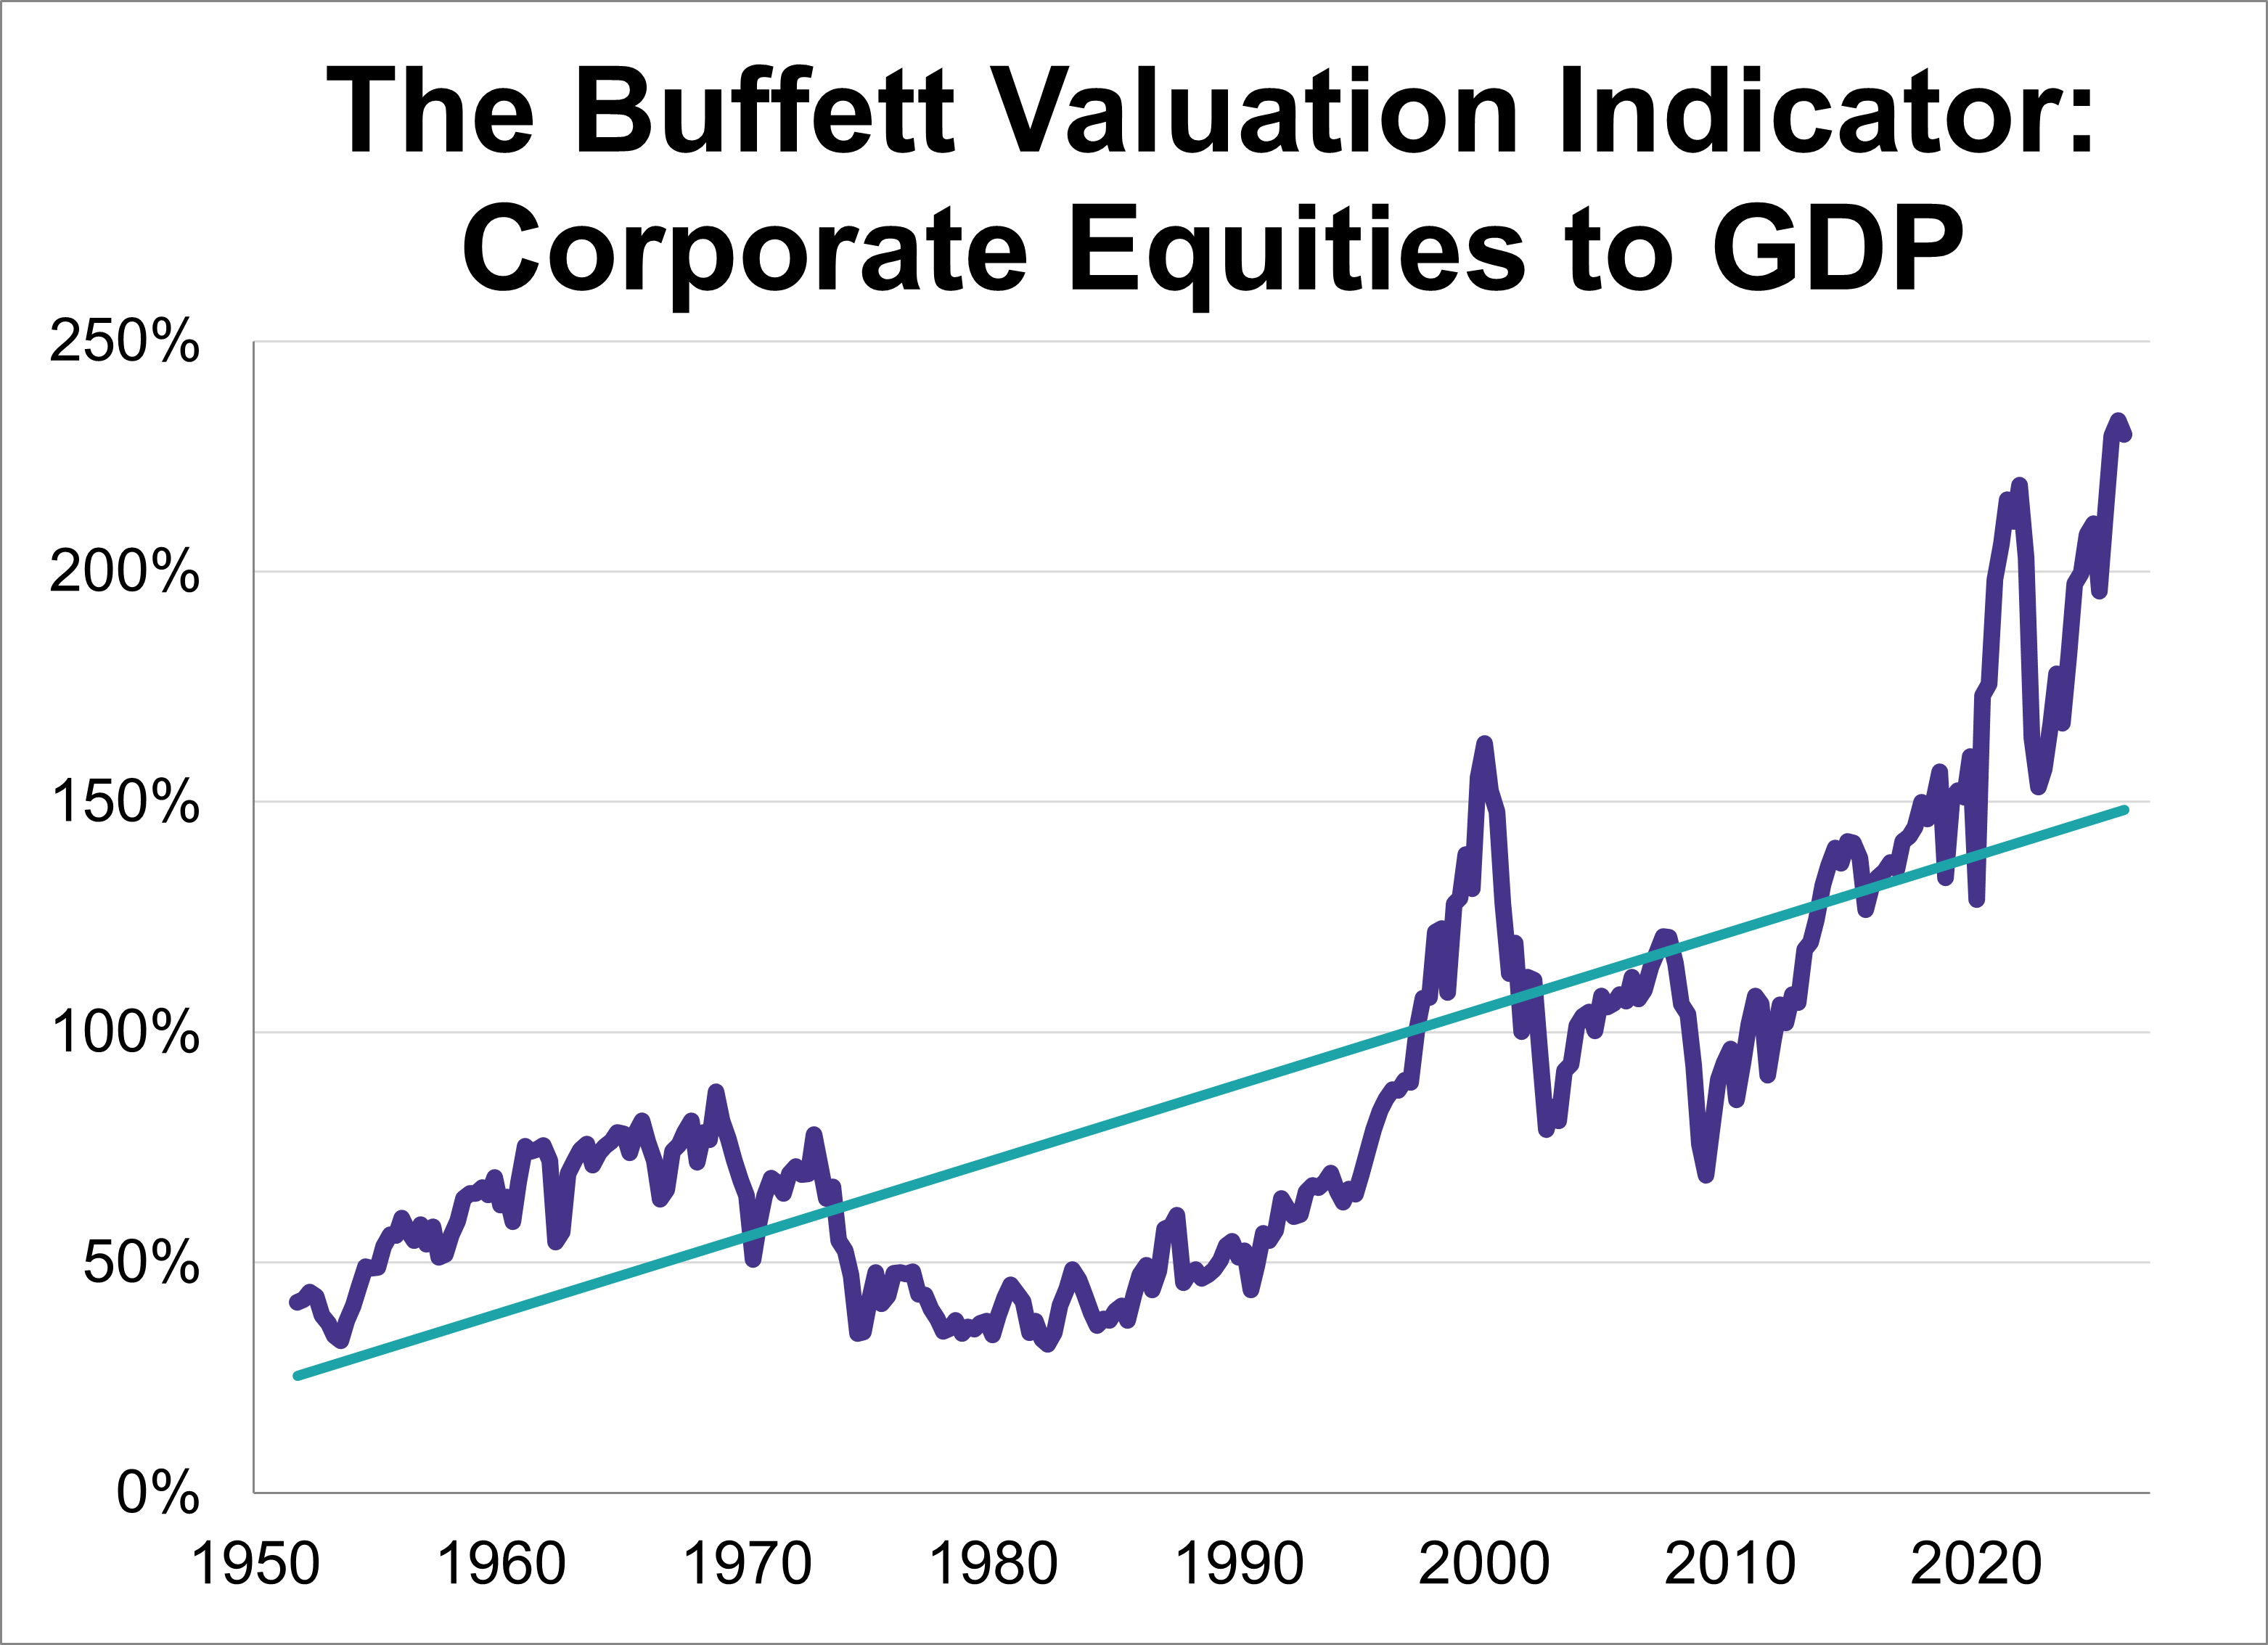
Following the Q1 GDP second estimate, the 'Buffett Indicator'—the ratio of corporate equities to GDP—now stands at 229.7%. This marks the second-highest reading in history, eclipsed only by the previous quarter.
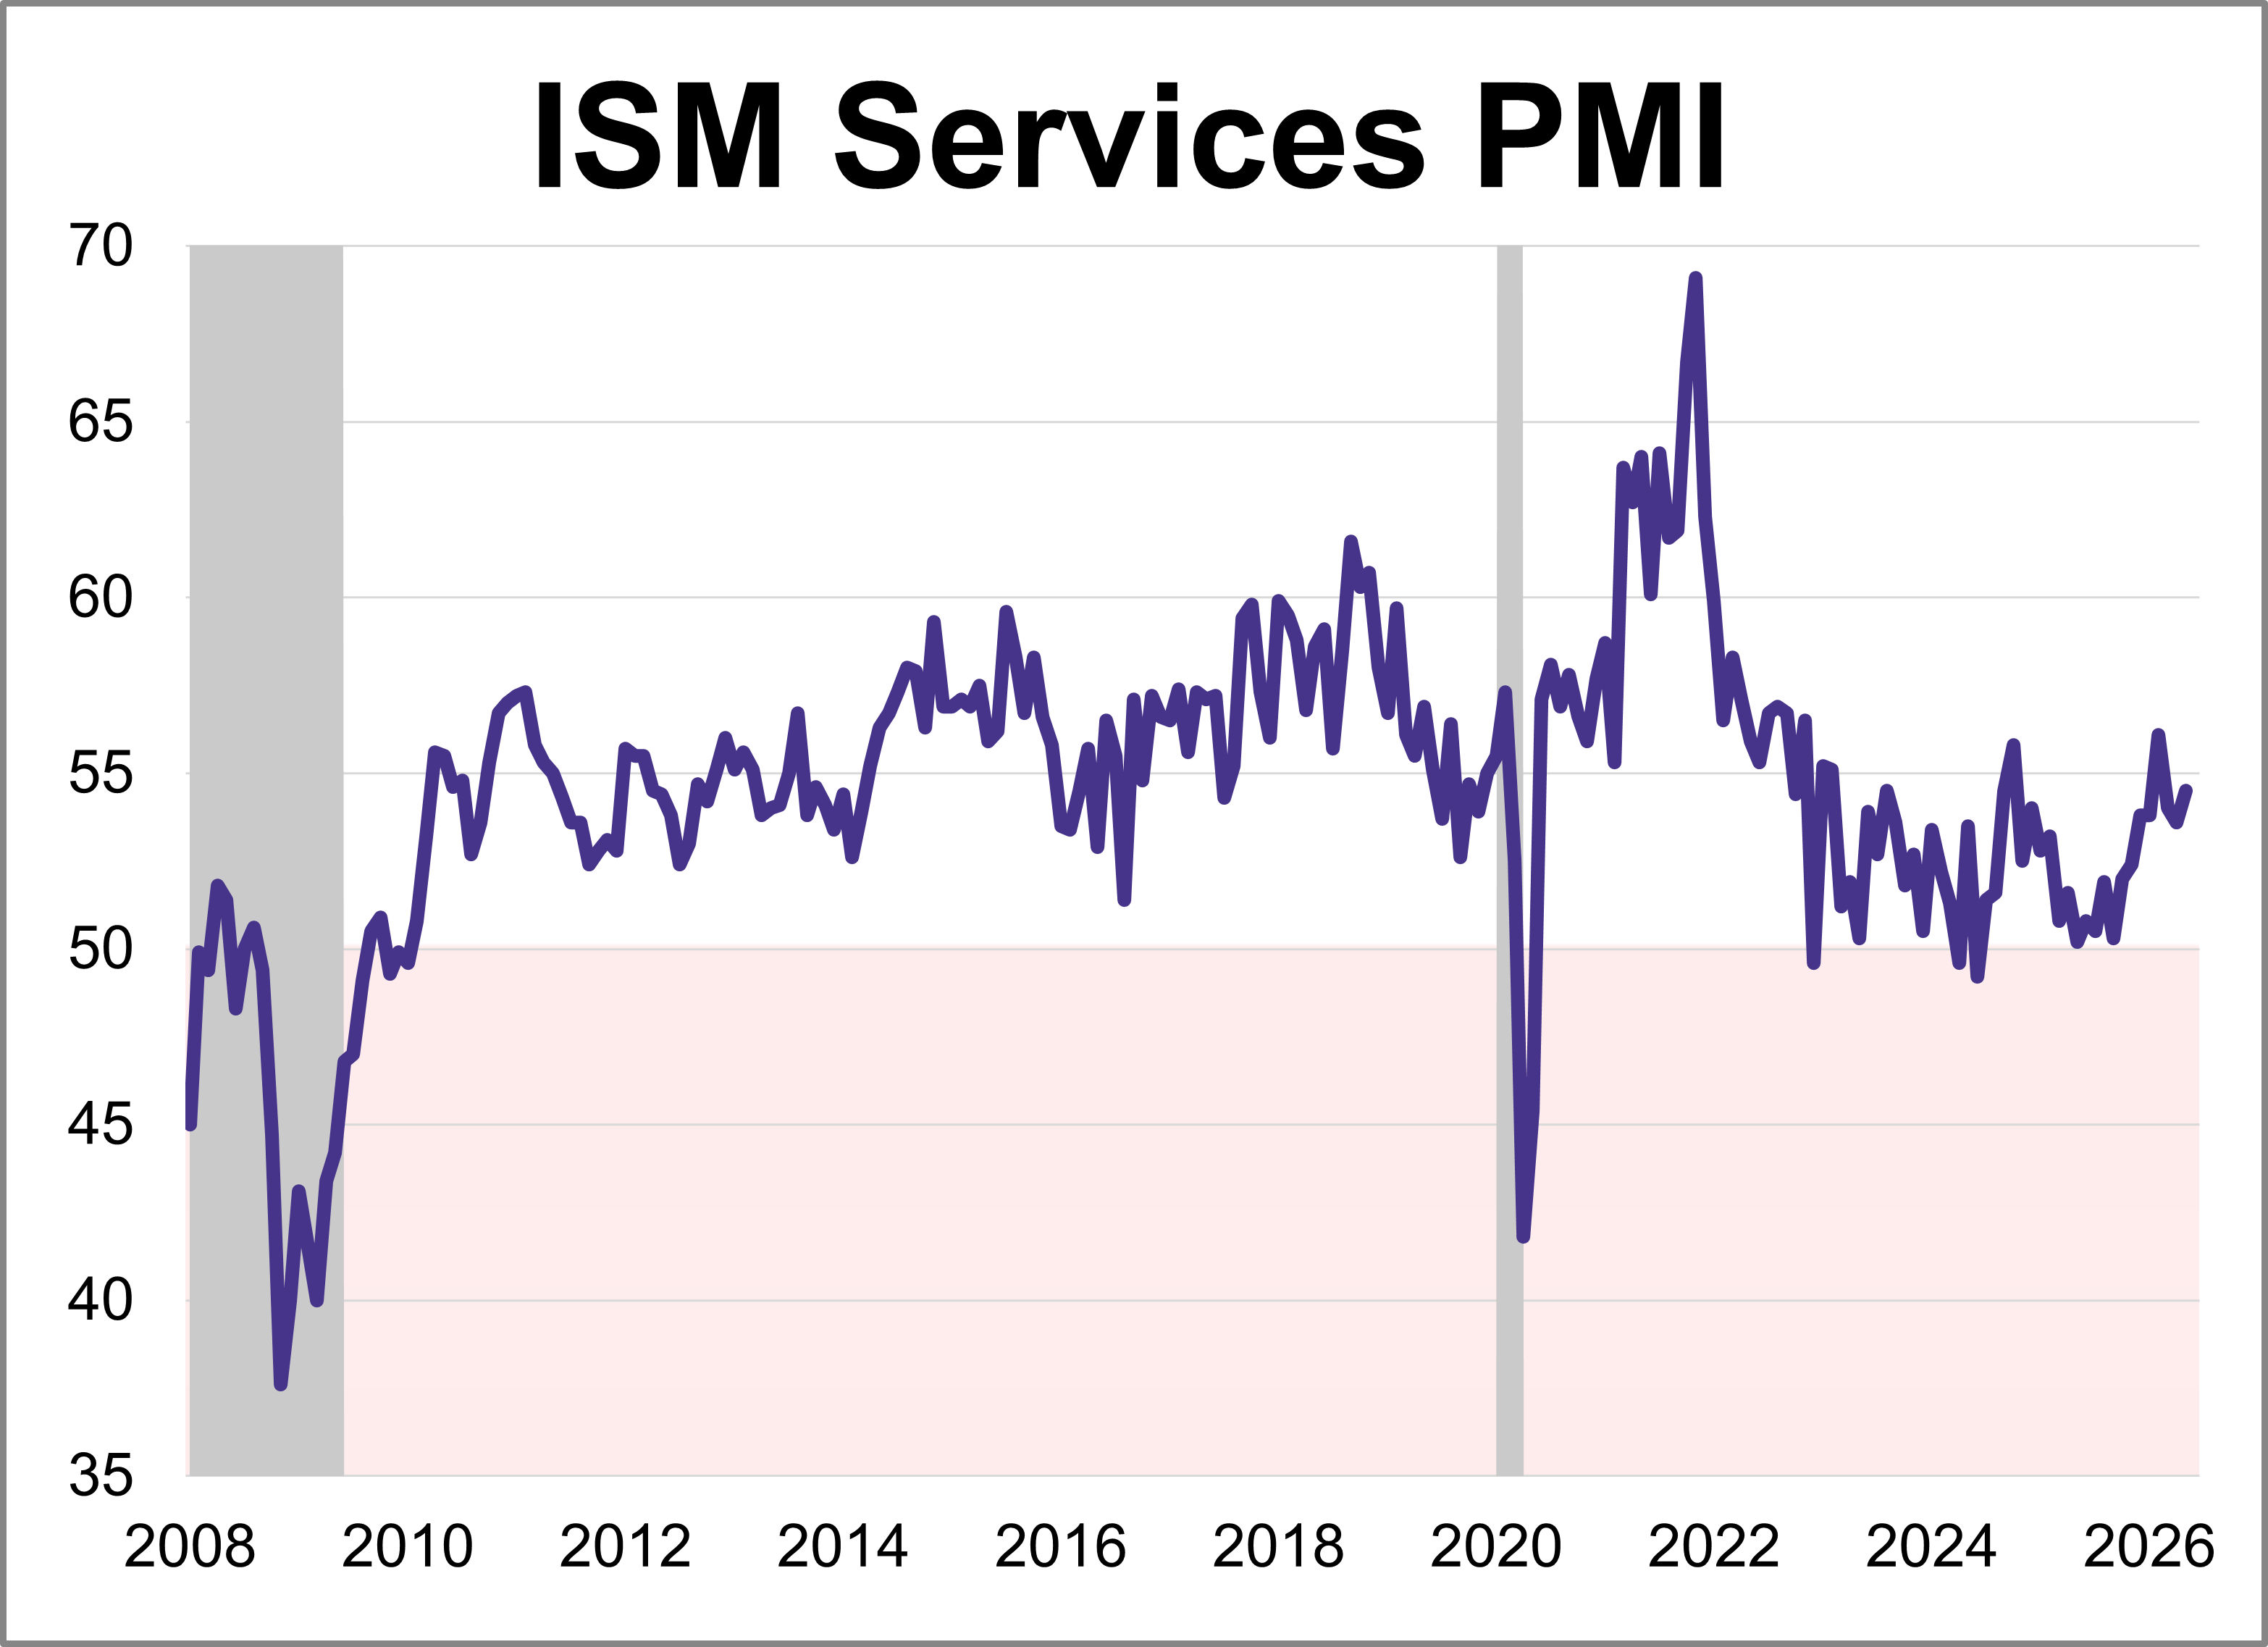
The Institute for Supply Management (ISM) released its May Services Purchasing Managers' Index (PMI), with the headline composite index at 54.5. This was higher than the forecast of 53.7 and keeps the index in expansion territory for a 23rd consecutive month.
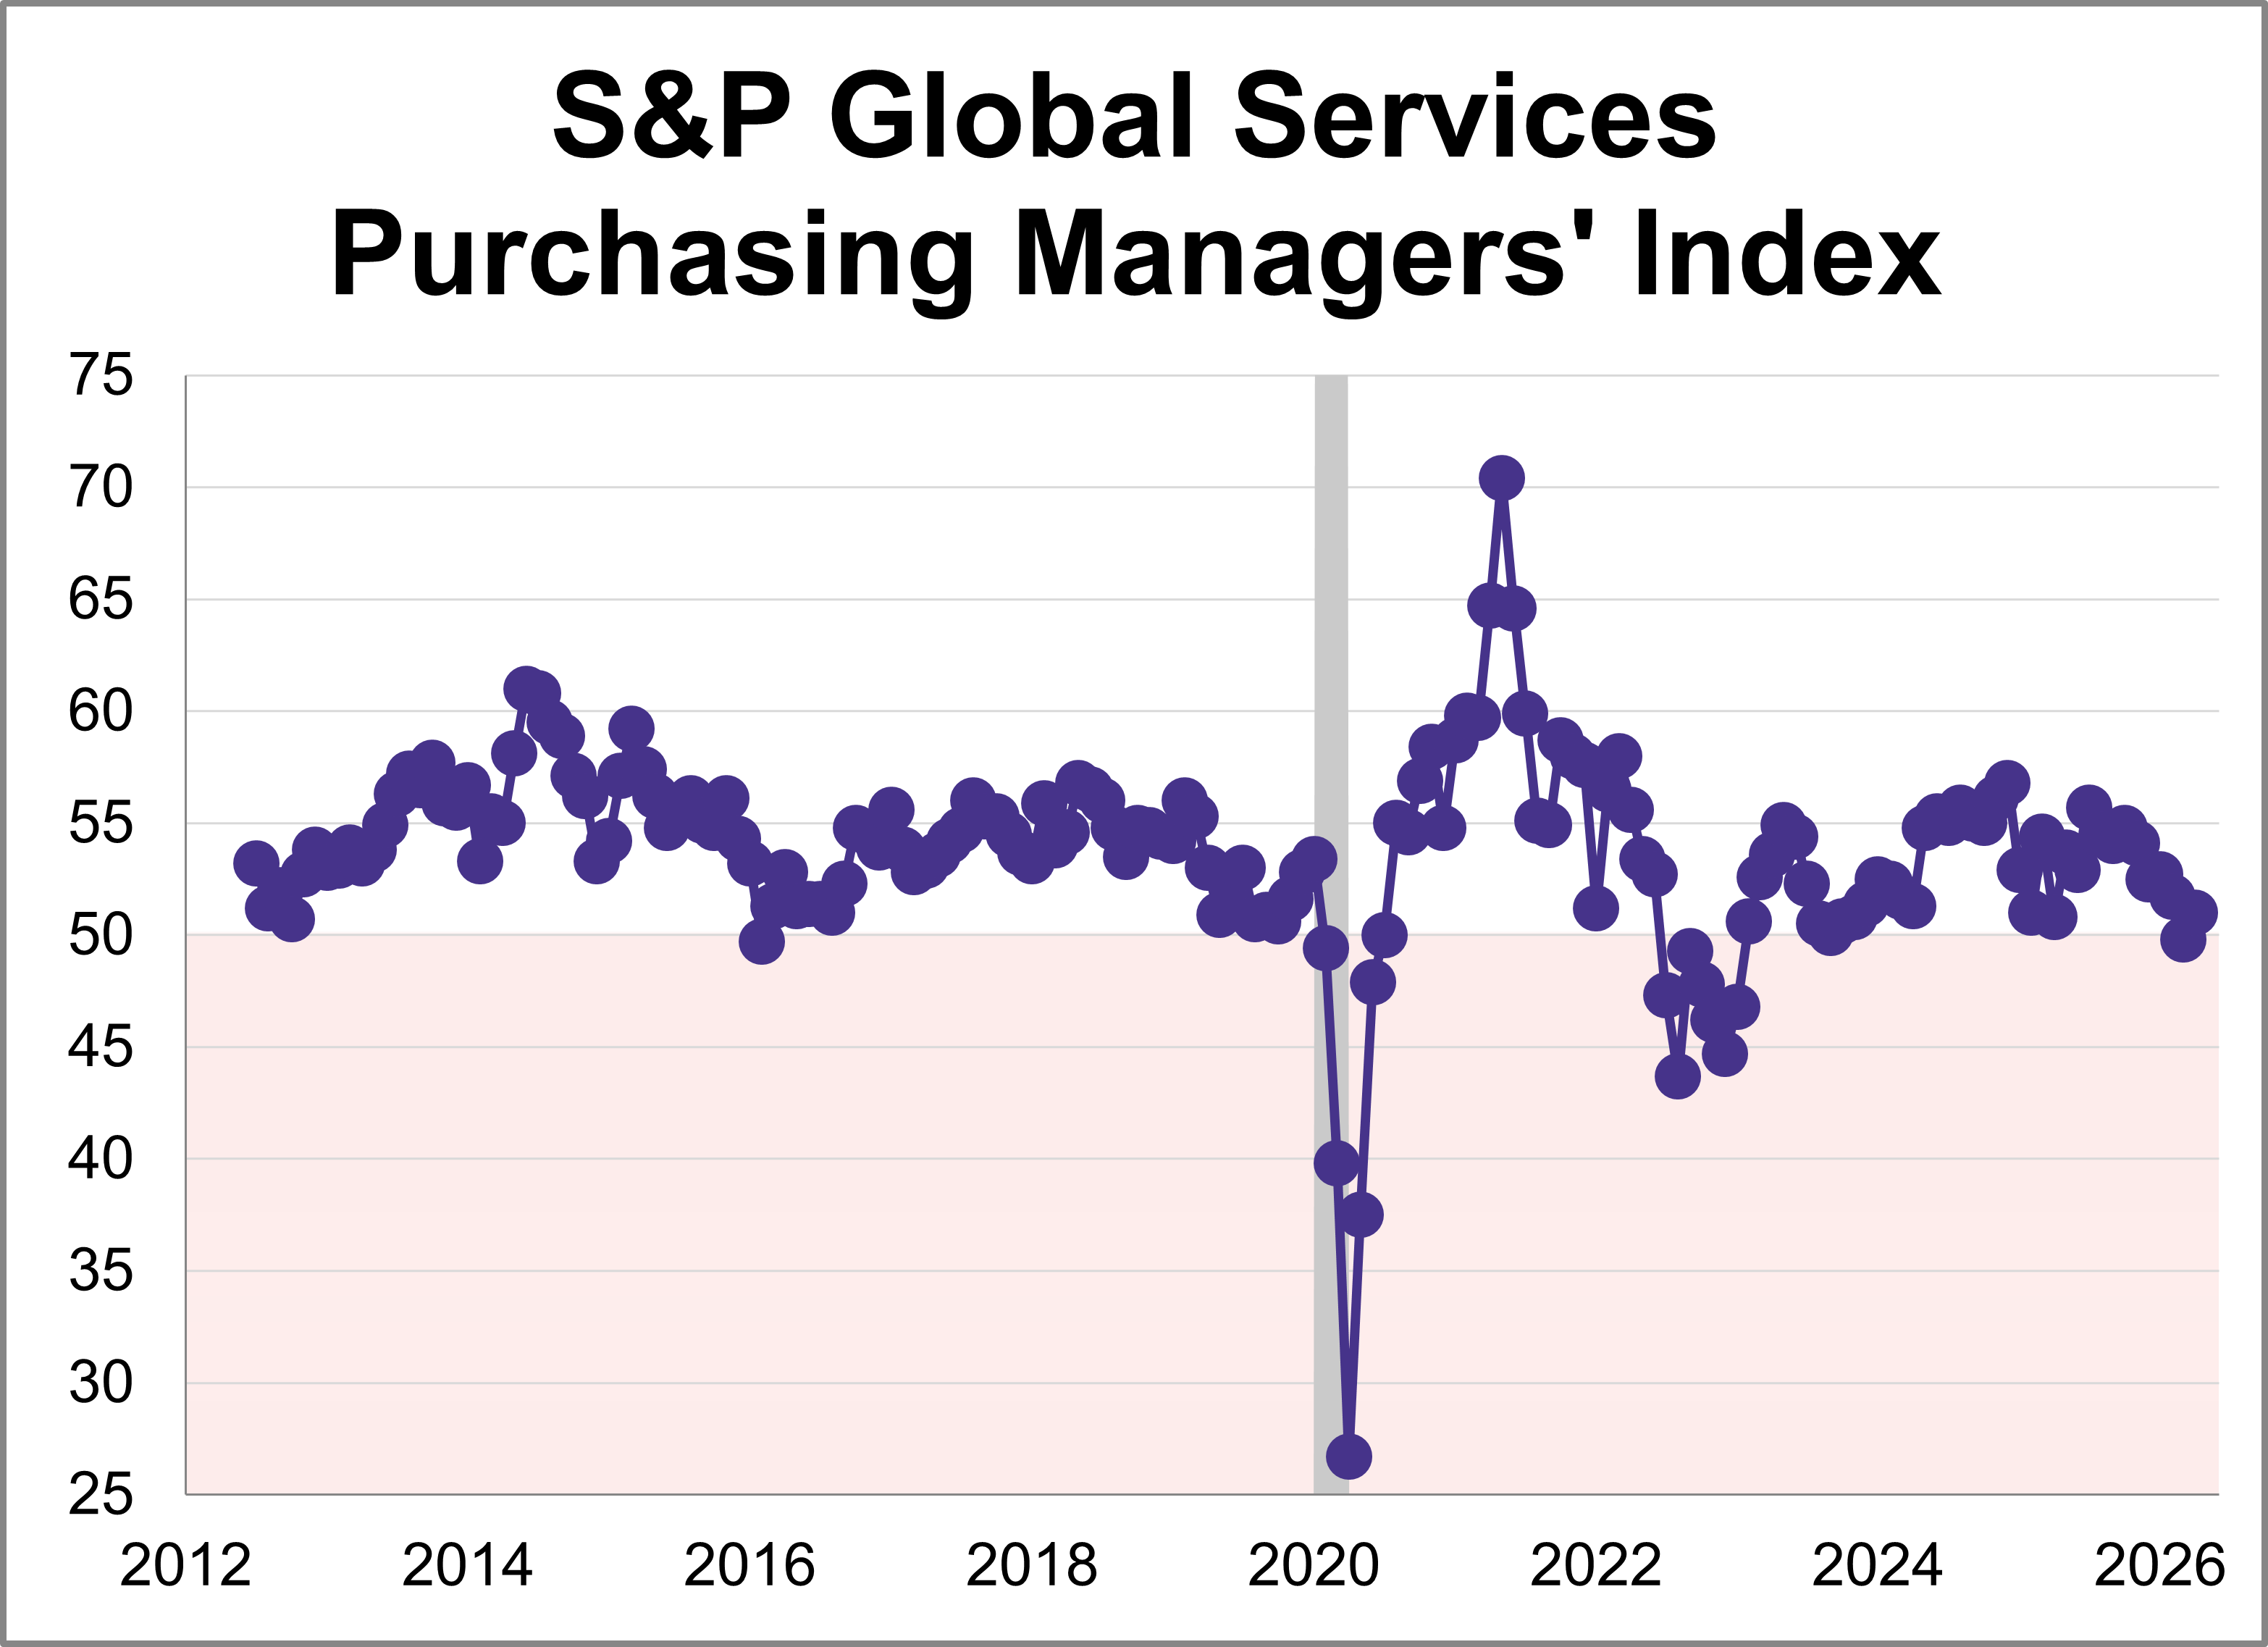
The May U.S. Services Purchasing Managers' Index (PMI) from S&P Global inched down 0.3 points to 50.7, indicating slower expansion in the services sector. The latest reading was lower than the forecast of 50.9 and was among the weakest months of expansion in the past 2.5 years.
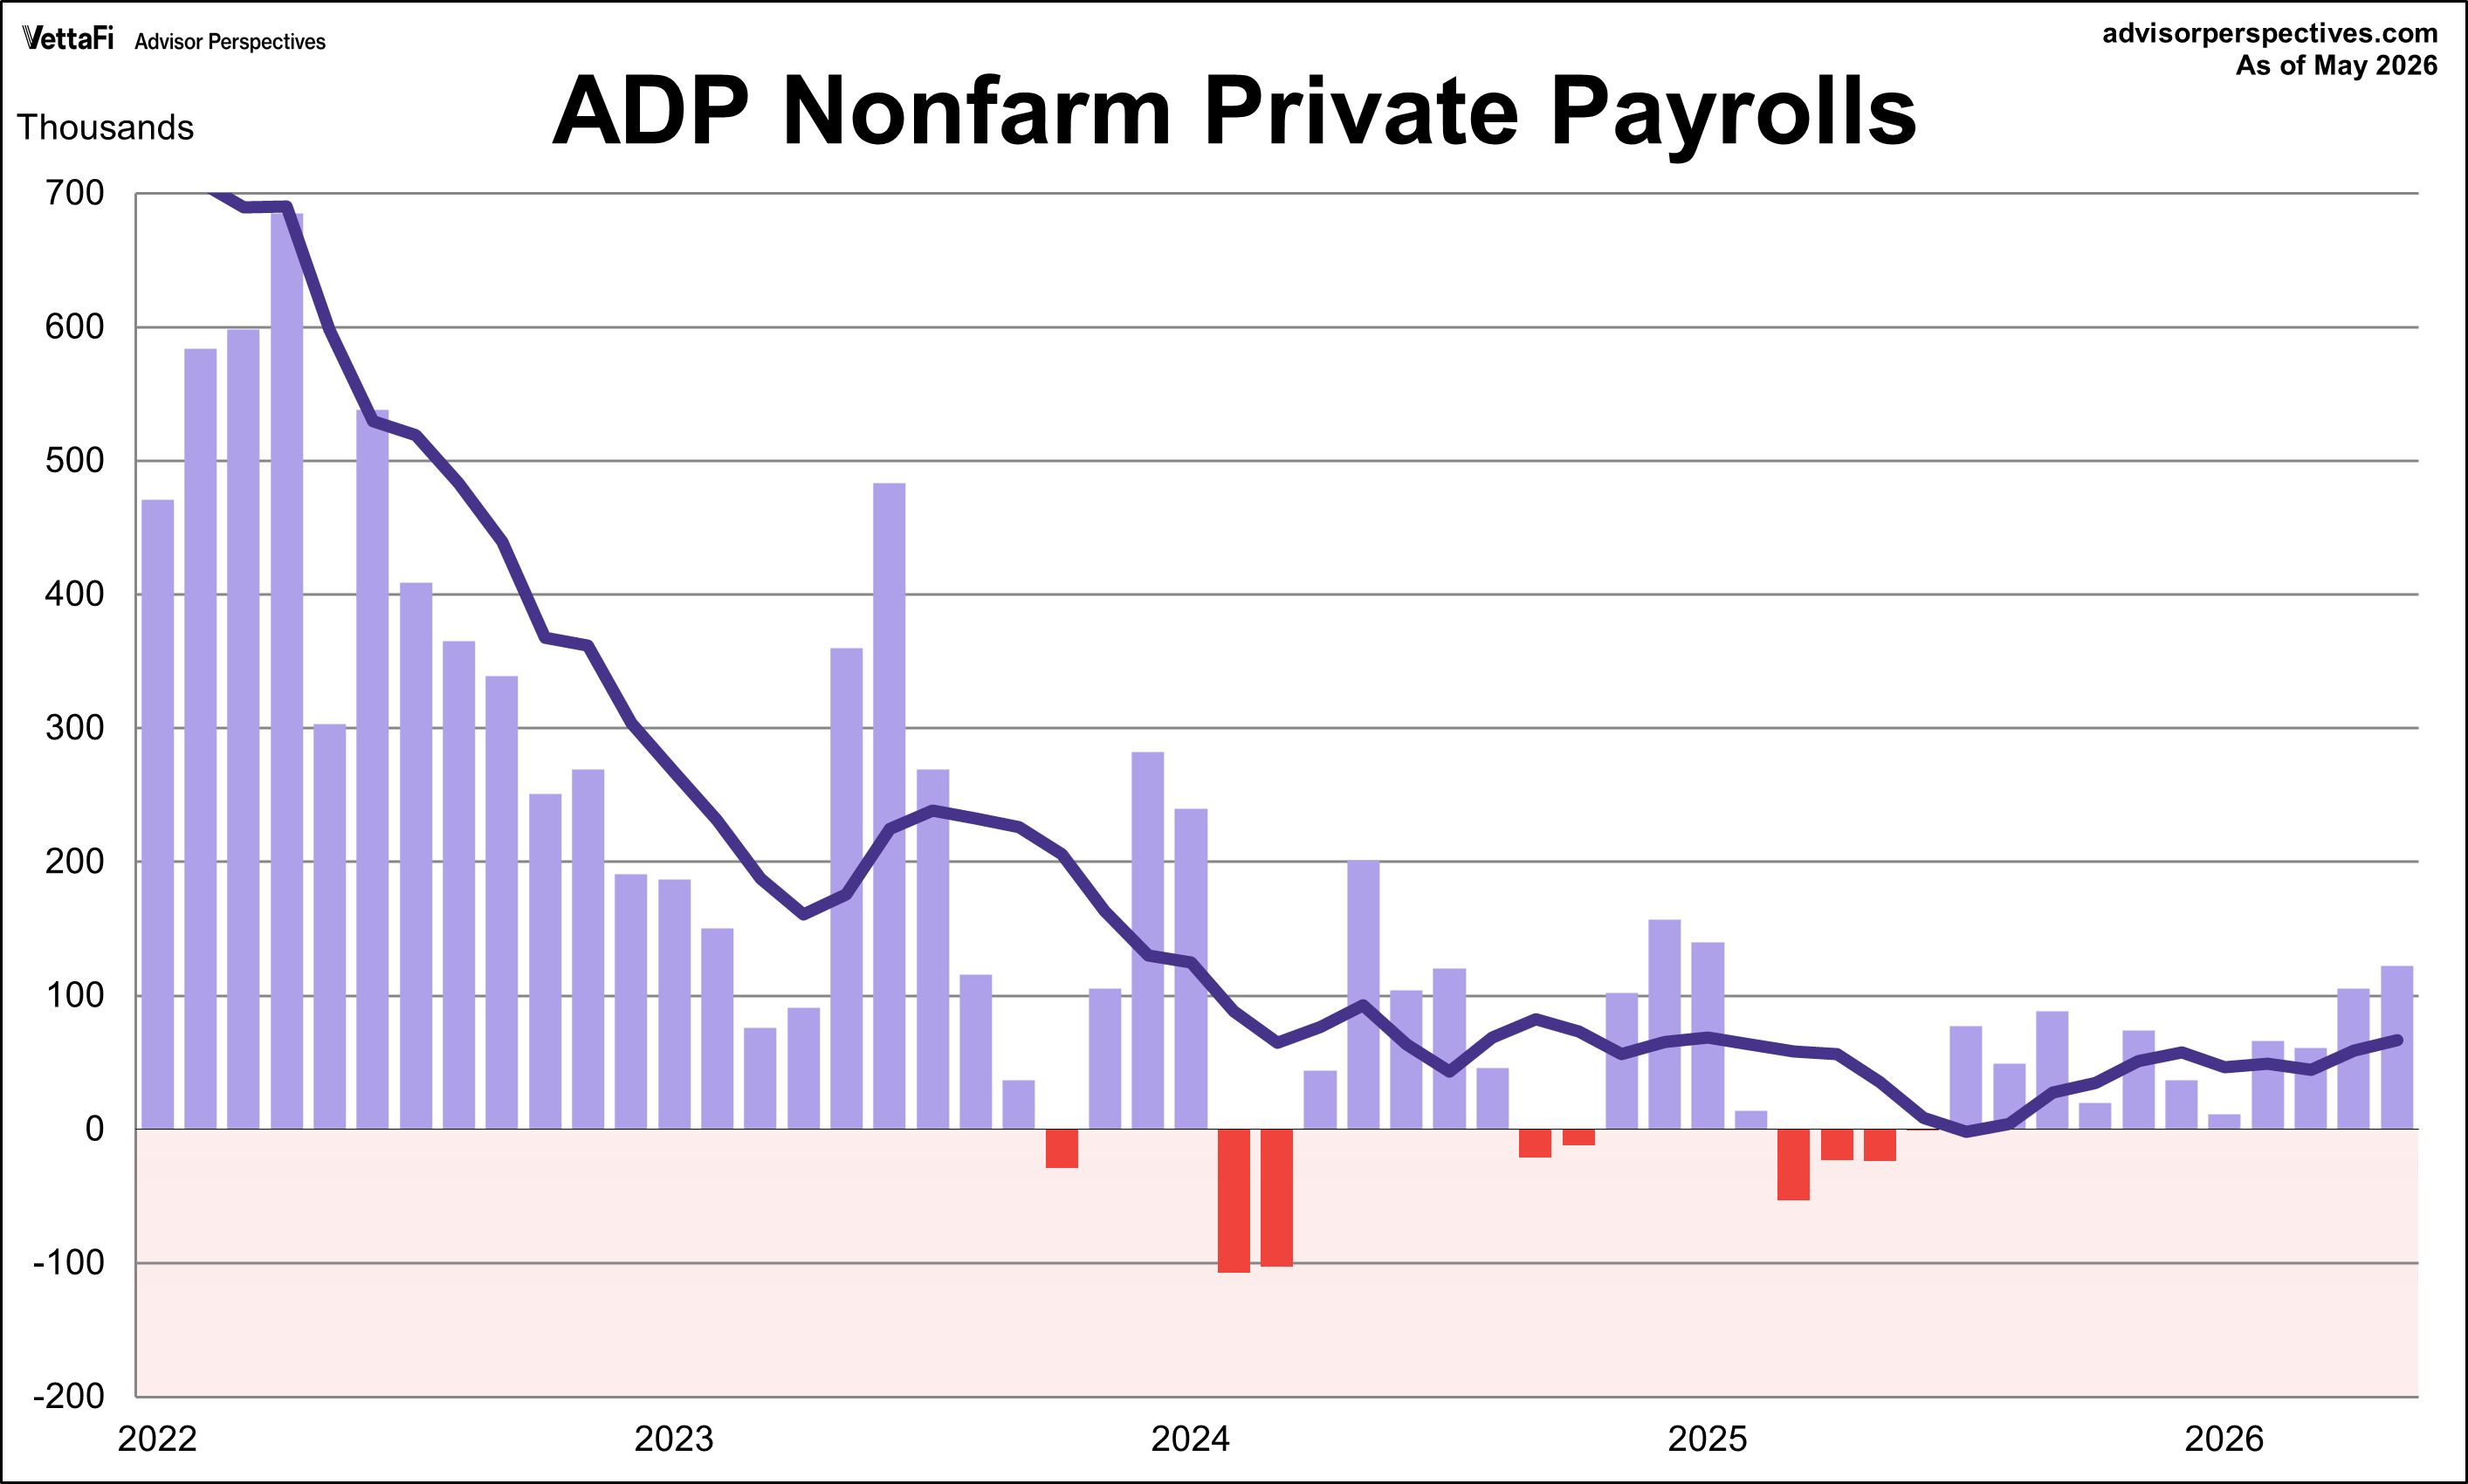
The ADP employment report revealed that 122,000 nonfarm private jobs were added in May, the largest monthly growth since January 2025. The latest figure was just above the projected 118,000 addition.
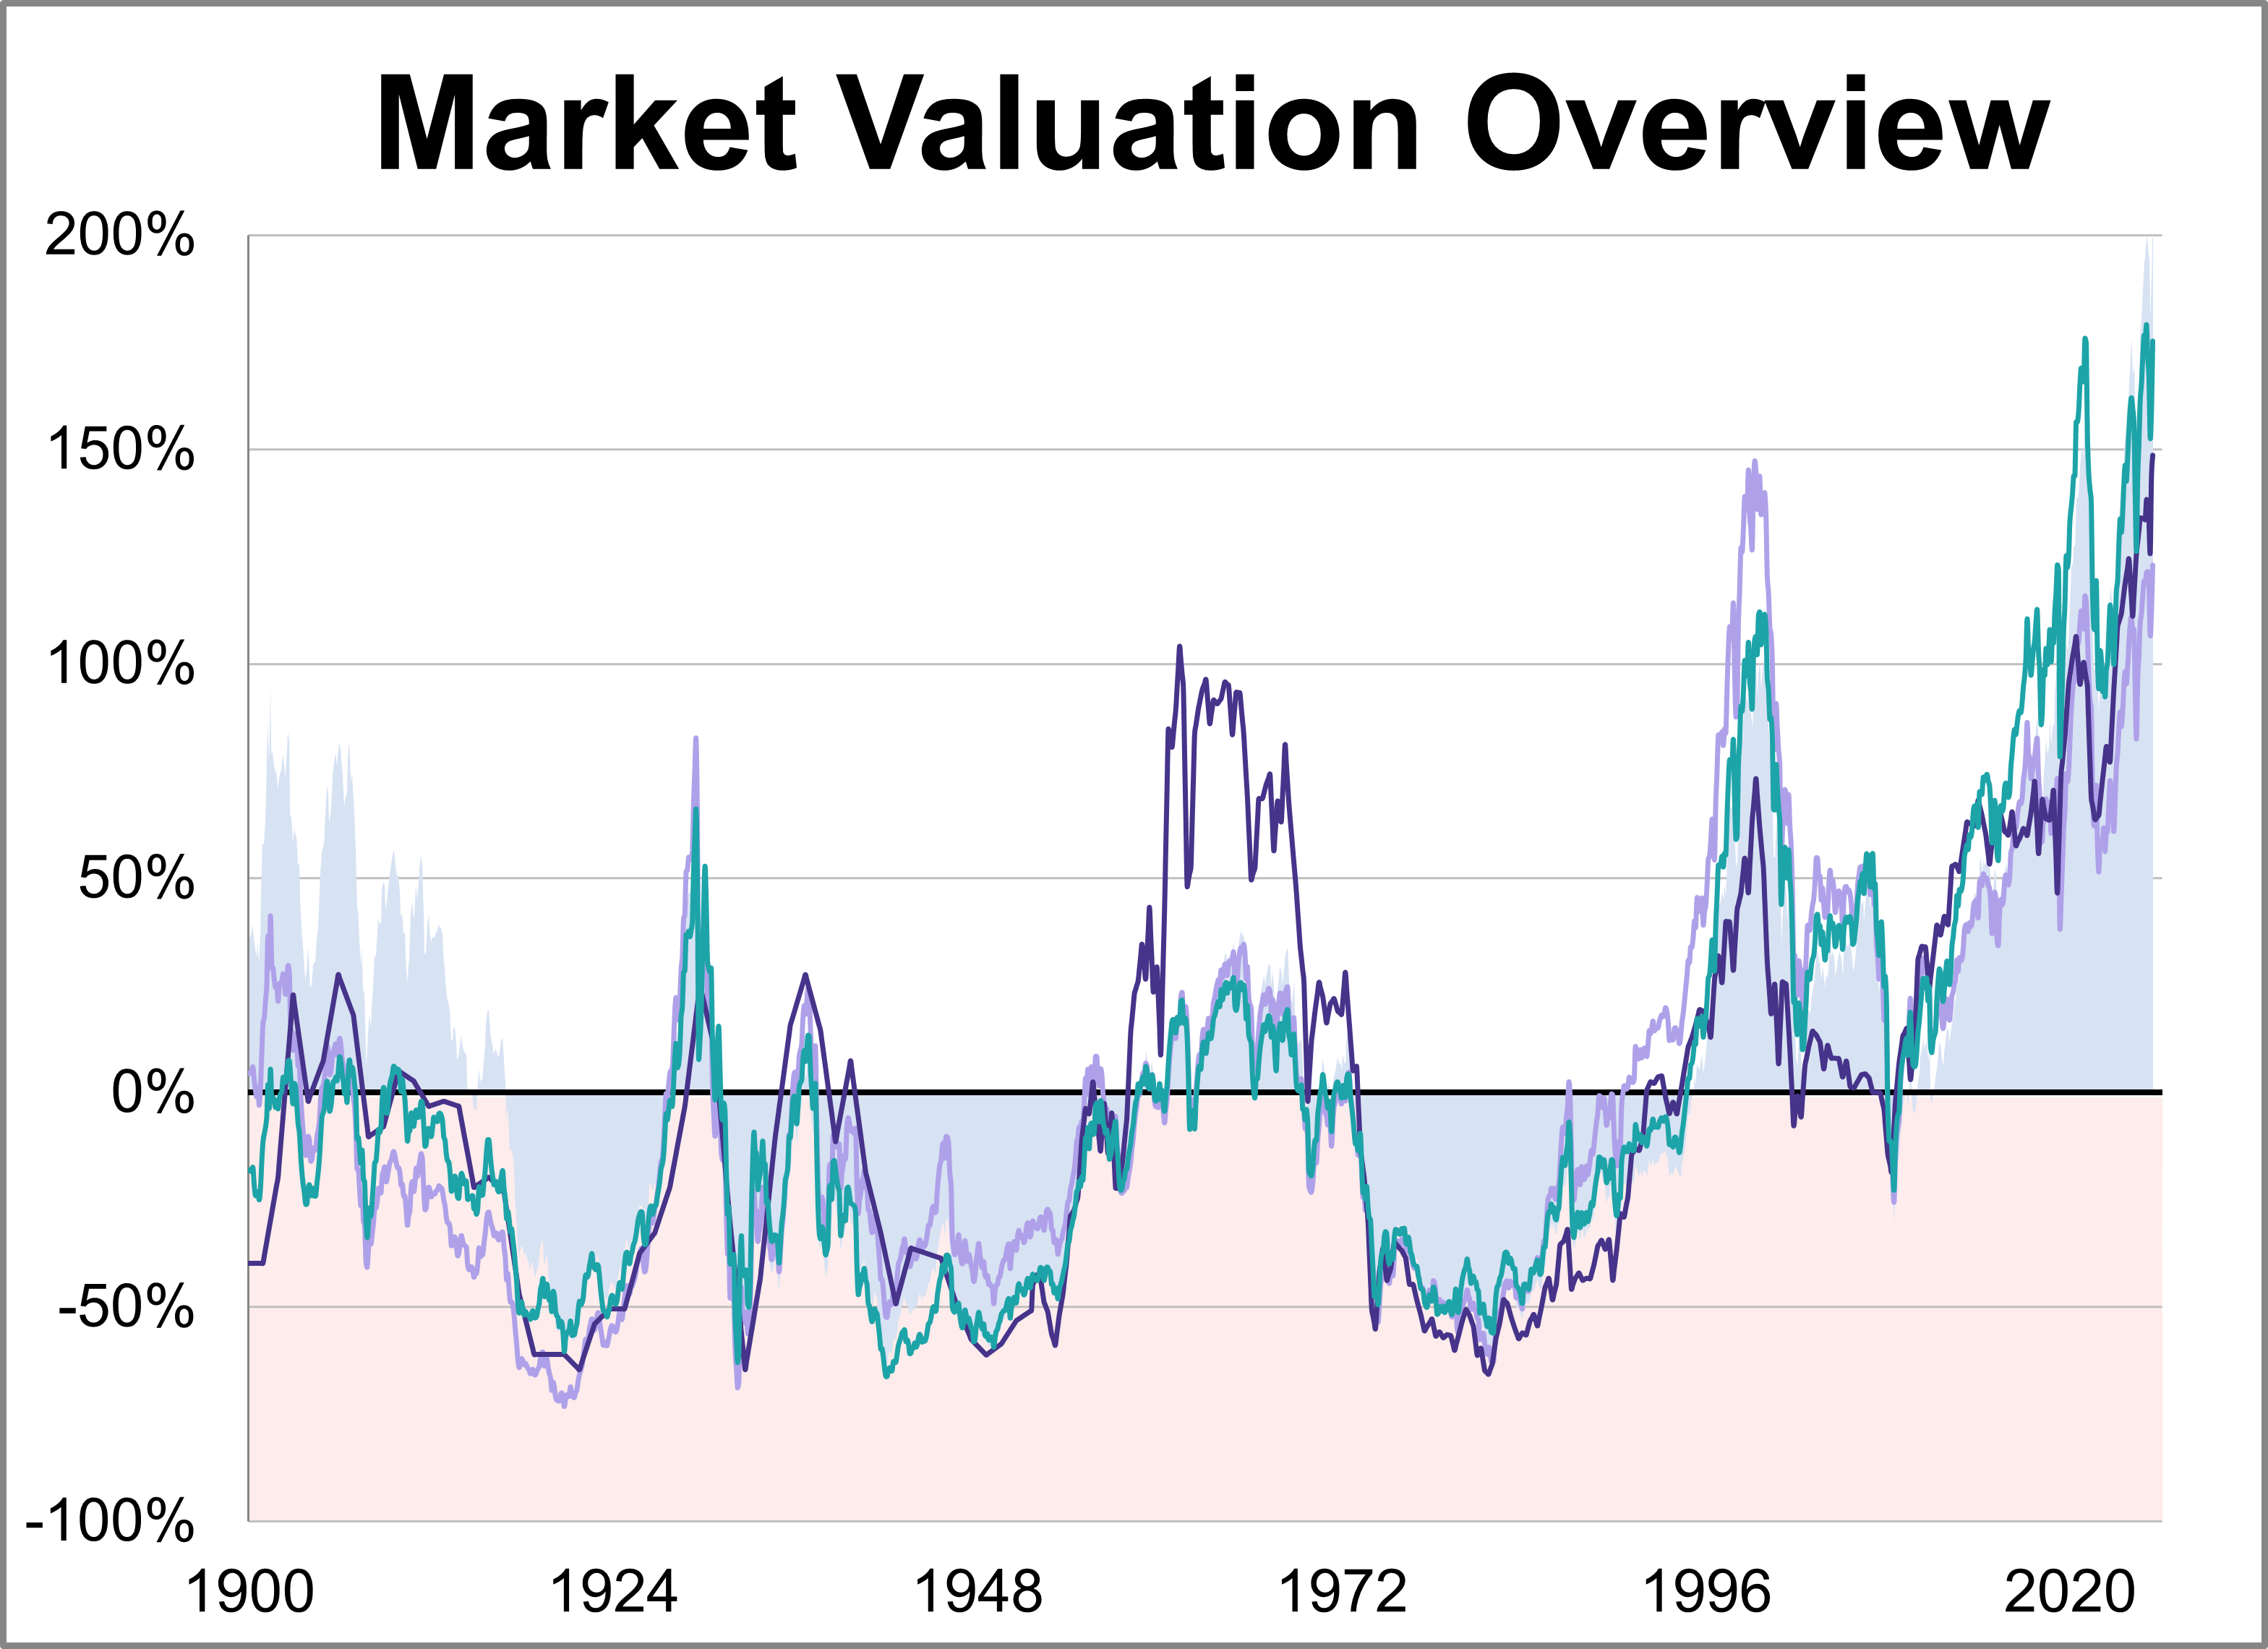
Here is a summary of the four market valuation indicators we update on a monthly basis.
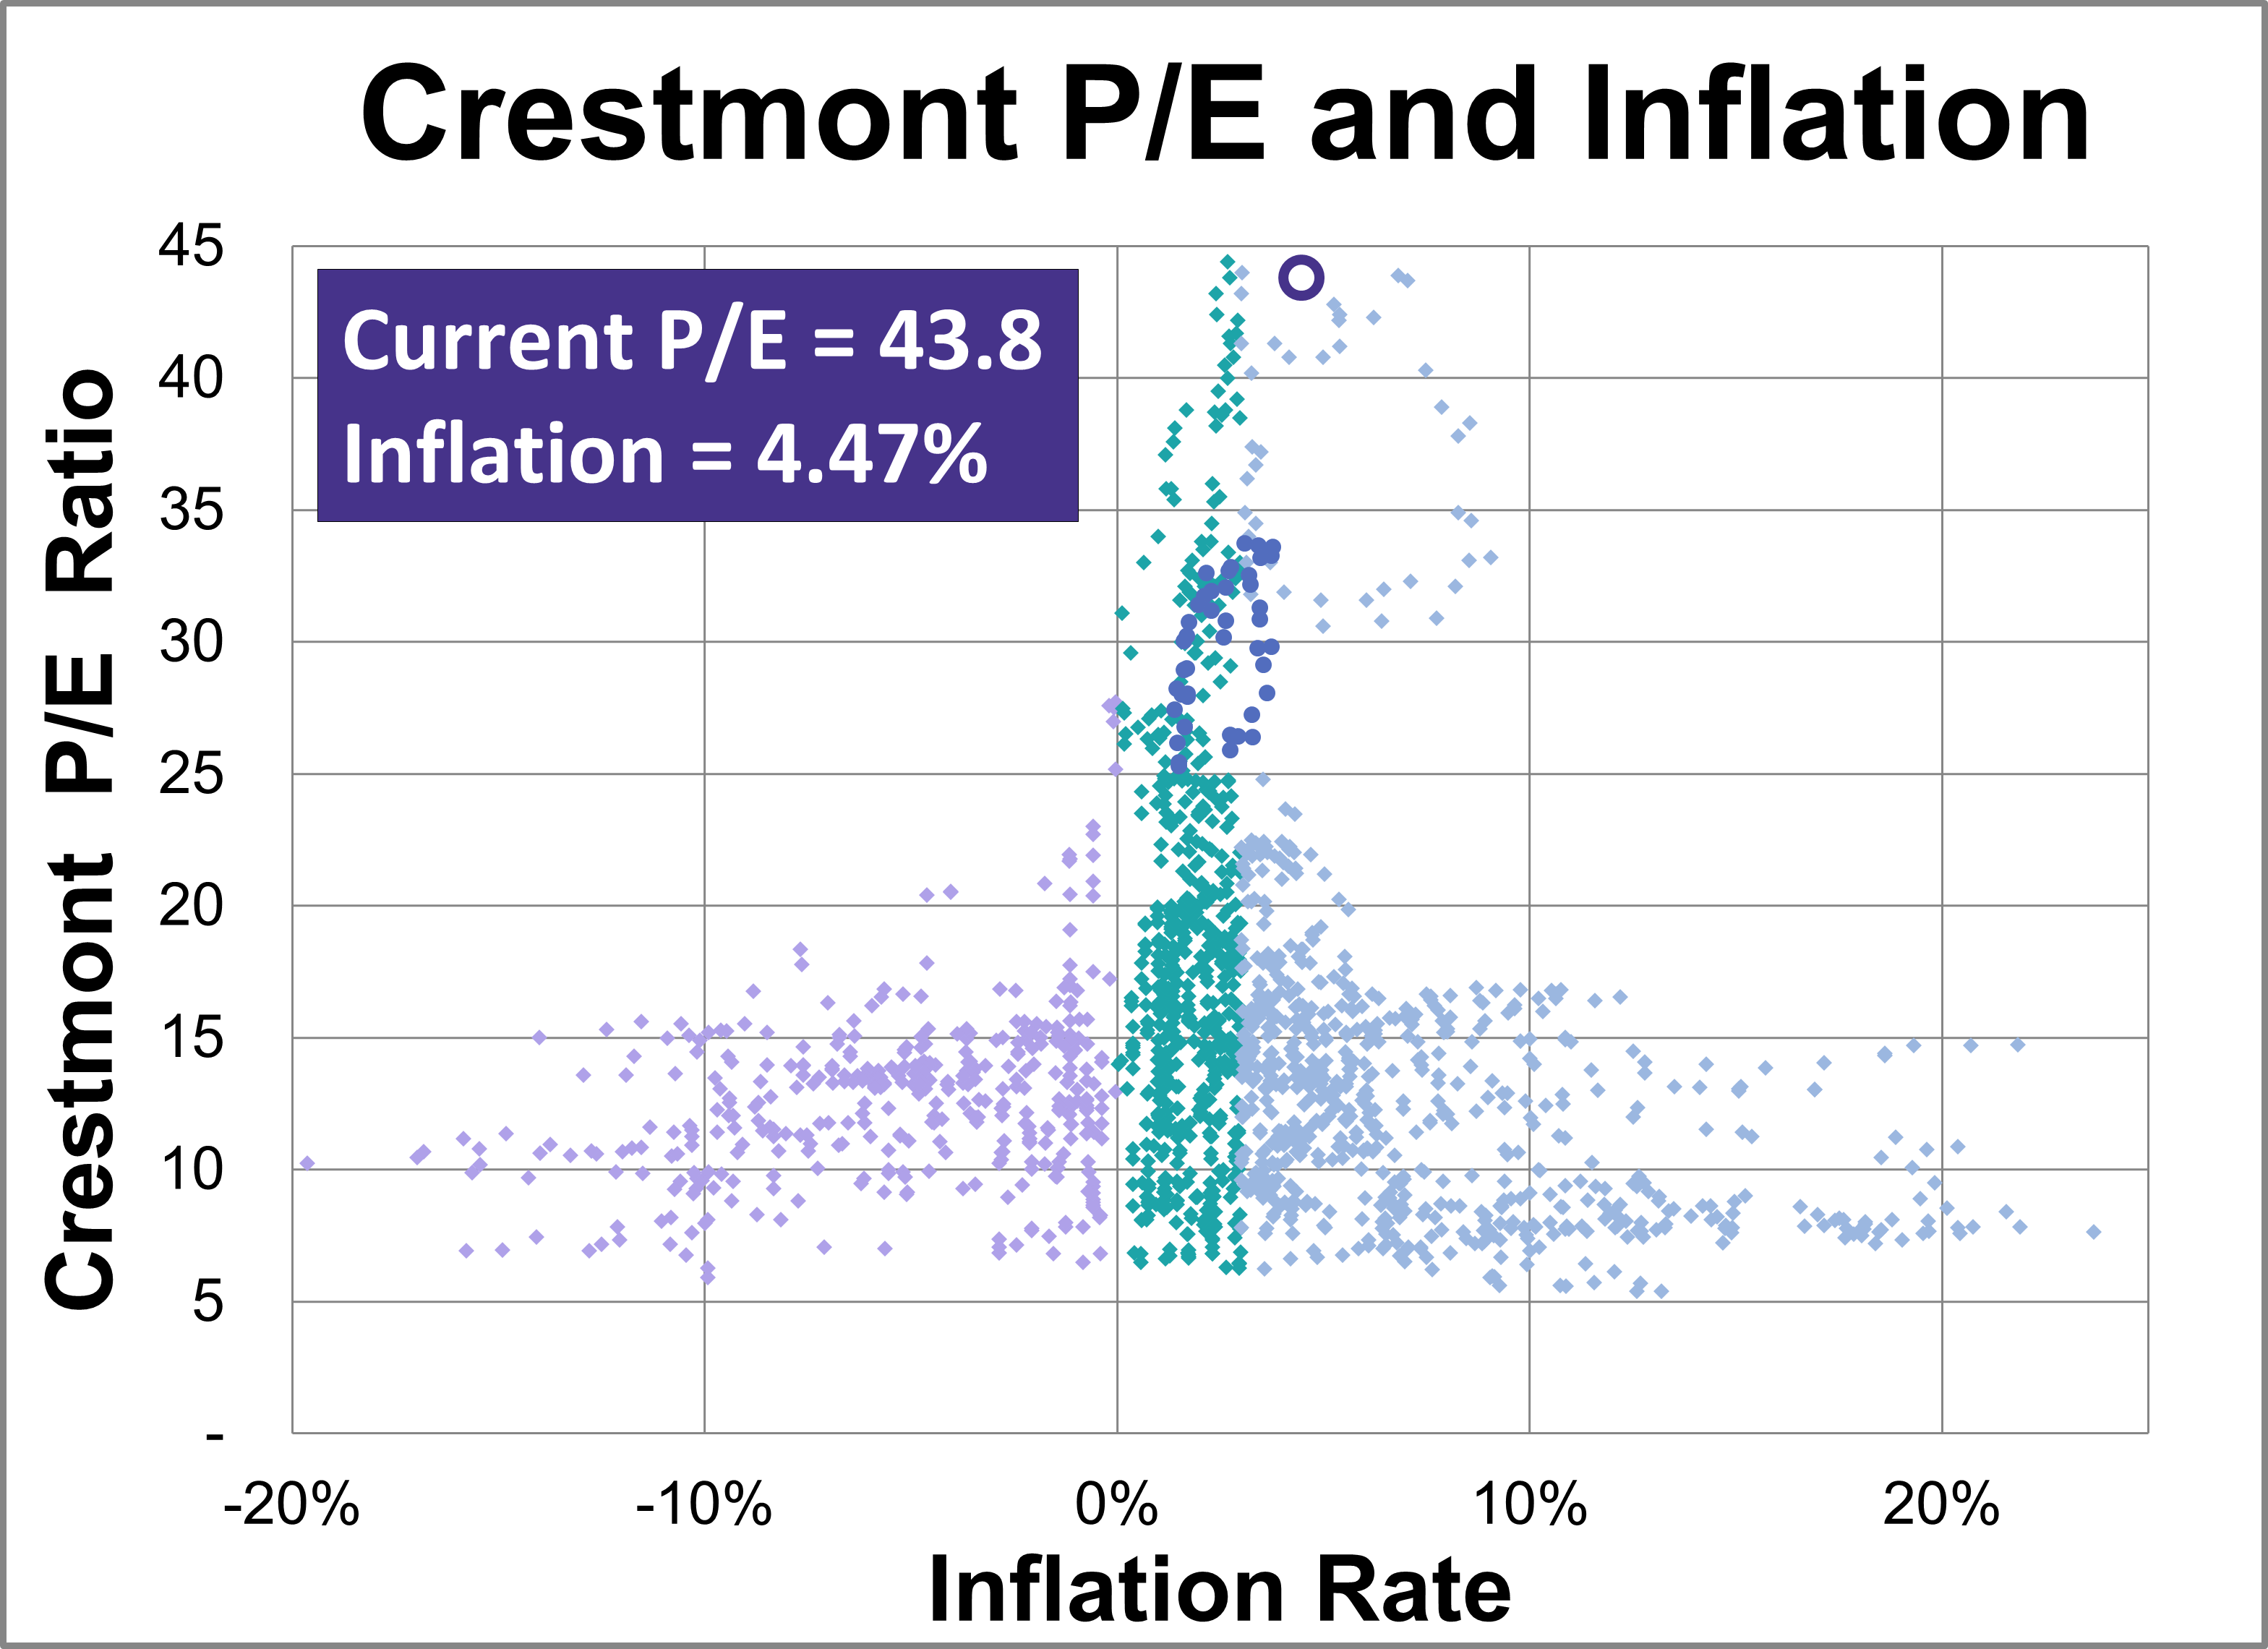
Based on May's S&P 500 average of daily closes, the Crestmont P/E of 43.8 is 185% above its arithmetic mean, 213% above its geometric mean, and is in the 100th percentile of this 14-plus-decade series.
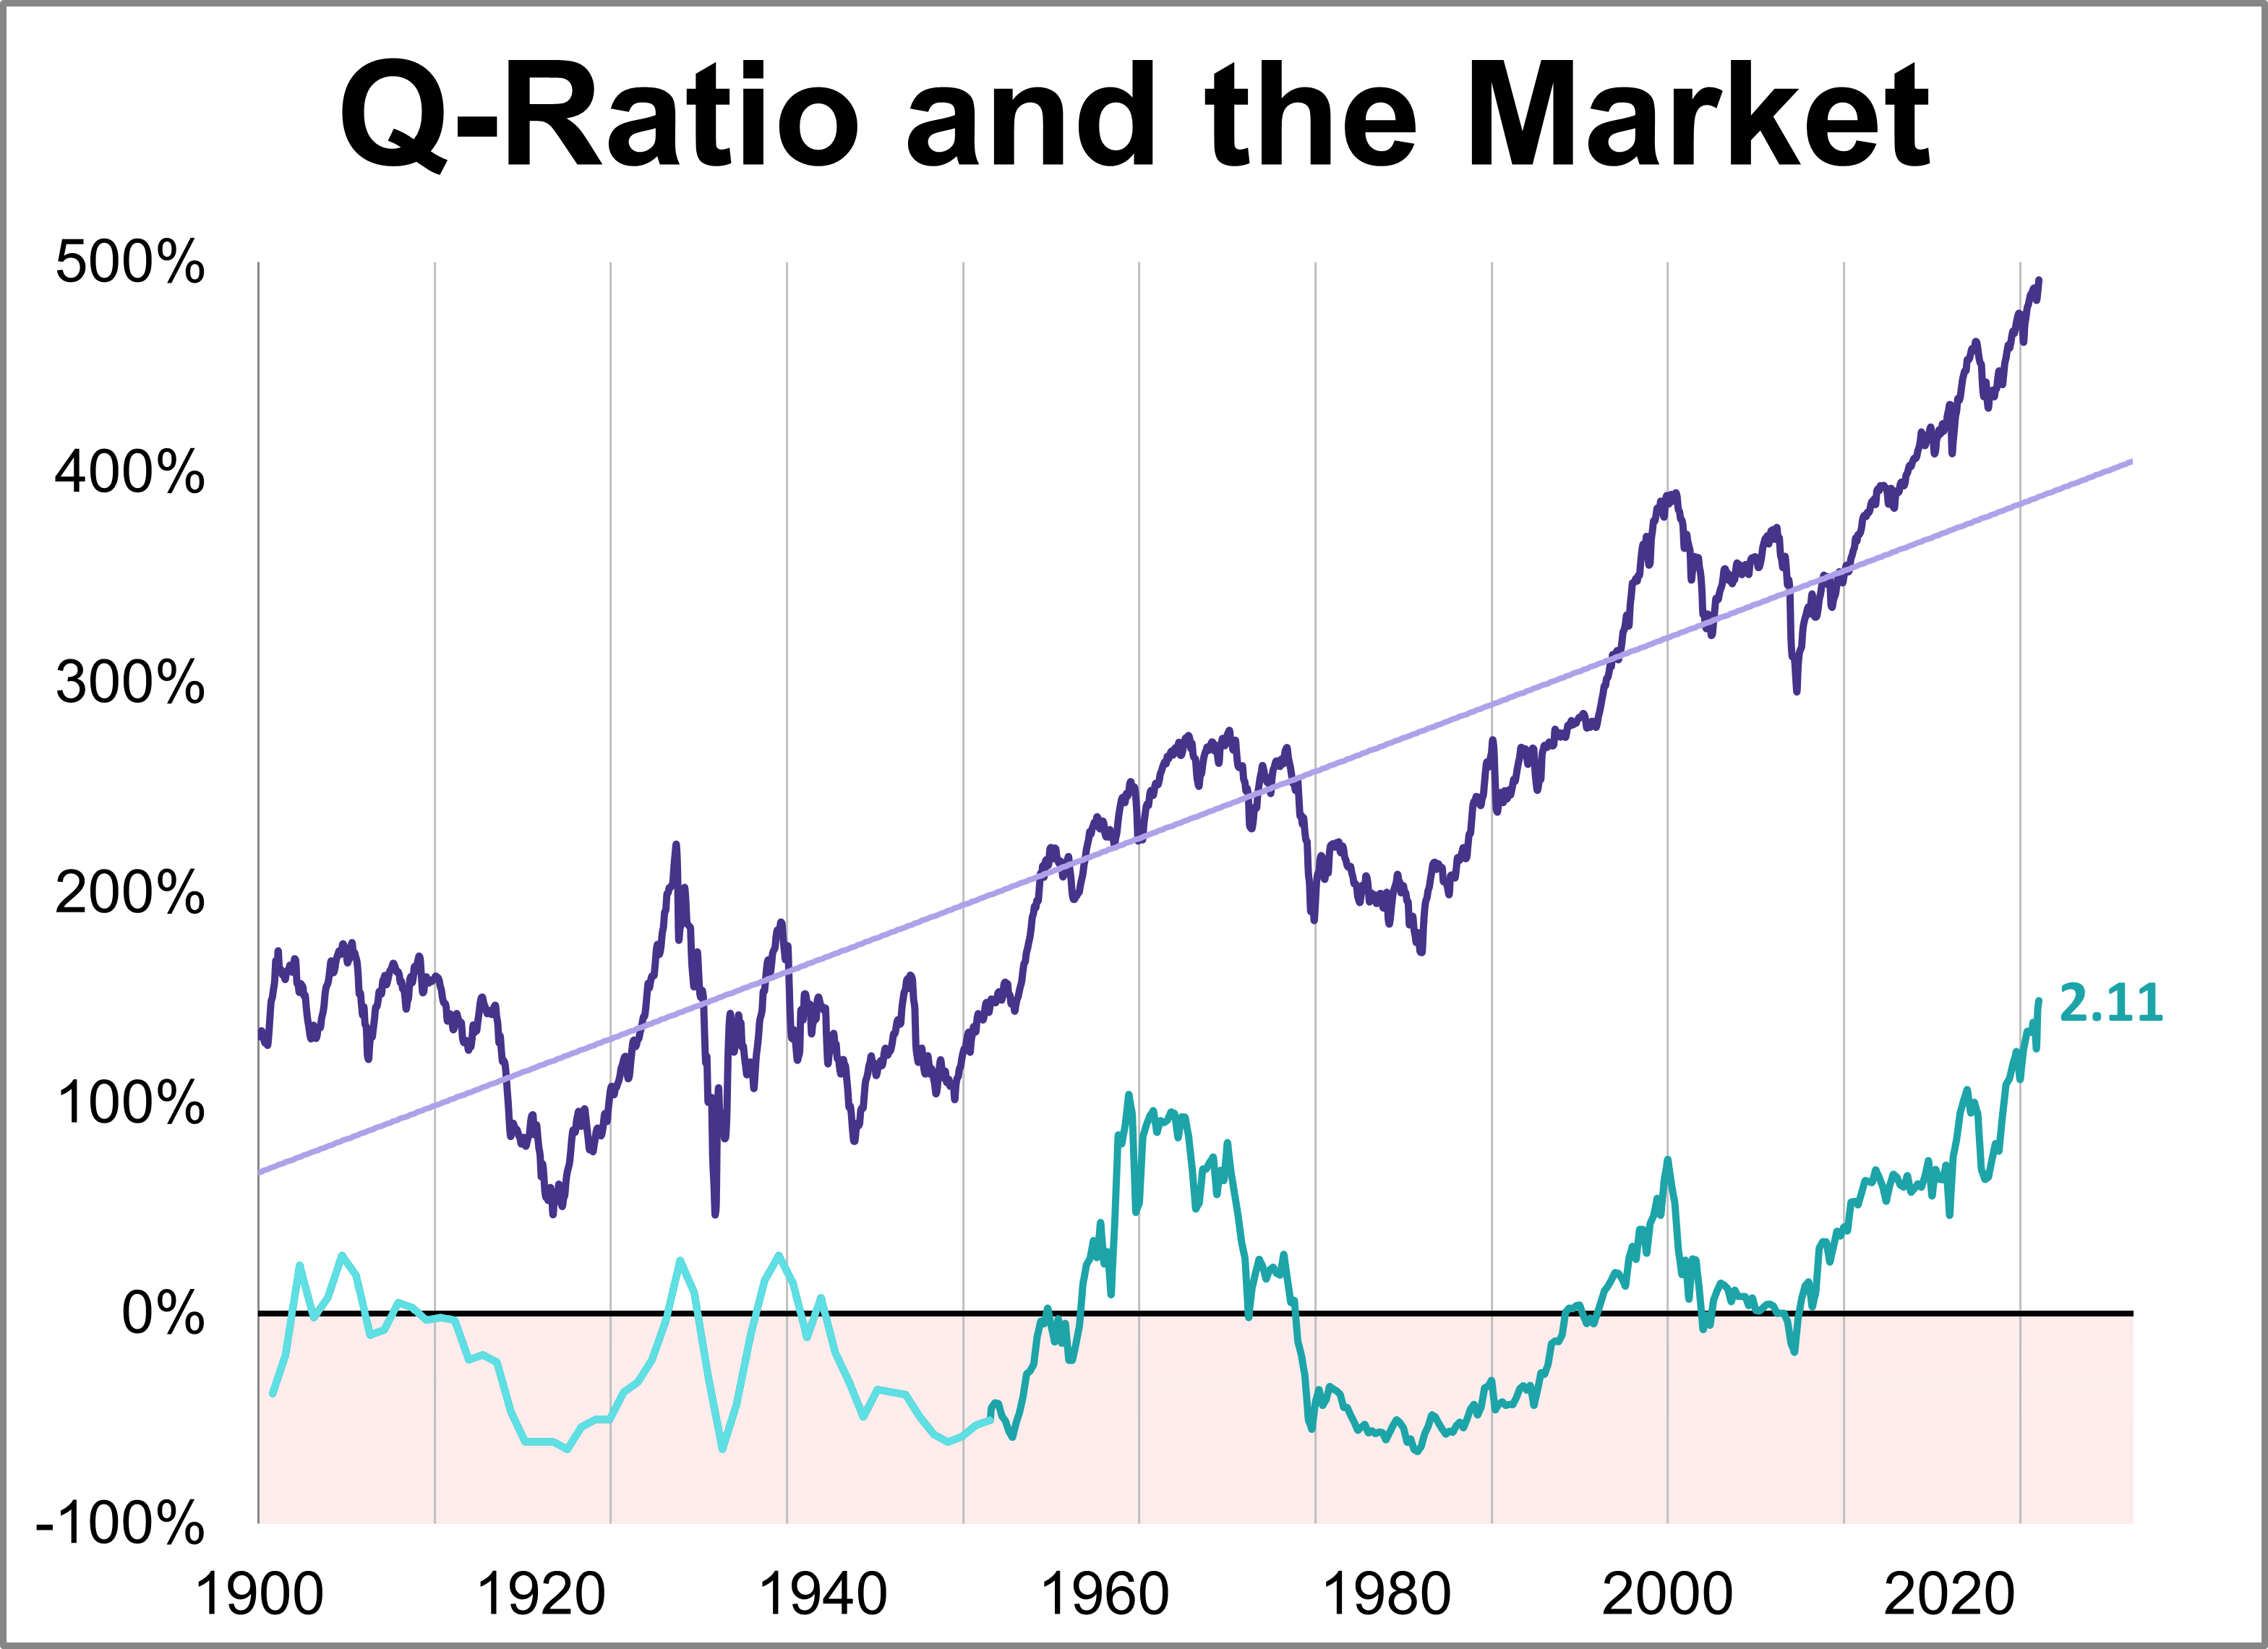
The Q Ratio is the total price of the market divided by the replacement cost of all its companies. As of May 2026, the latest Q-ratio is at 2.11, the highest level in history.
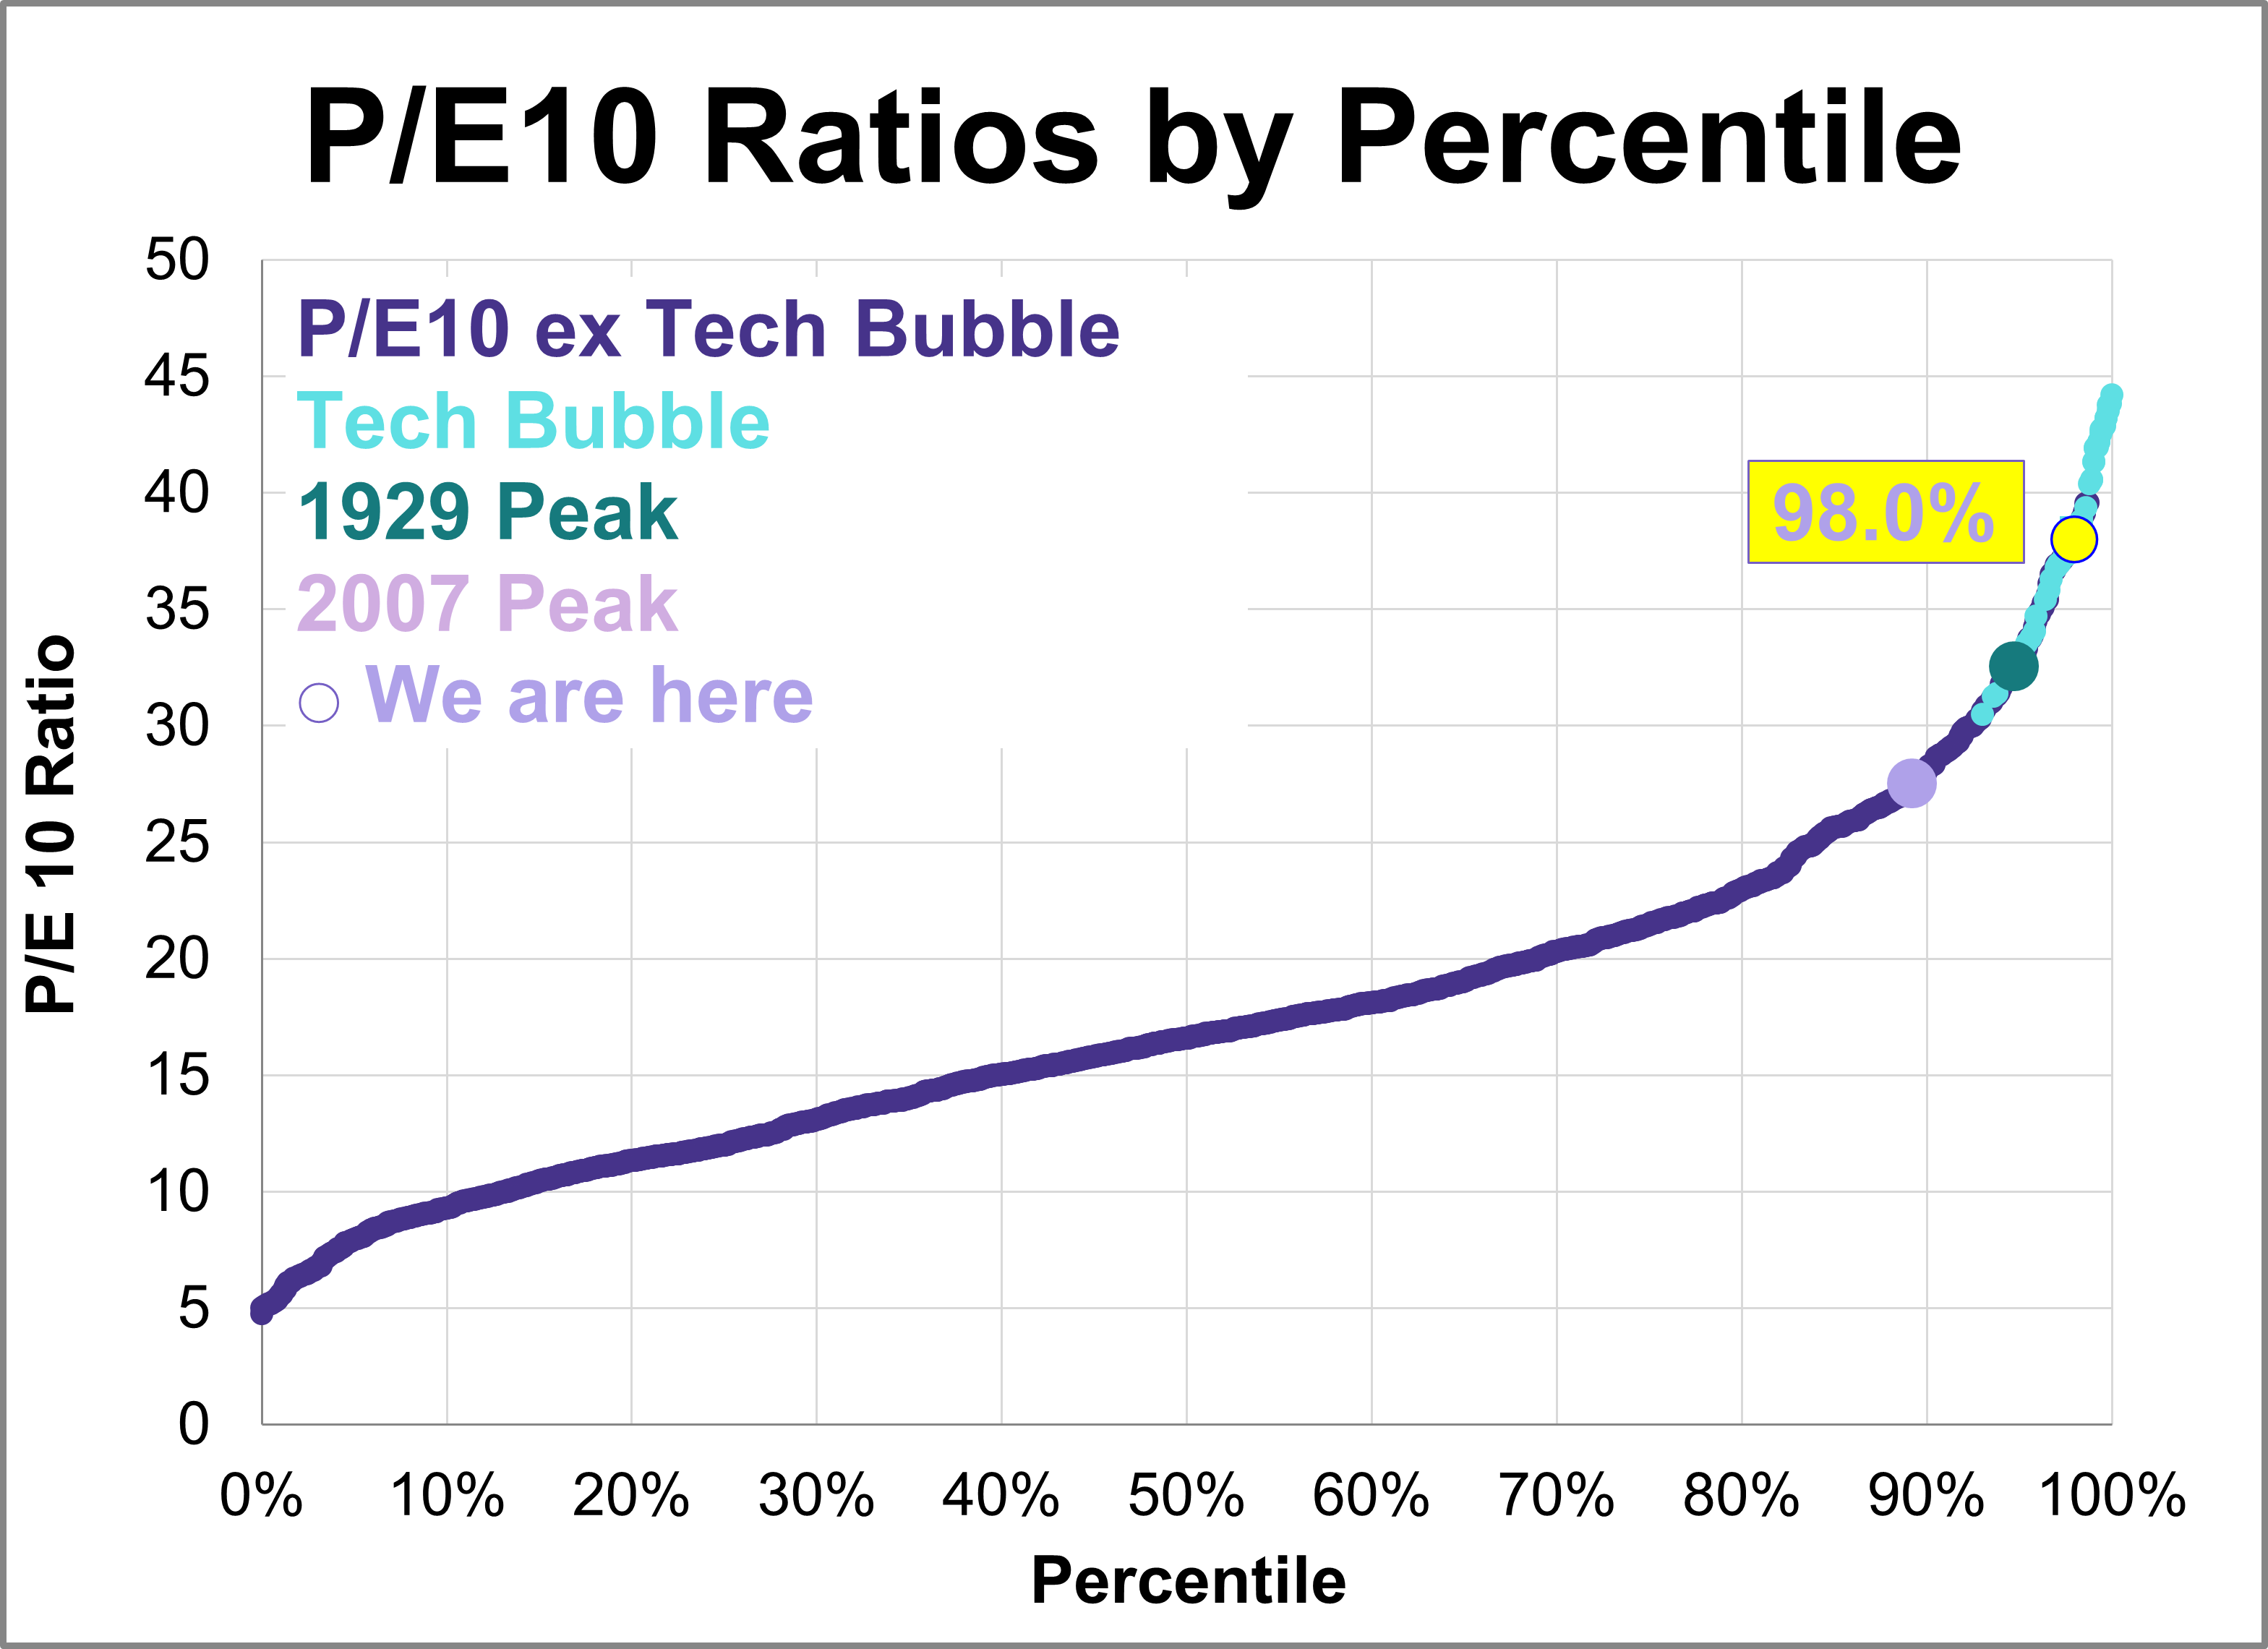
Here is the latest update of a popular market valuation method, Price-to-Earnings (P/E) ratio, using the most recent Standard & Poor's "as reported" earnings and earnings estimates, and the index monthly average of daily closes for the past month. The latest trailing twelve months (TTM) P/E ratio is 25.9 and the latest P/E10 ratio is 39.9, the highest level since 2000.
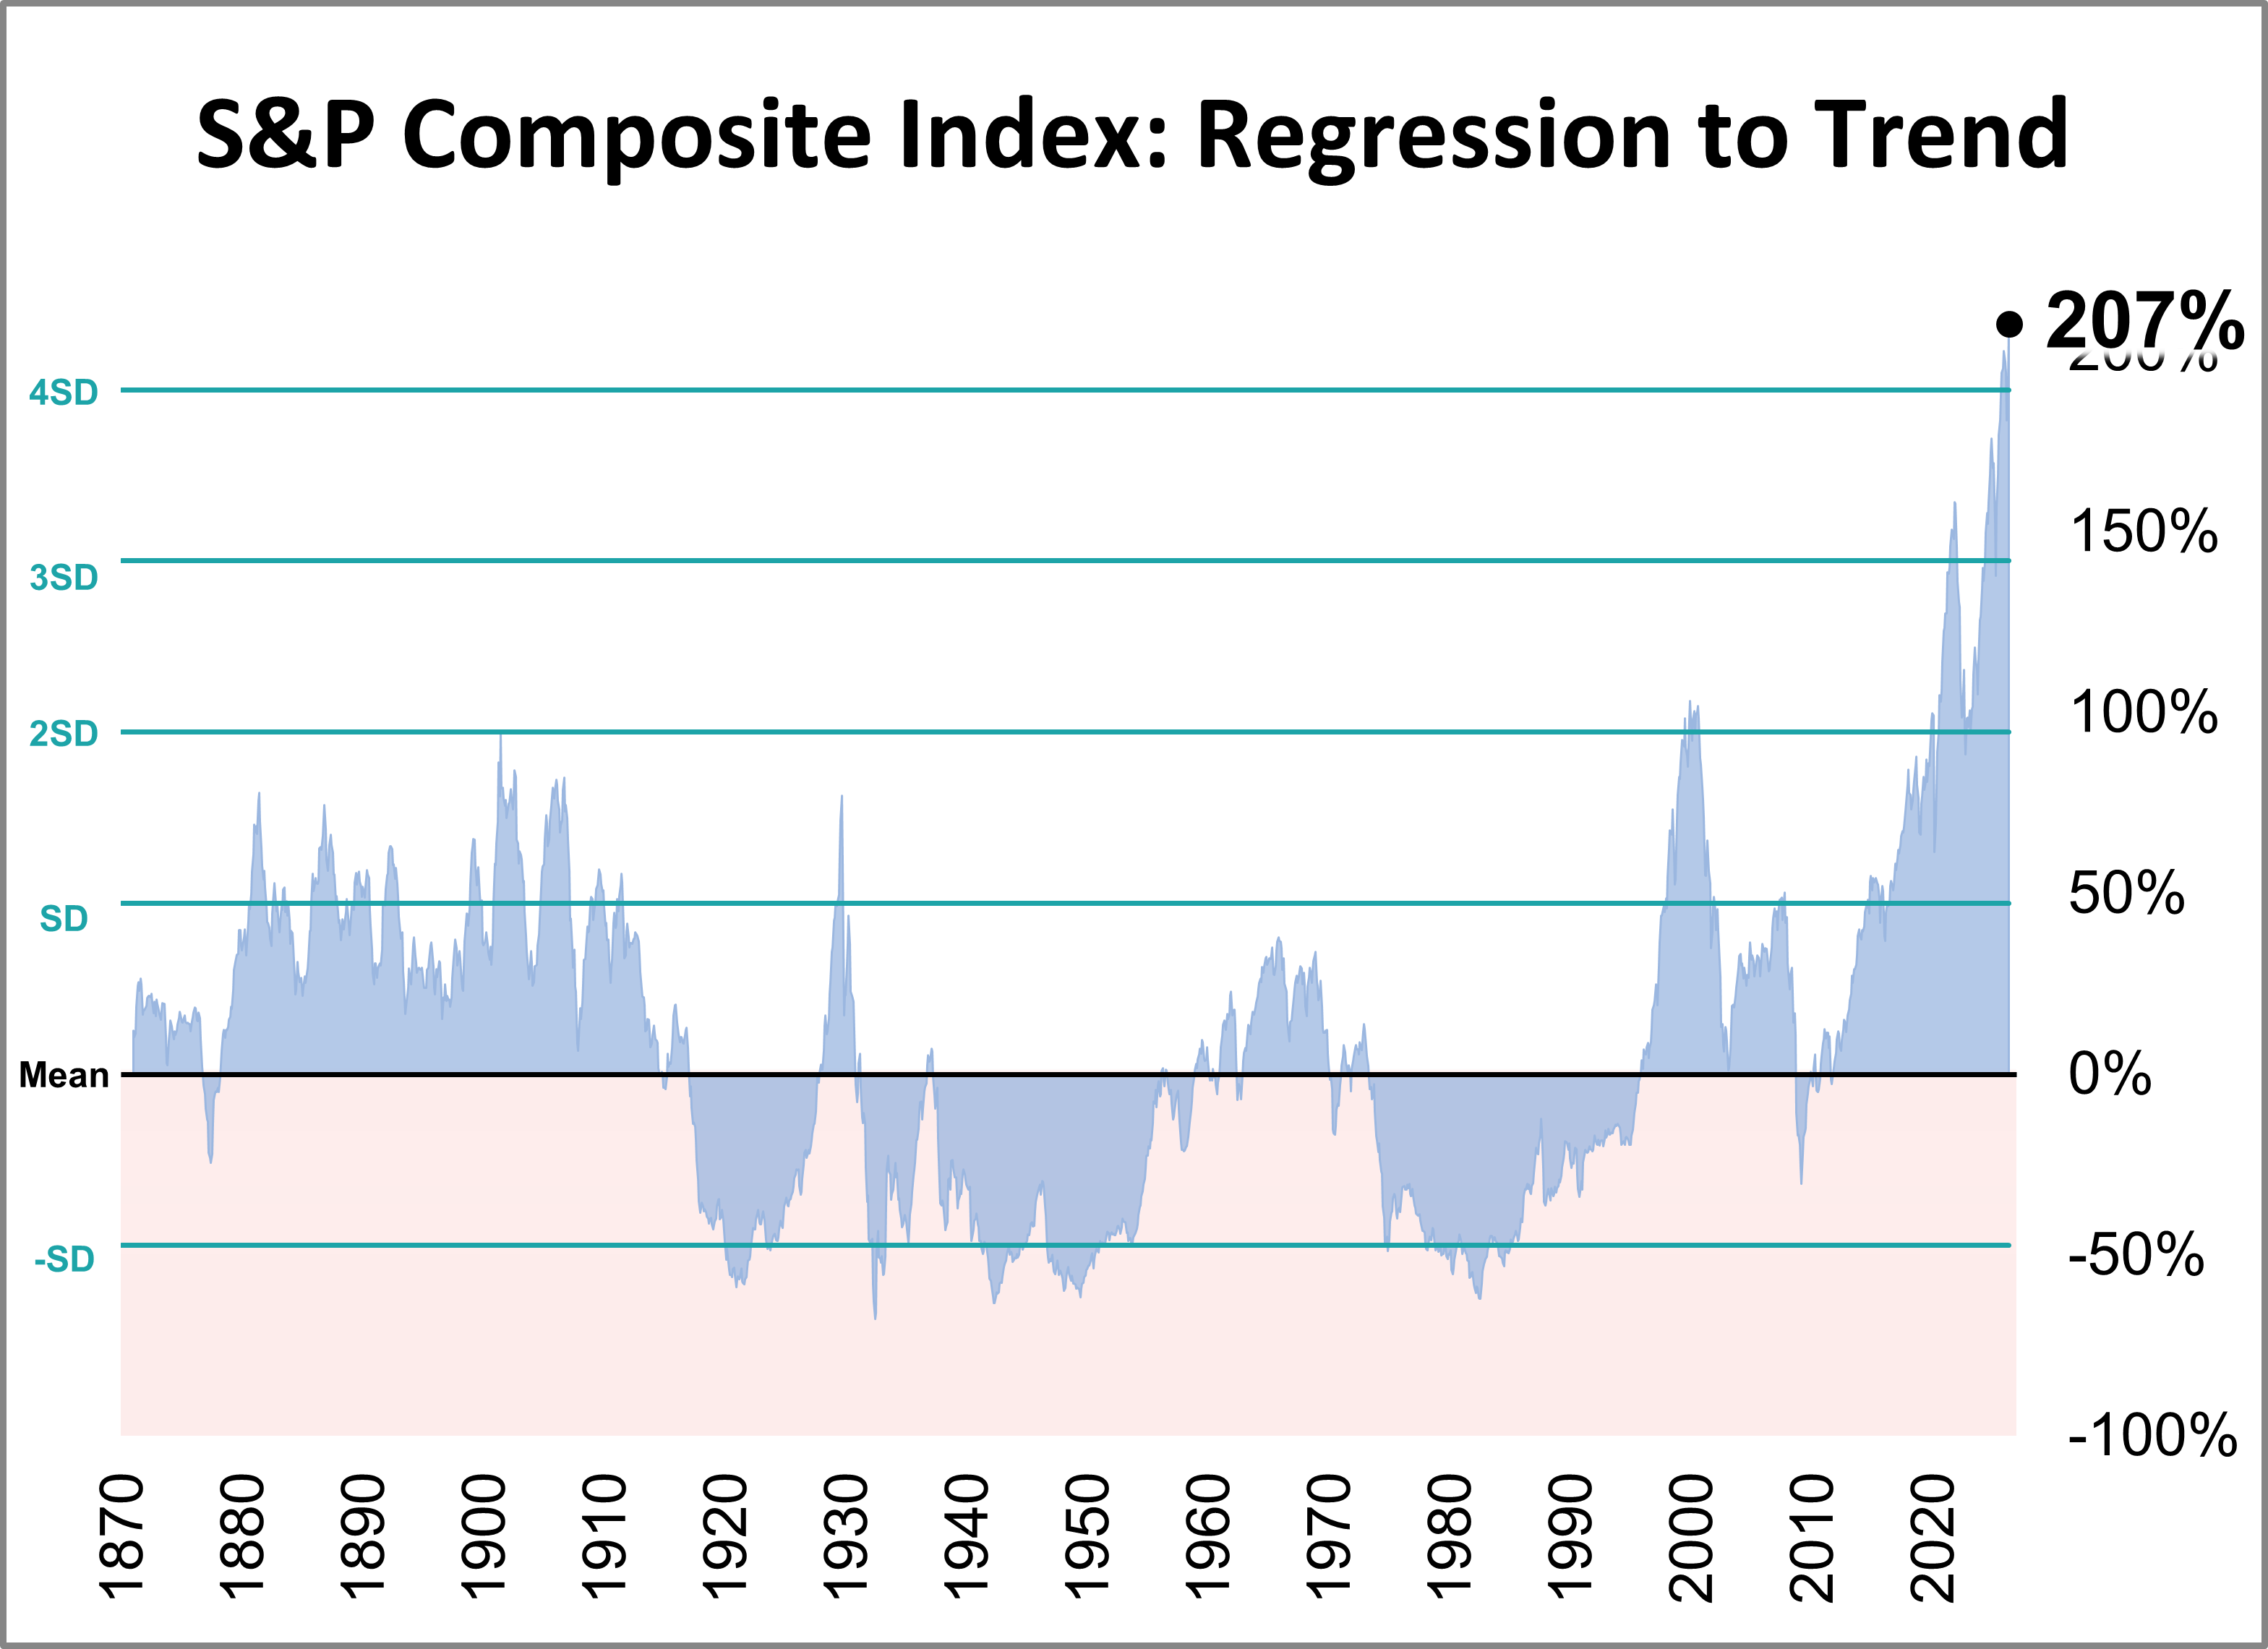
The inflation-adjusted S&P Composite Index was 207% above its long-term trend at the end of May.
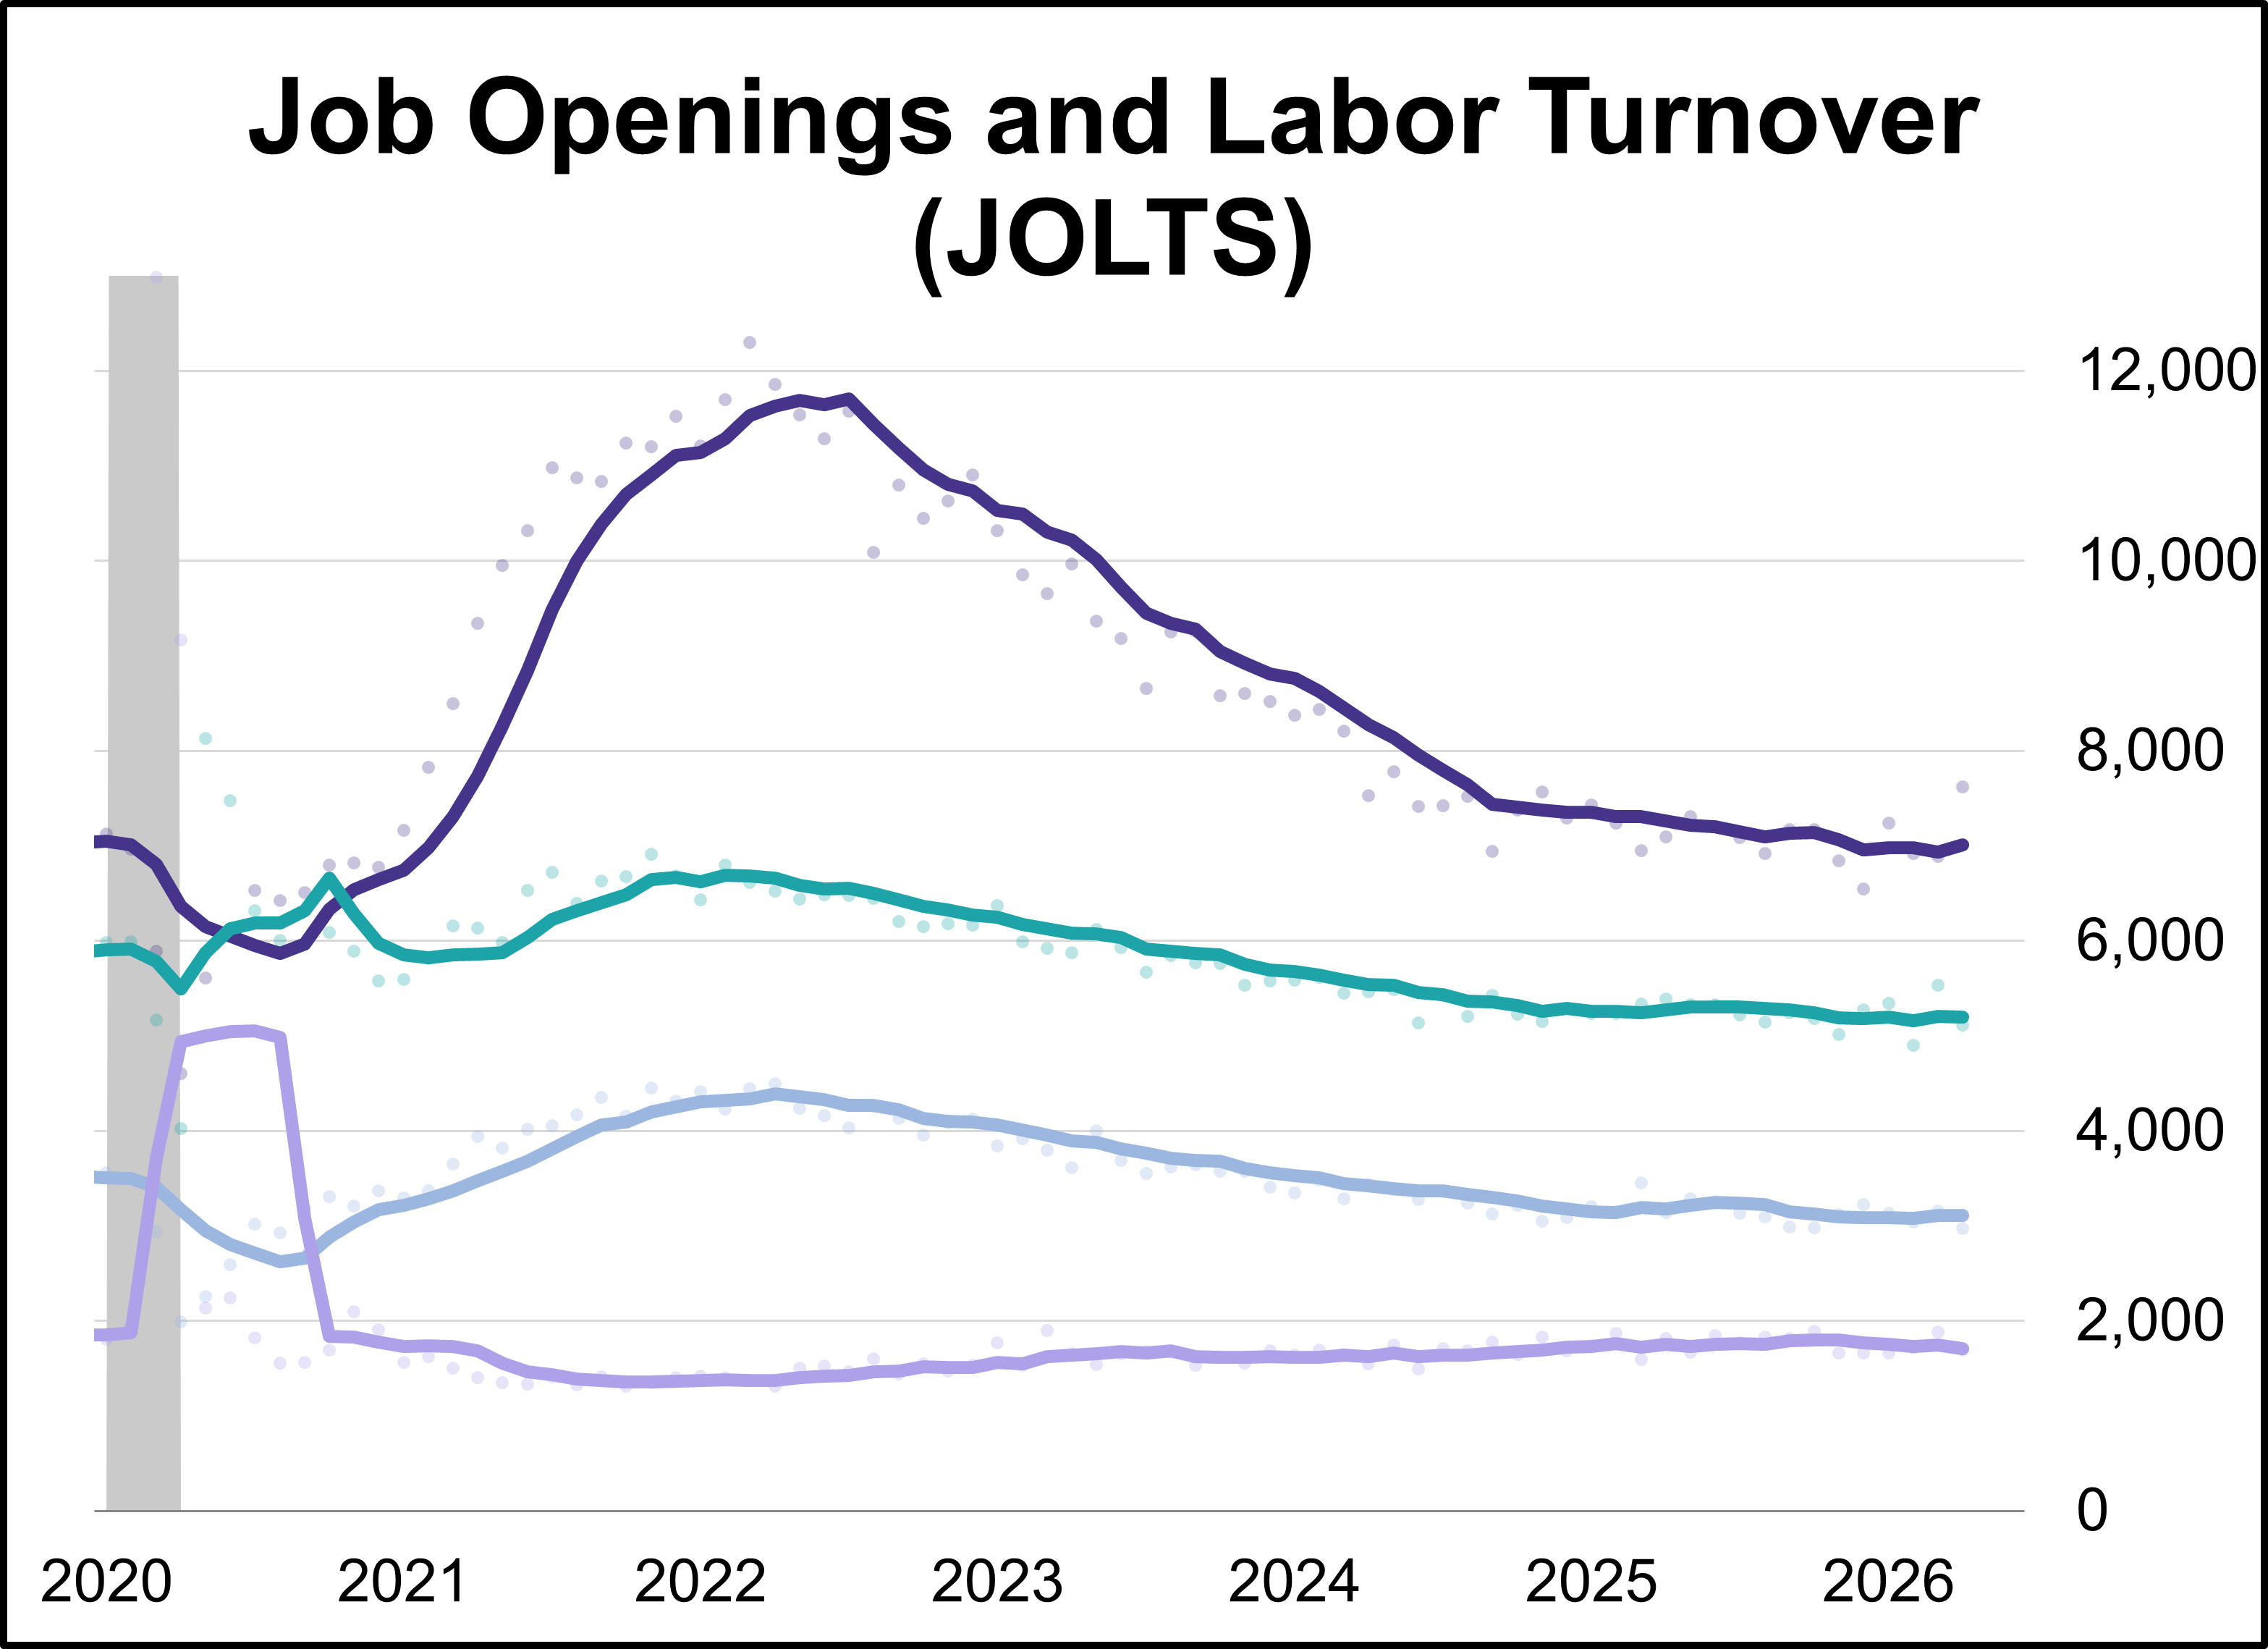
Job openings jumped to their highest level in nearly two years in April, reaching 7.618 million vacancies according to the latest Job Openings and Labor Turnover Survey (JOLTS). This represents an increase of 731,000 from the previous month, the largest monthly rise since 2021.
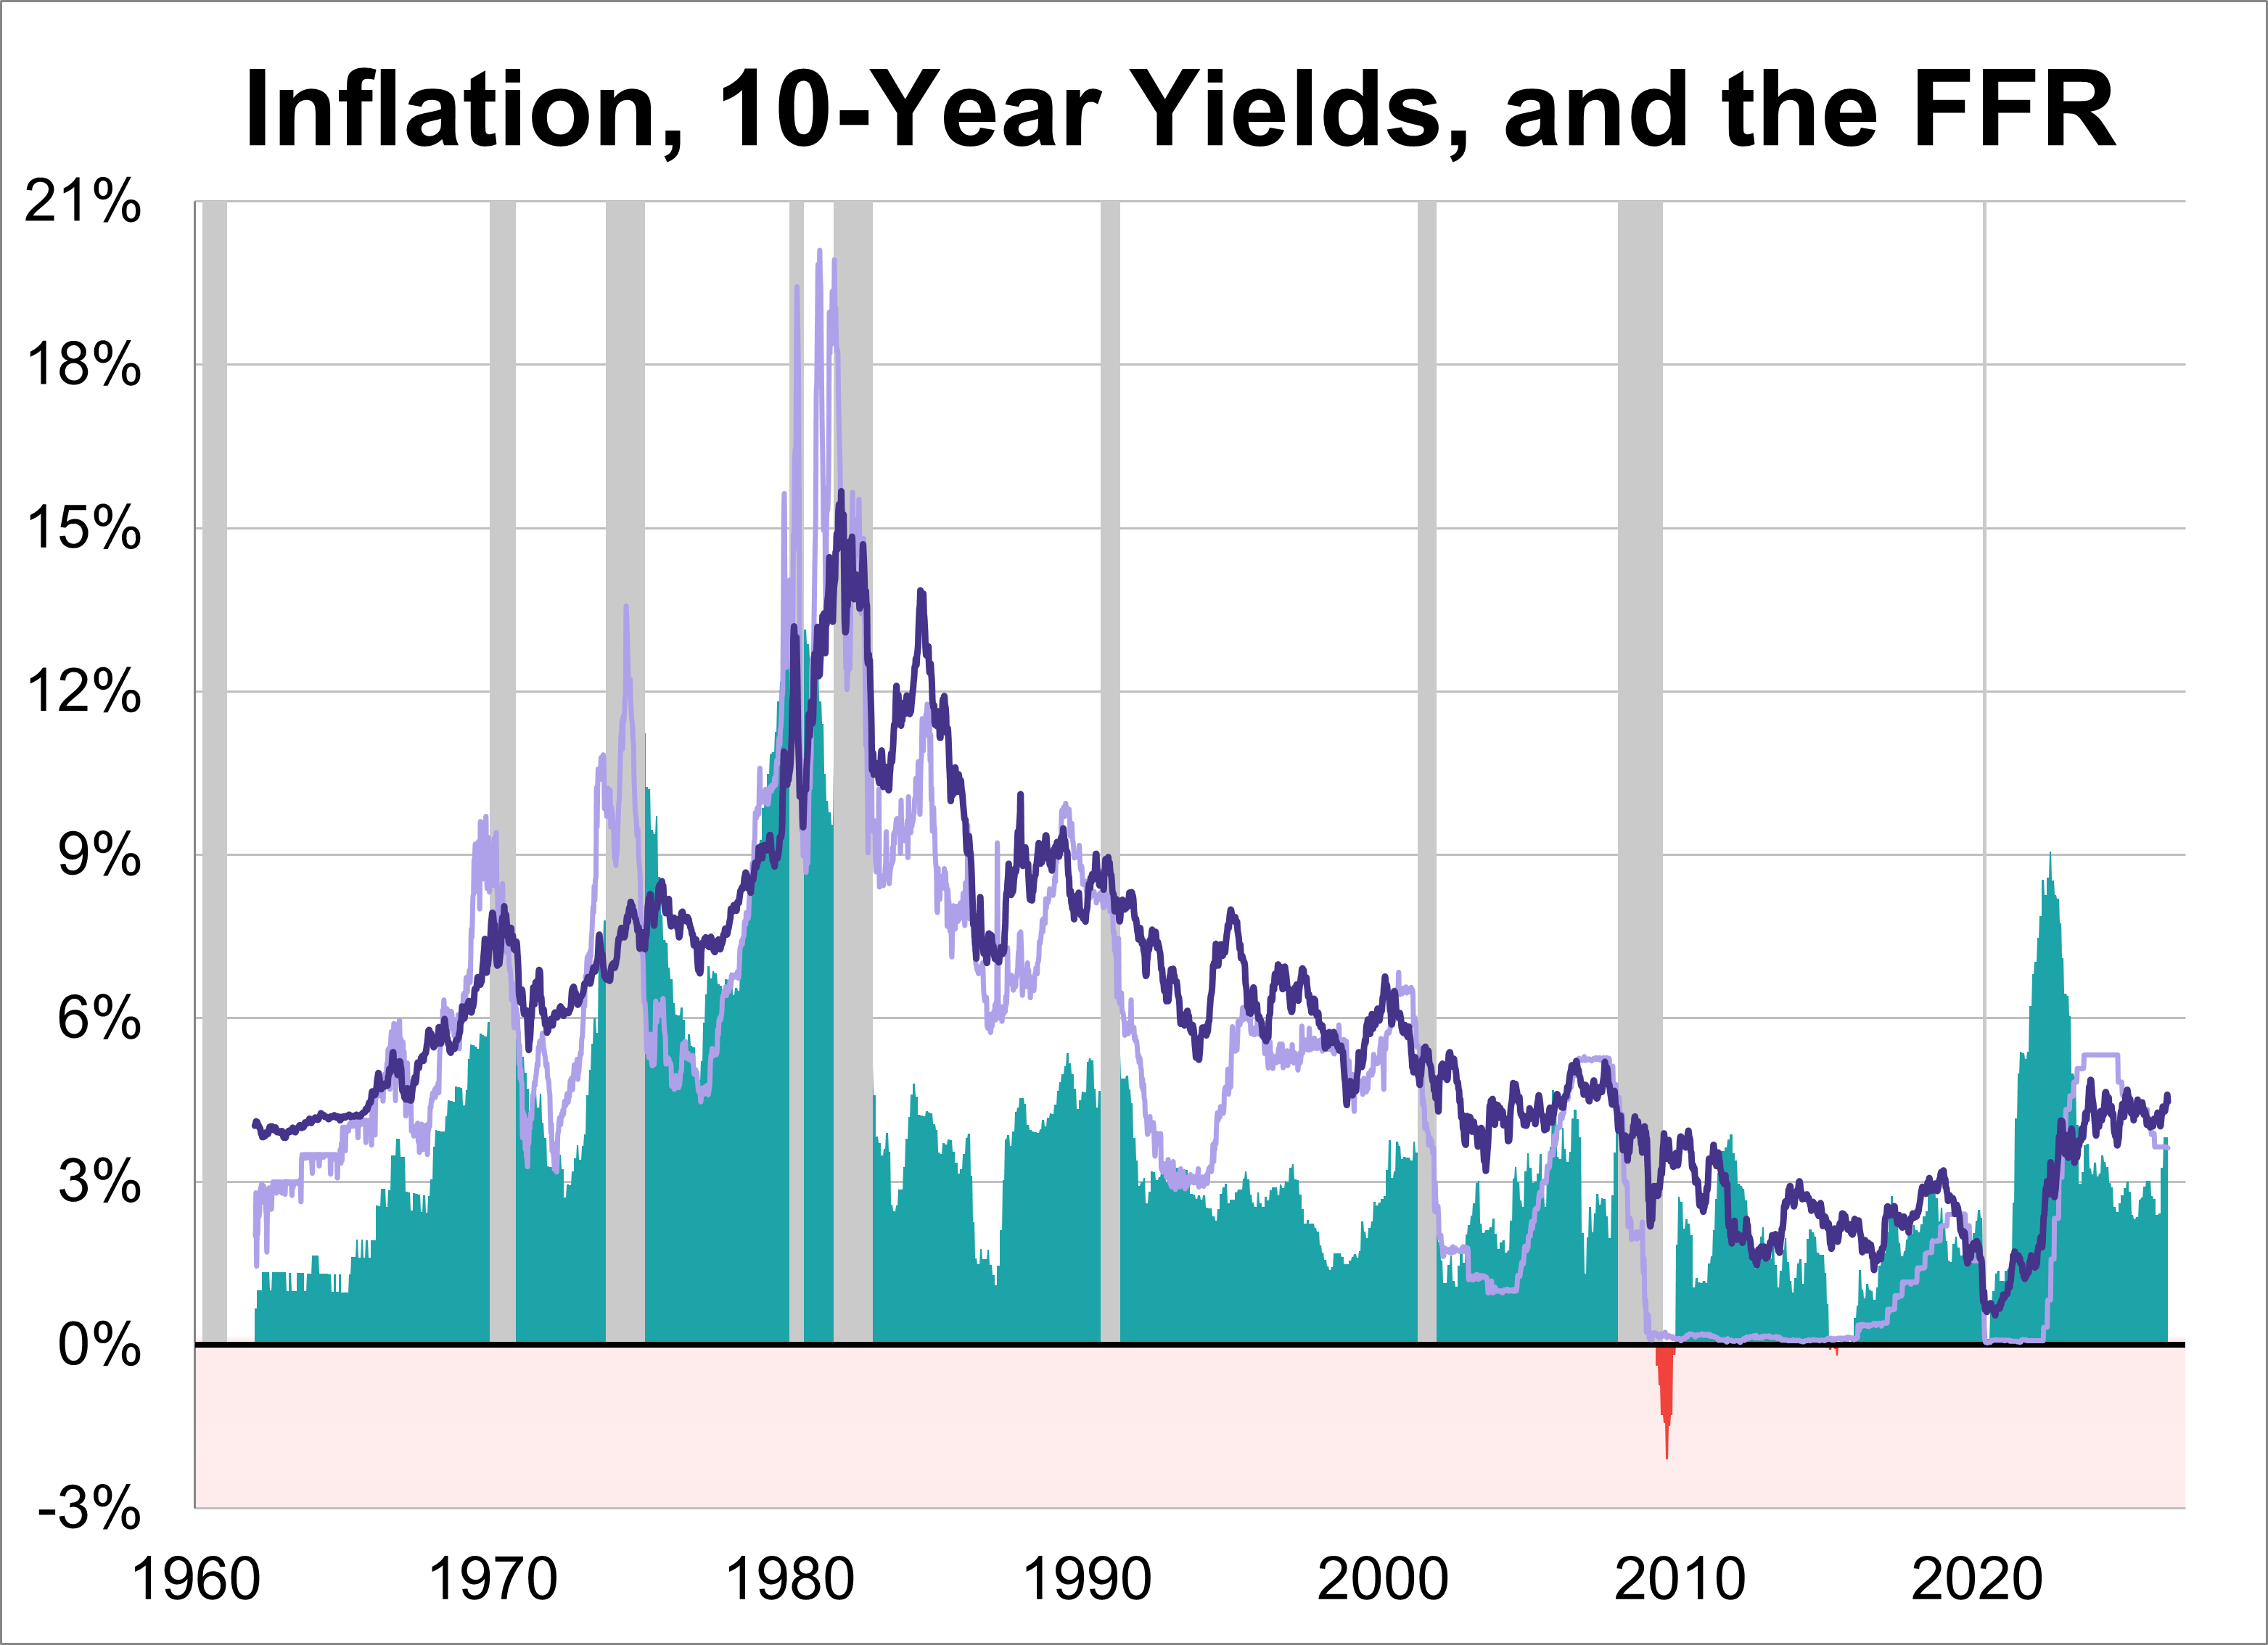
The 10-year Treasury yield has experienced dramatic fluctuations, ranging from a peak of 15.68% in October 1981, during the height of the Volcker era, to a historic low of 0.55% in August 2020, amidst the economic uncertainty of the pandemic. At the end of May 2026, the weekly average stood at 4.47%.
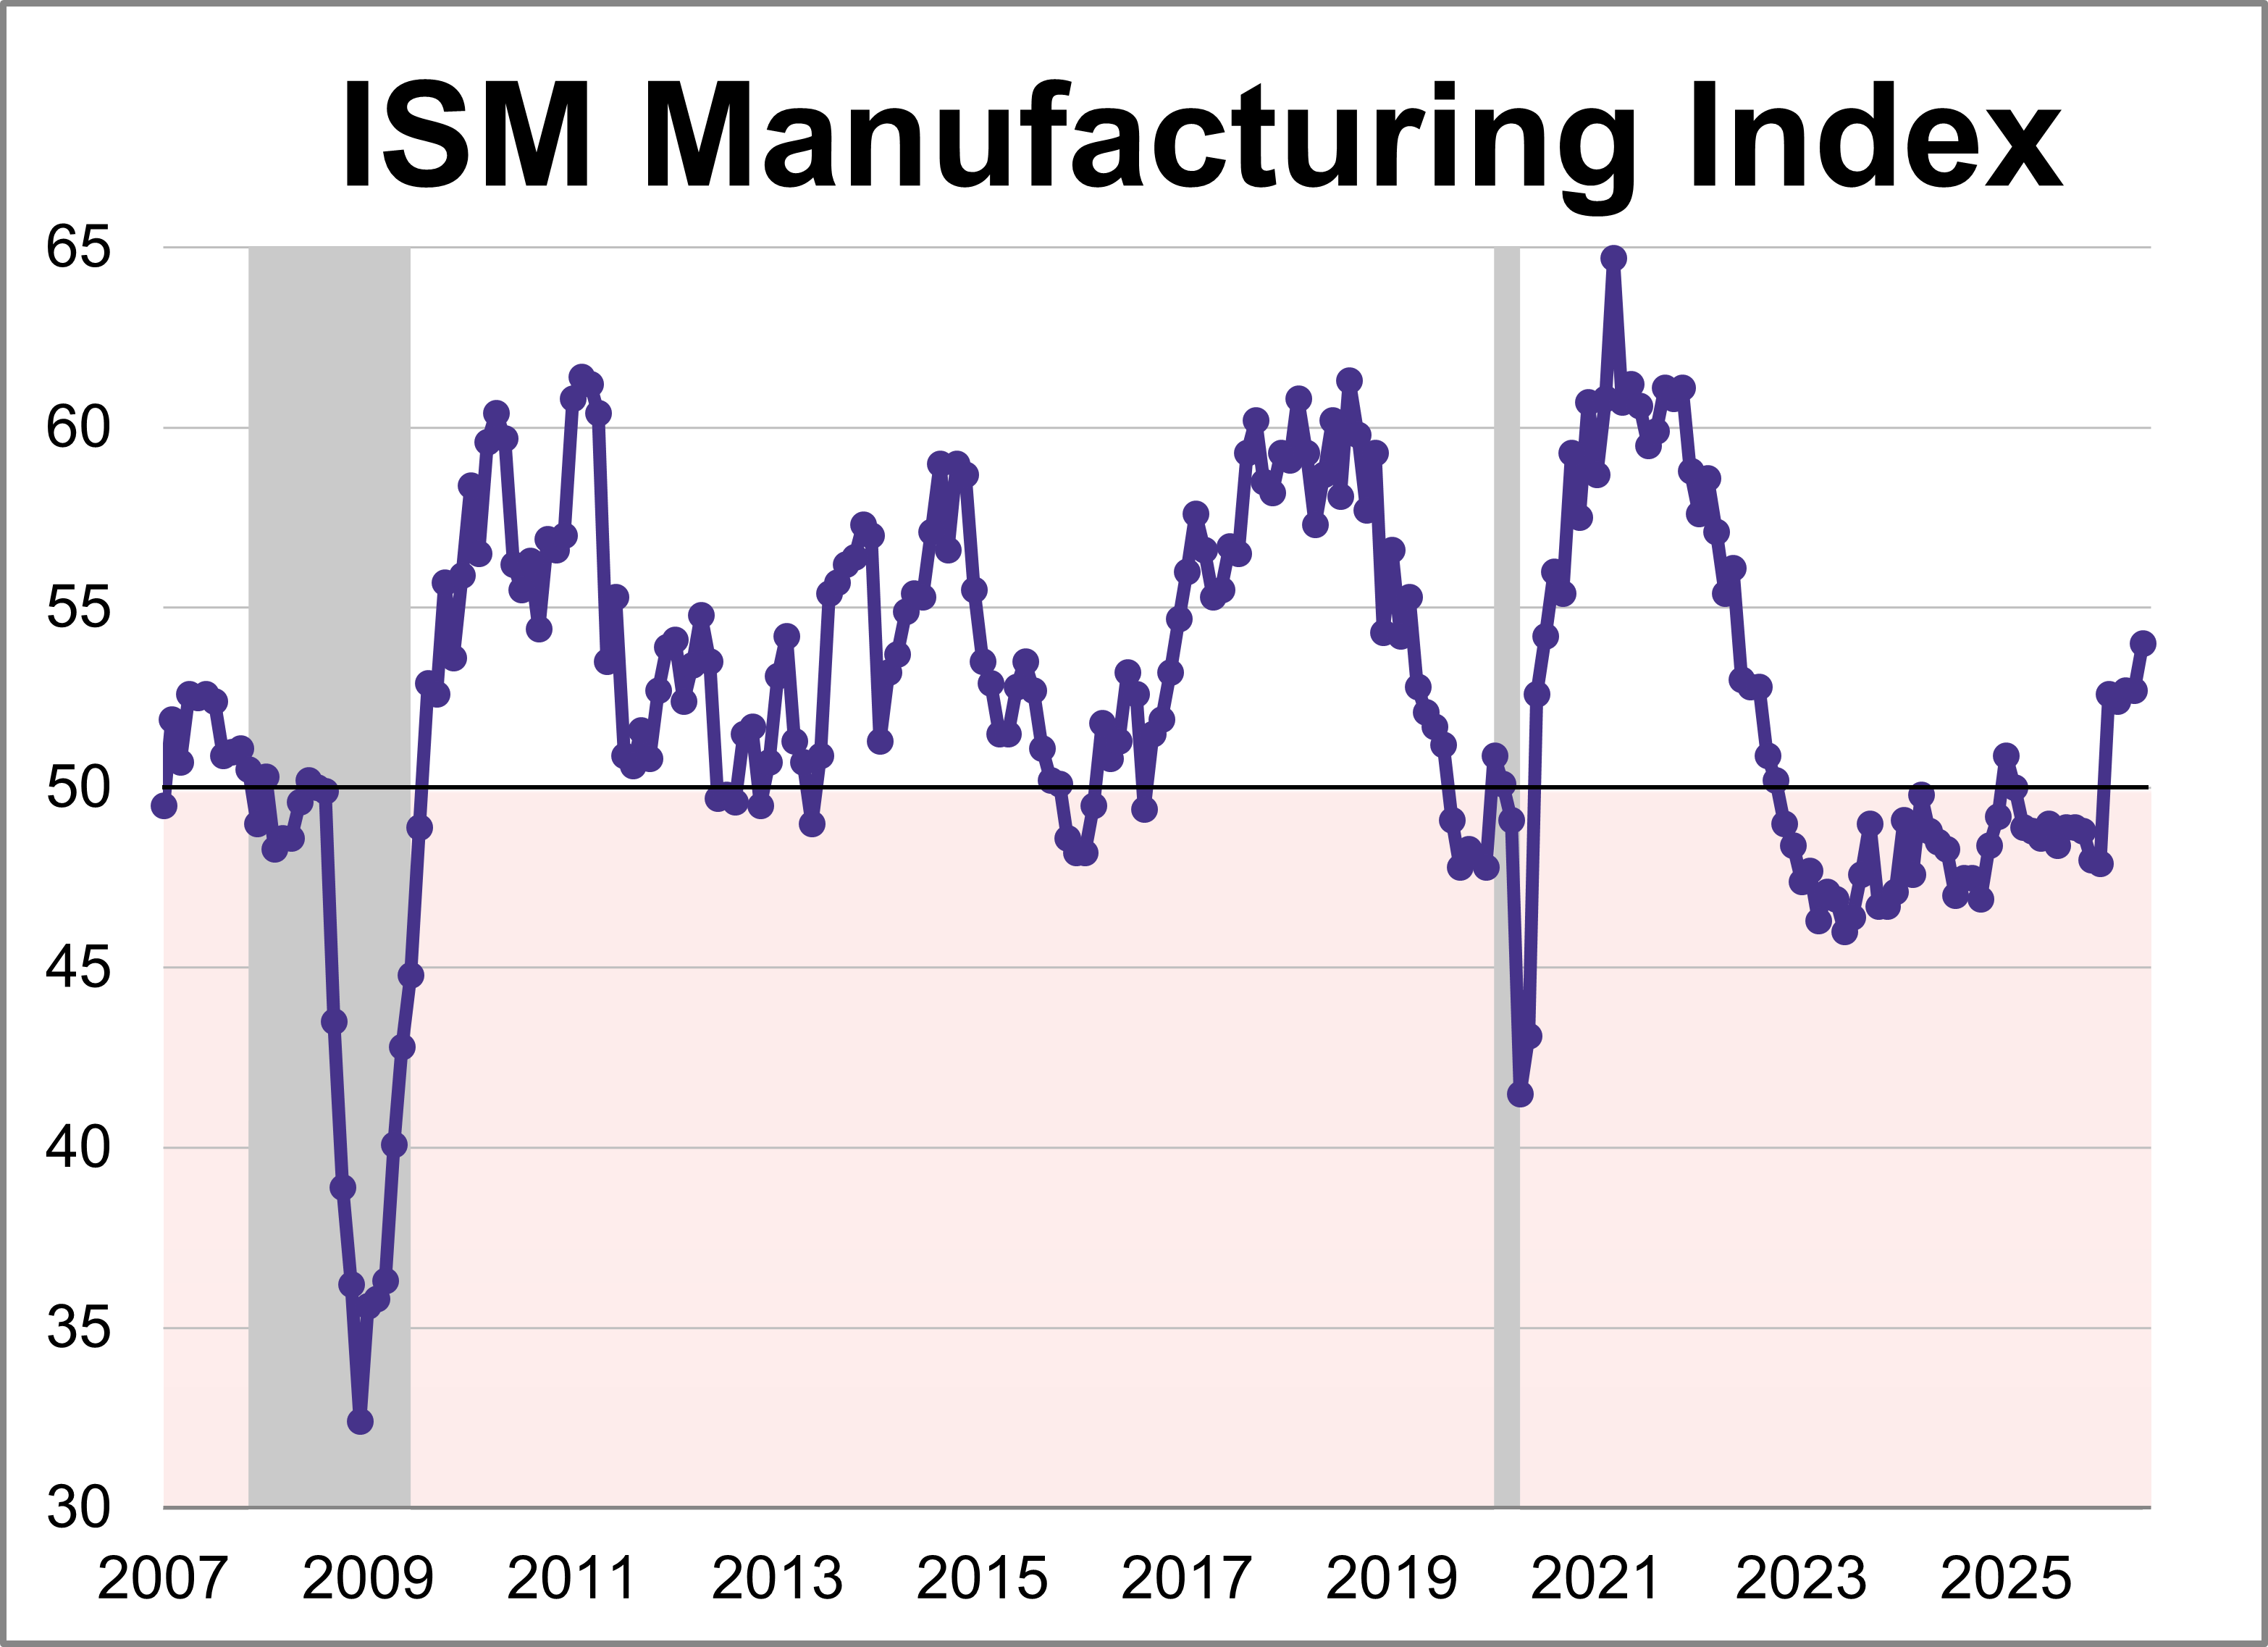
The Institute for Supply Management (ISM) manufacturing purchasing managers index (PMI) came in at 54.0 in May, marking the fastest expansion for the index since May 2022. The latest reading was higher than the 53.3 forecast and is the index's fifth straight month in expansion territory.
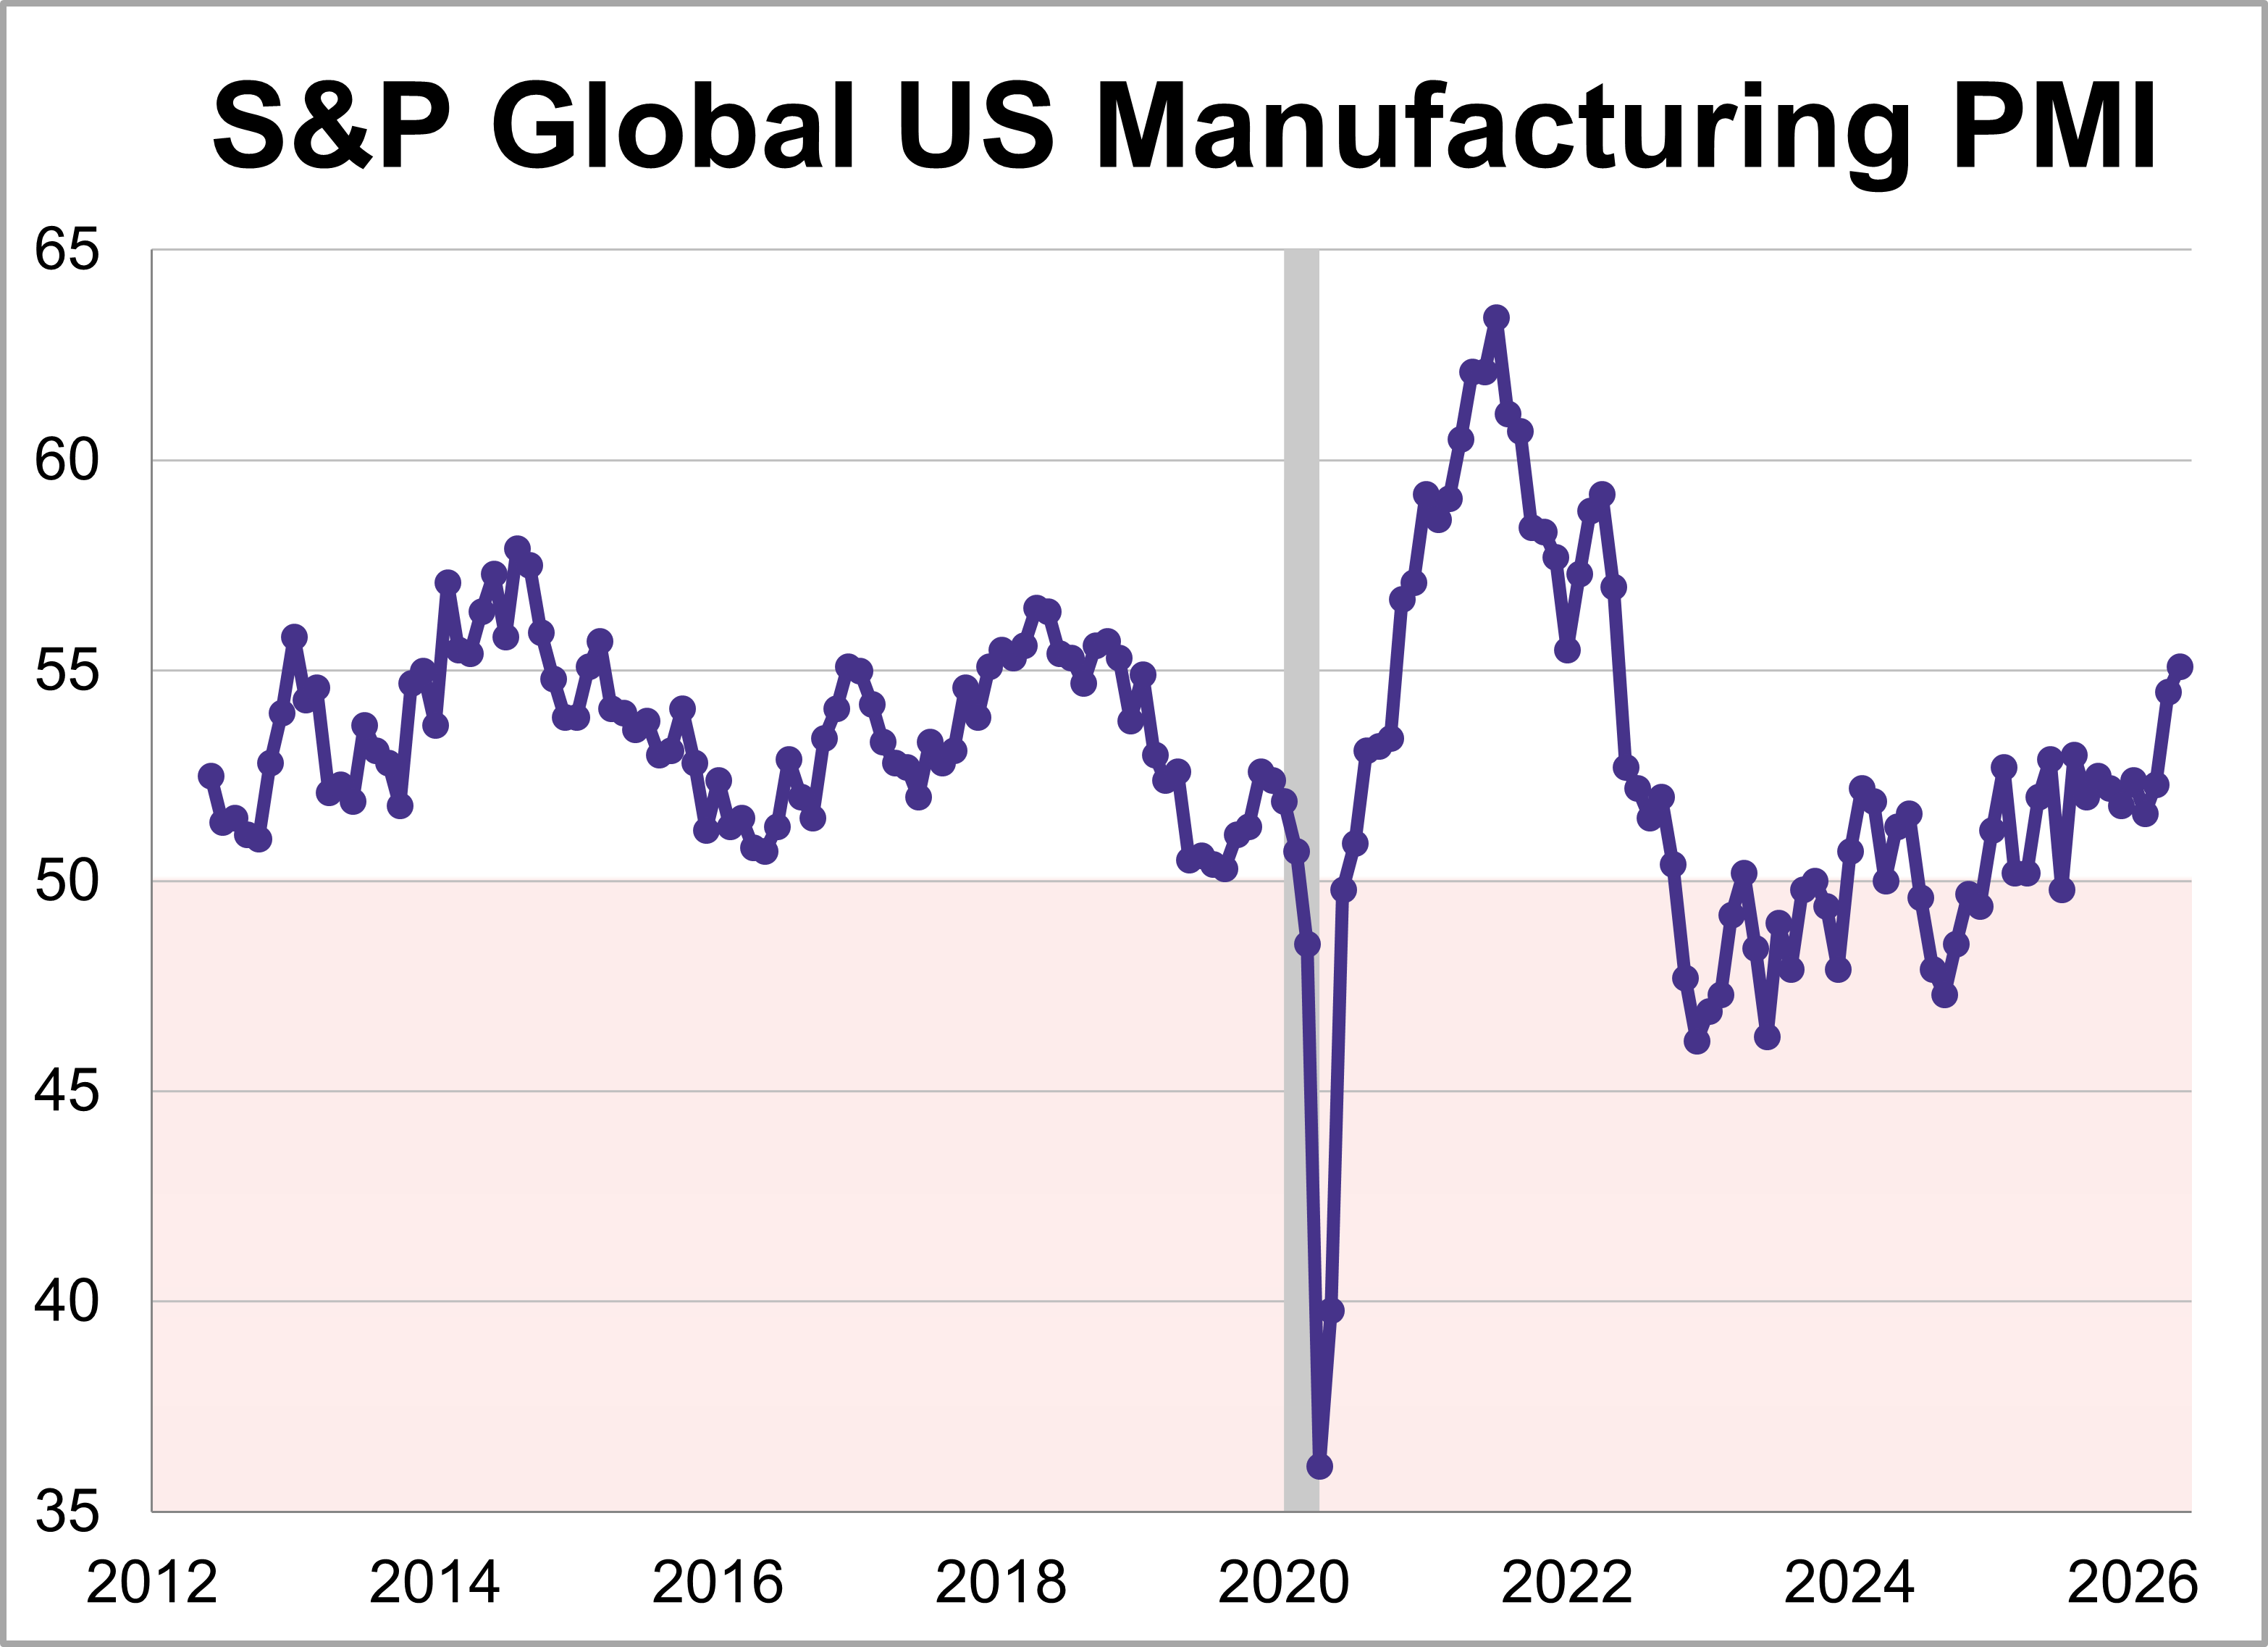
U.S. manufacturing hit its highest level in four years, as the S&P Global PMI climbed 0.6 points to 55.1 in May. For a second straight month, the expansion was largely driven by defensive stockpiling as companies continue bracing for supply disruptions and price hikes linked to conflict in the Middle East.
Last week’s data tracked a shifting economic trajectory over the last several months. While the latest reading on first-quarter GDP confirms the economy started the year with steady growth, subsequent inflation metrics moved higher and ultimately weighed on consumer confidence.
Valid until the market close on June 30, 2026
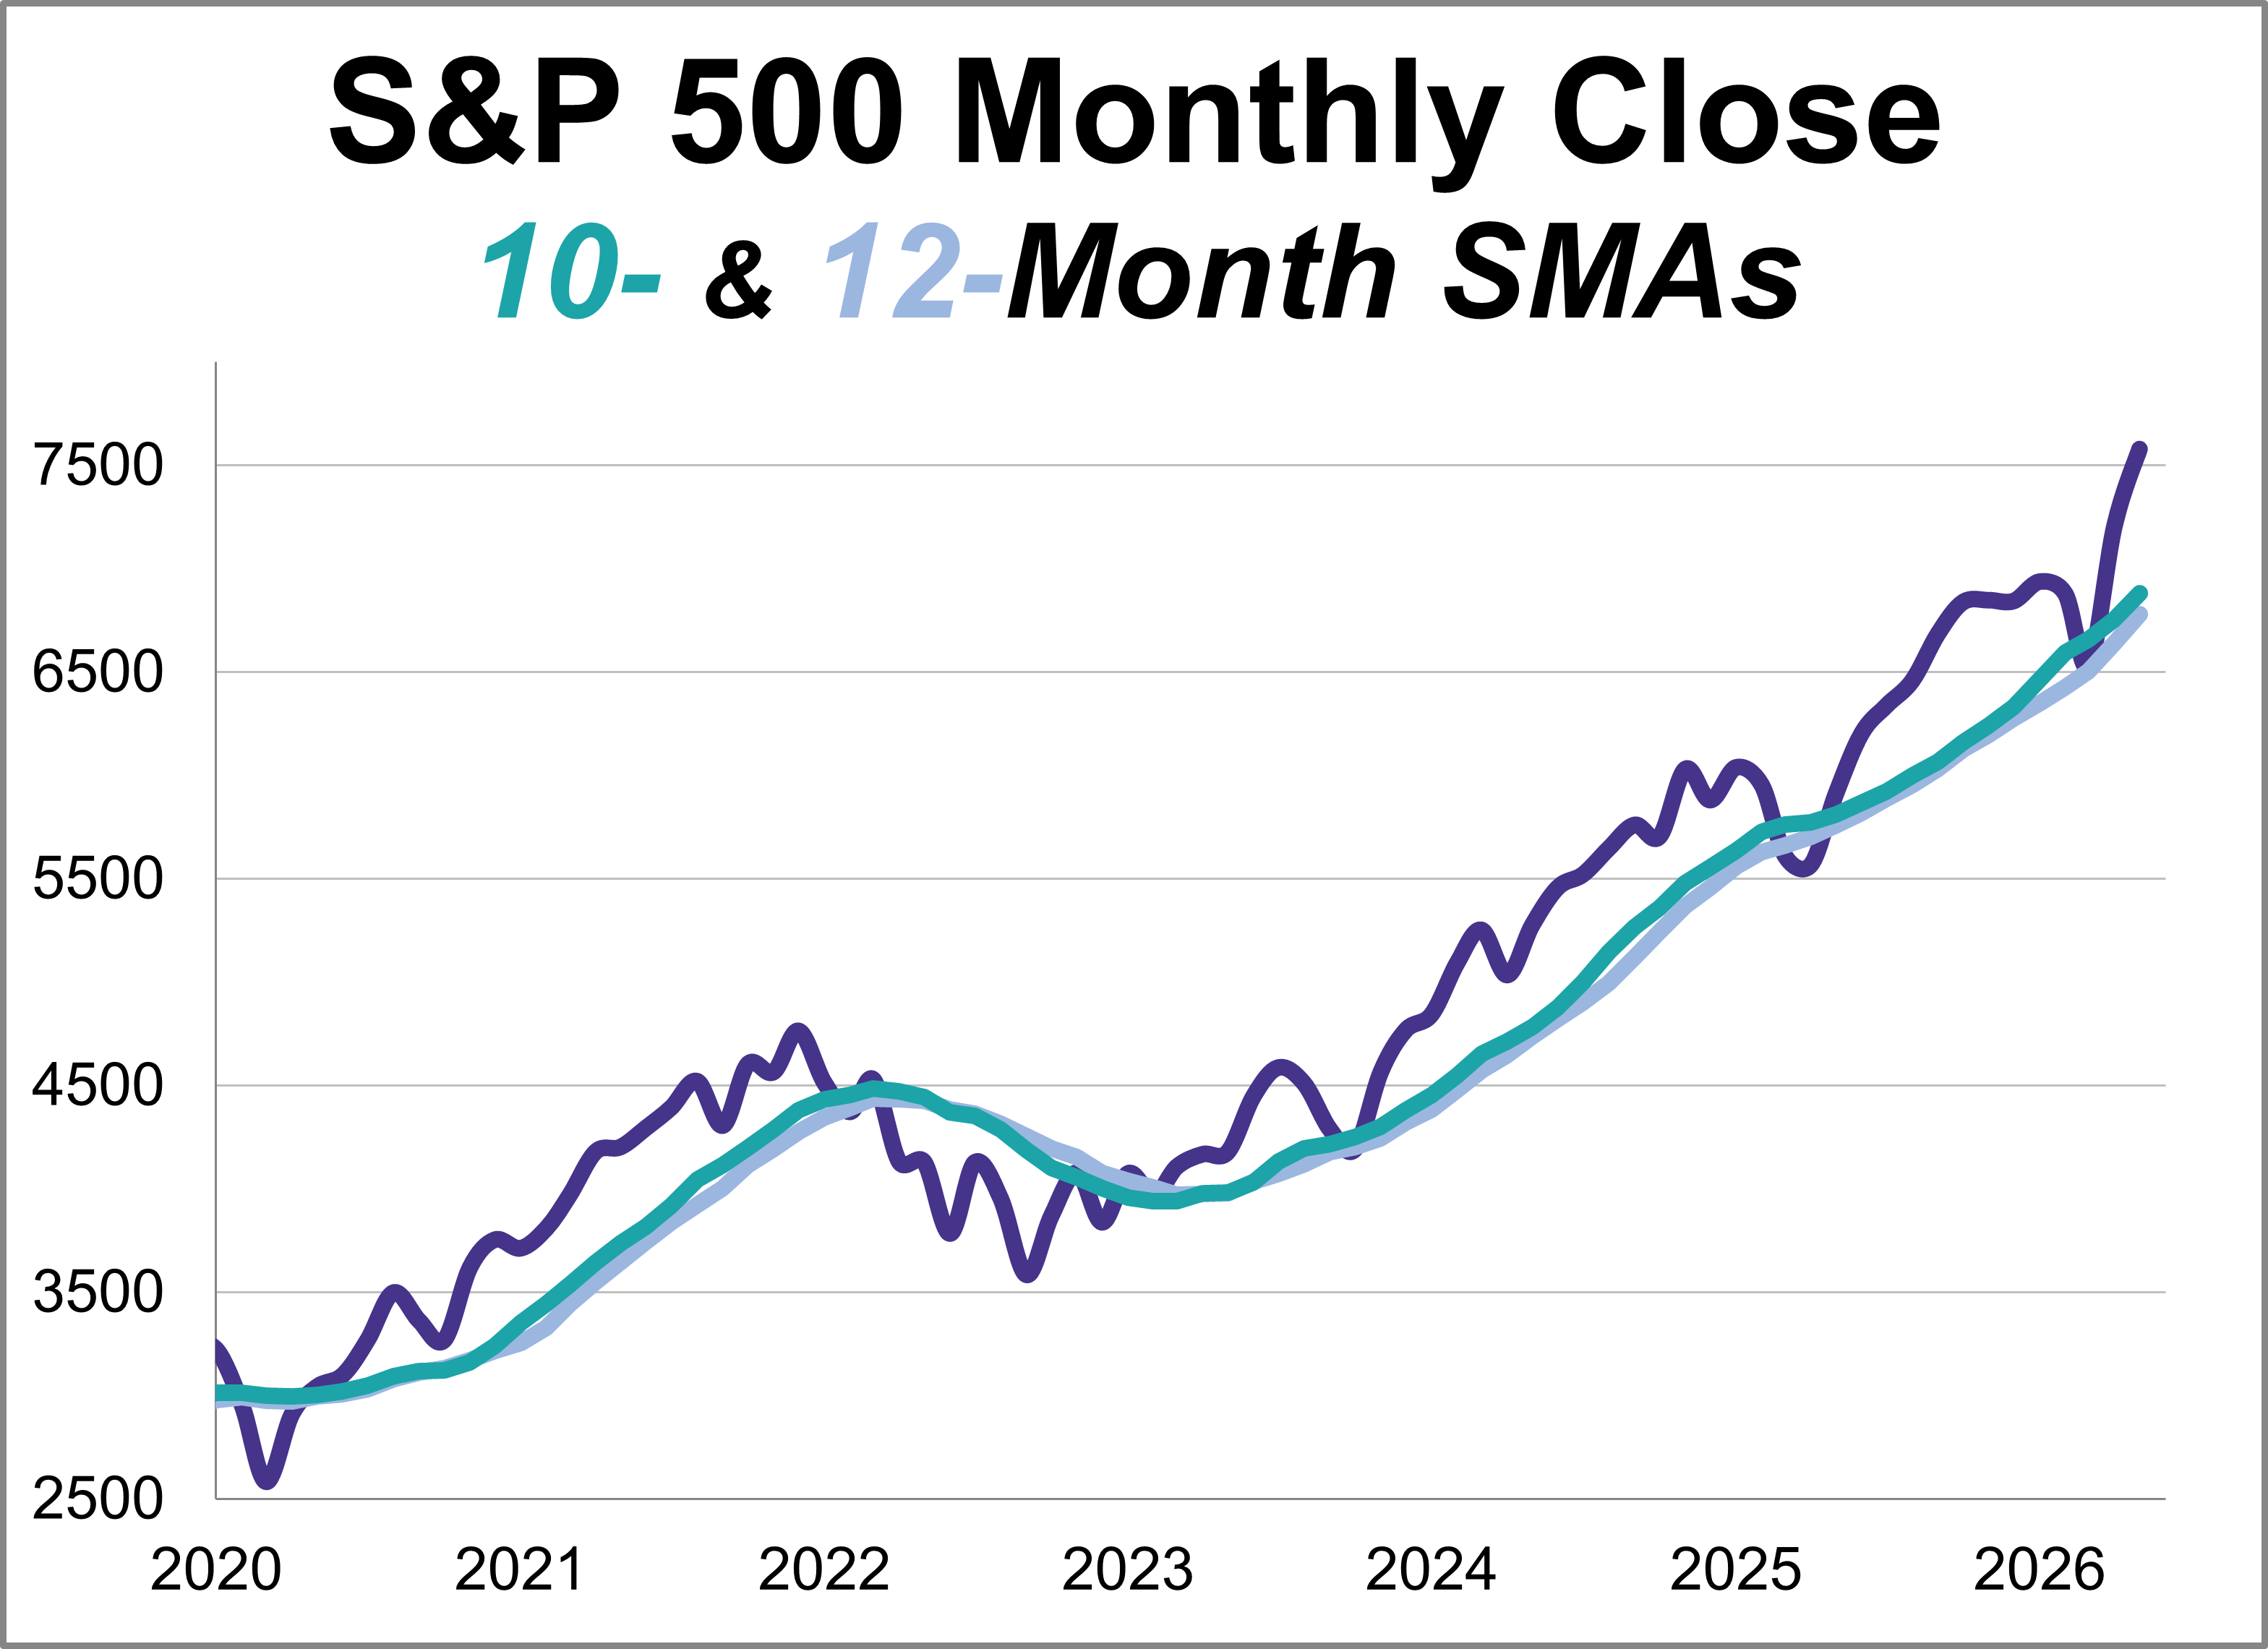
This article provides an update on the monthly moving averages we track for the S&P 500 and the Ivy Portfolio after the close of the last business day of the month.
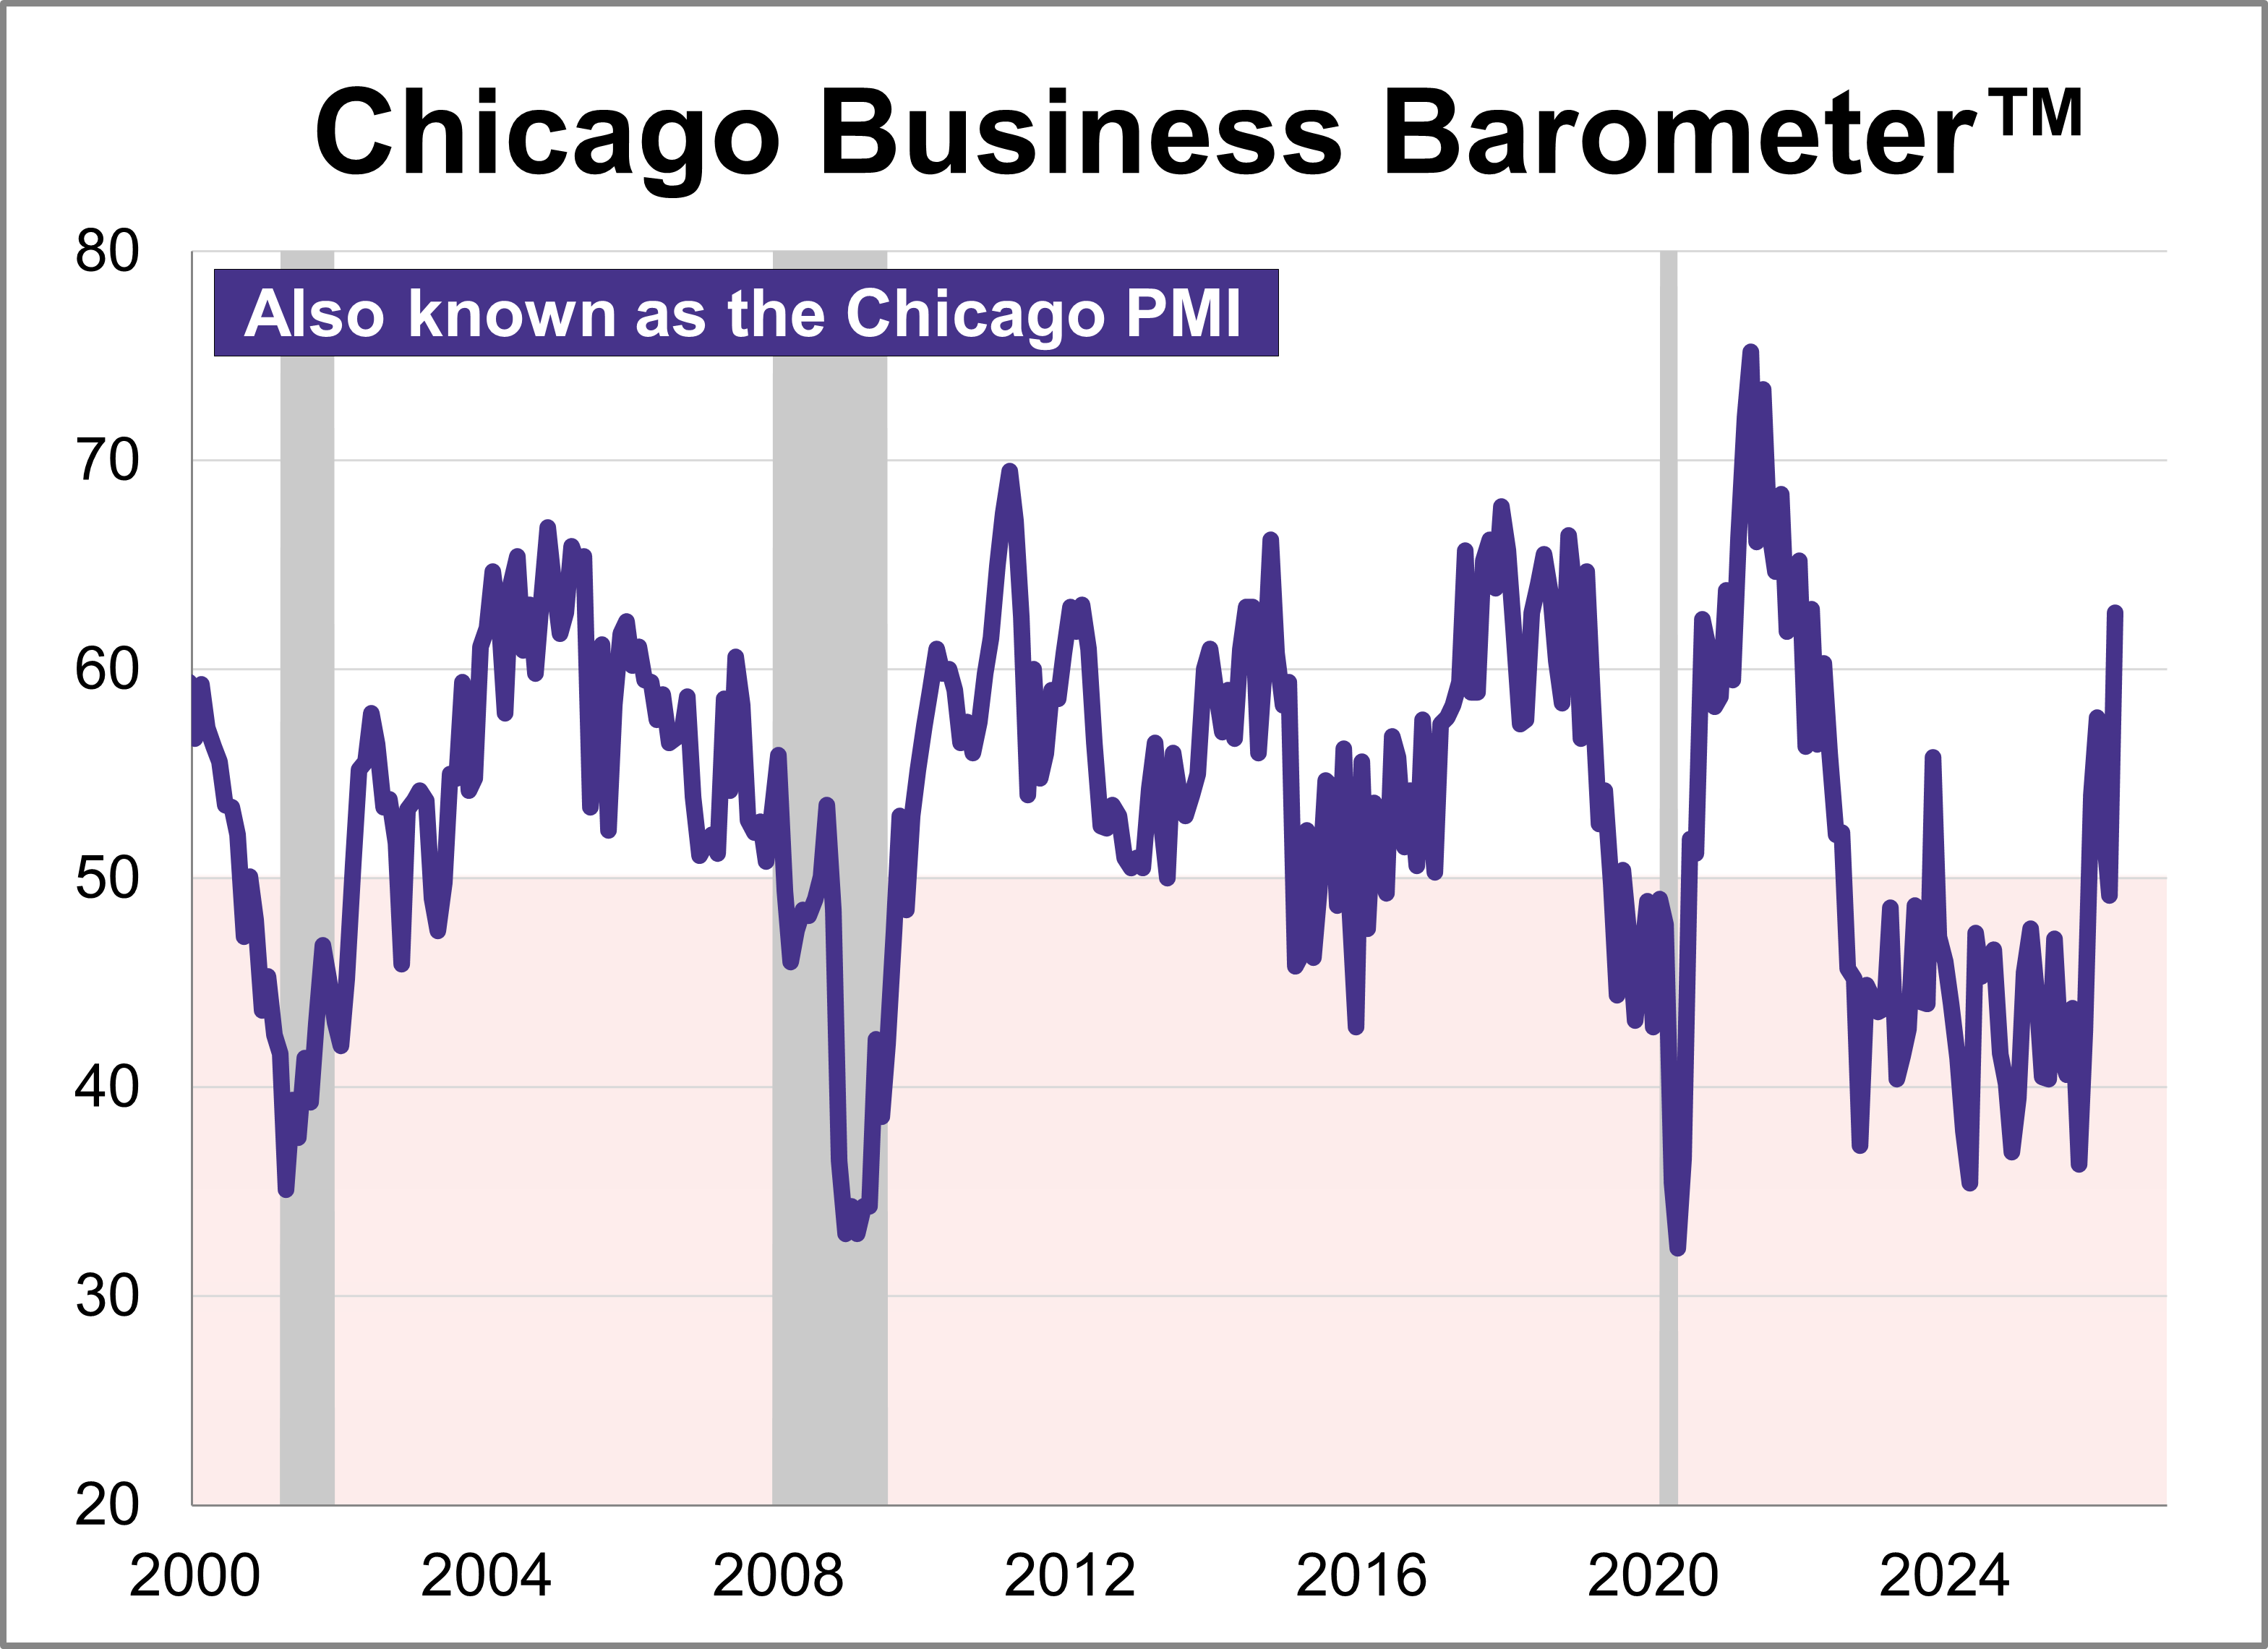
The Chicago Purchasing Managers’ Index surged 13.5 points in May to a four-year high of 62.7, signaling an expansion in regional business activity. This marks the largest monthly increase since 2020 and was significantly higher than the projected 50.6.
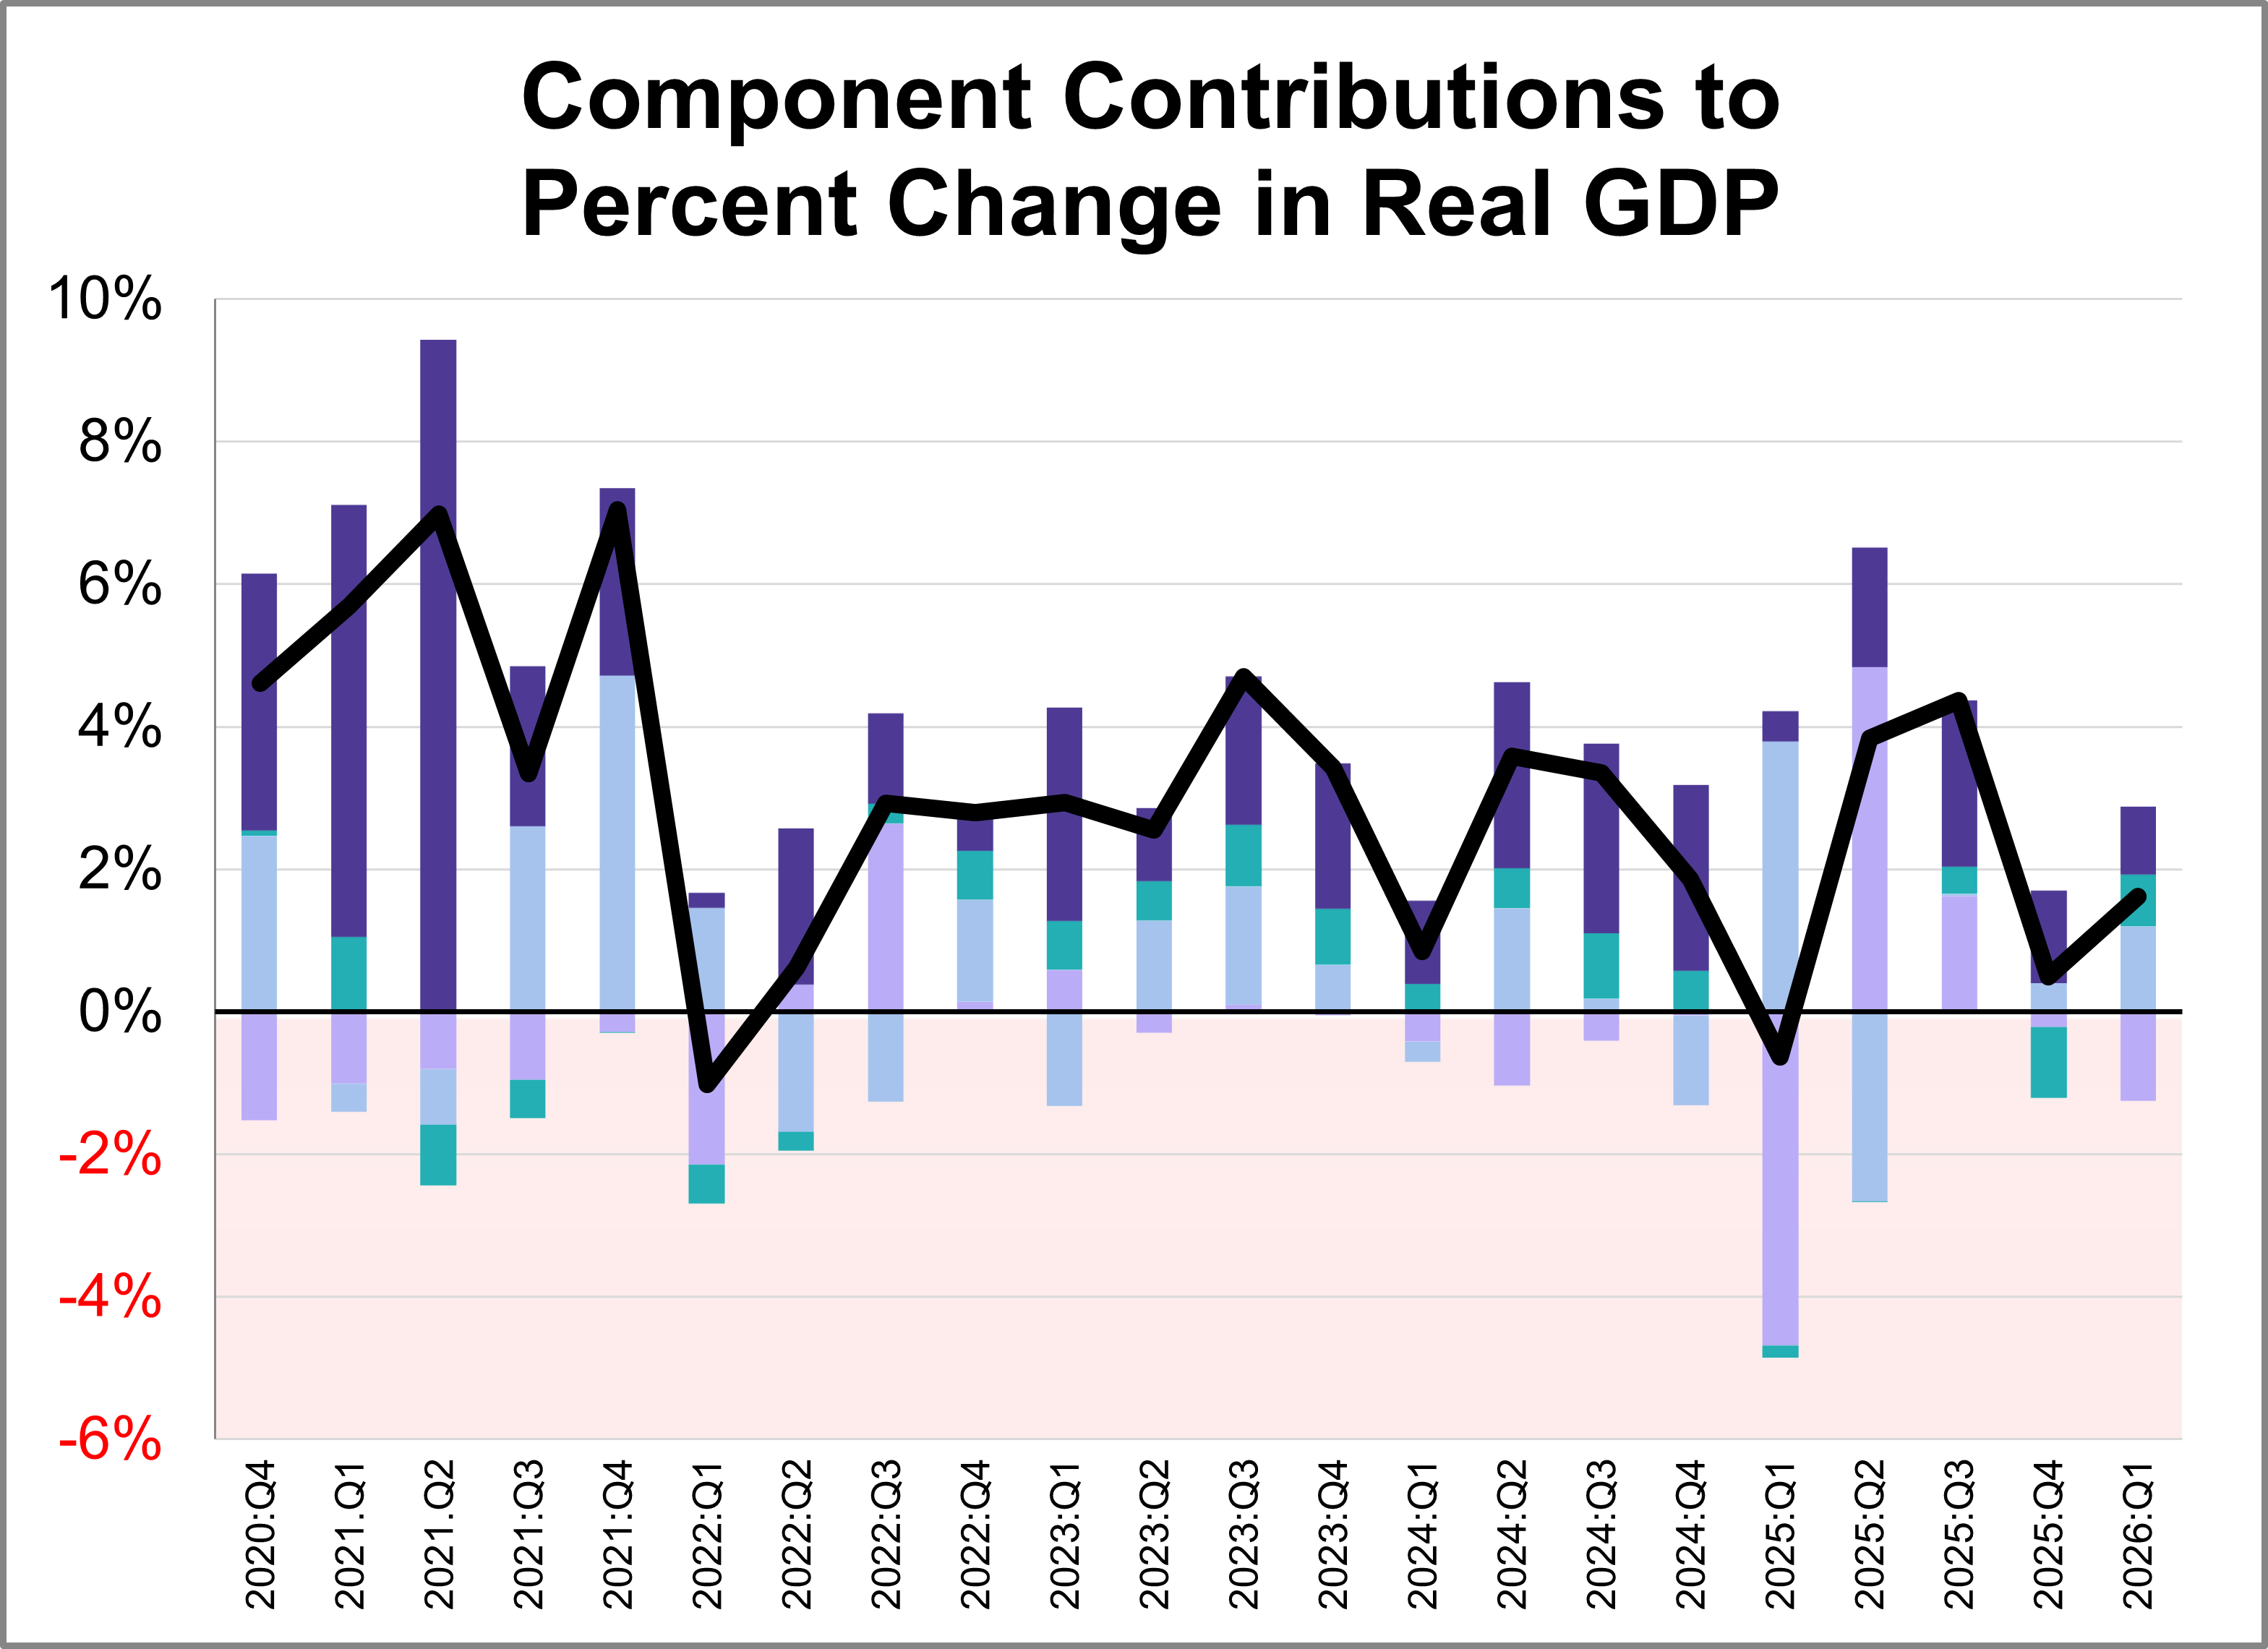
The second estimate for Q1 GDP came in at 1.62%, an acceleration from 0.48% for the Q4 final estimate. With a per-capita adjustment, the headline number is lower at 1.44%, a pickup from 0.18% for the Q4 headline number.
Real gross domestic product (GDP) is comprised of four major subcomponents. In the Q1 2026 GDP second estimate, three of the four components made positive contributions.
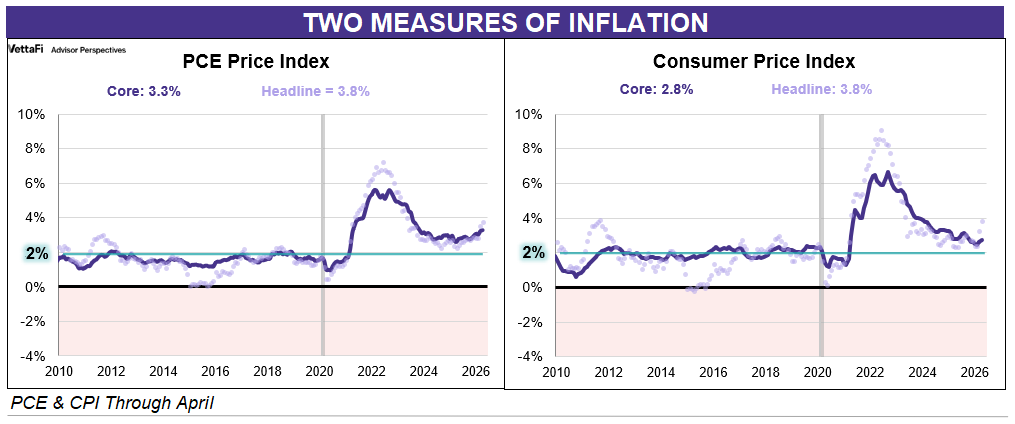
Inflation remains a hot topic, directly impacting everything from your grocery bill to interest rates. As of the latest data, two key inflation gauges — the Personal Consumption Expenditures (PCE) Price Index and the Consumer Price Index (CPI) — show that prices are still above the Federal Reserve's 2% target, with the core PCE at 3.3% and core CPI at 2.8%.
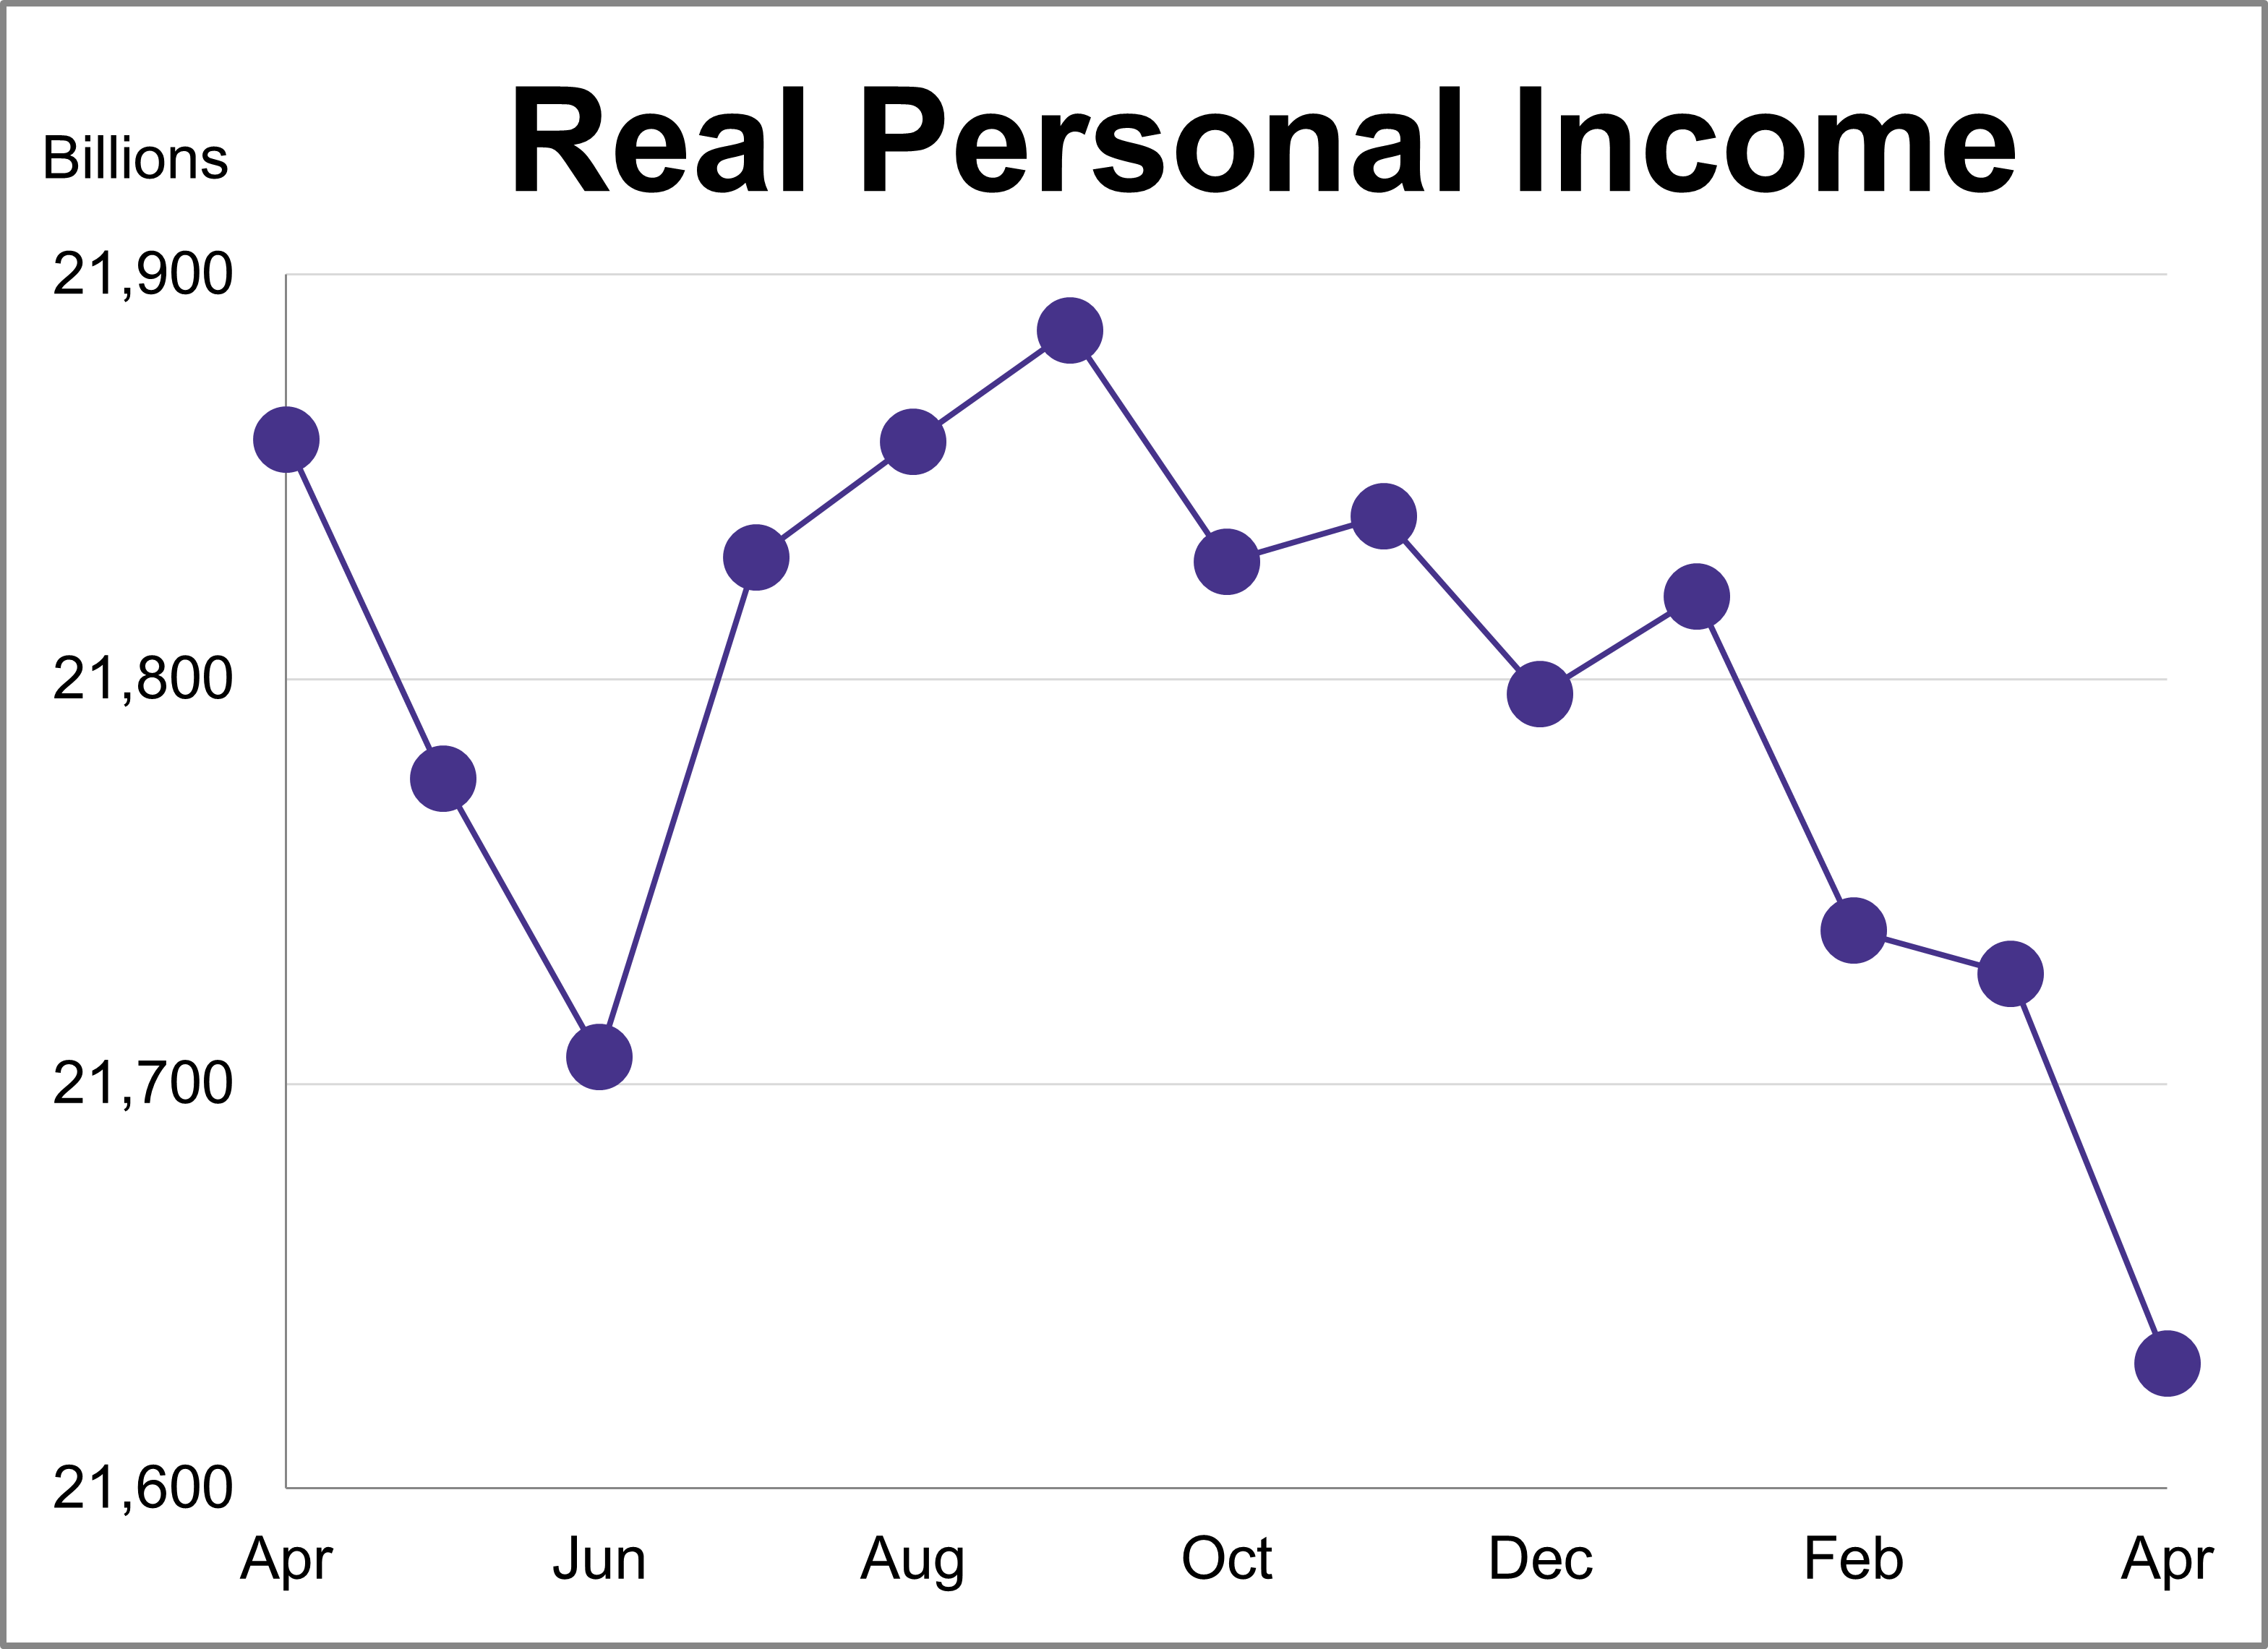
Personal income (excluding transfer receipts) was down 0.05% in April and was up 2.68% year-over-year. However, when adjusted for inflation using the BEA's PCE Price Index, real personal income (excluding transfer receipts) was down 0.44% month-over-month and down 1.04% year-over-year.
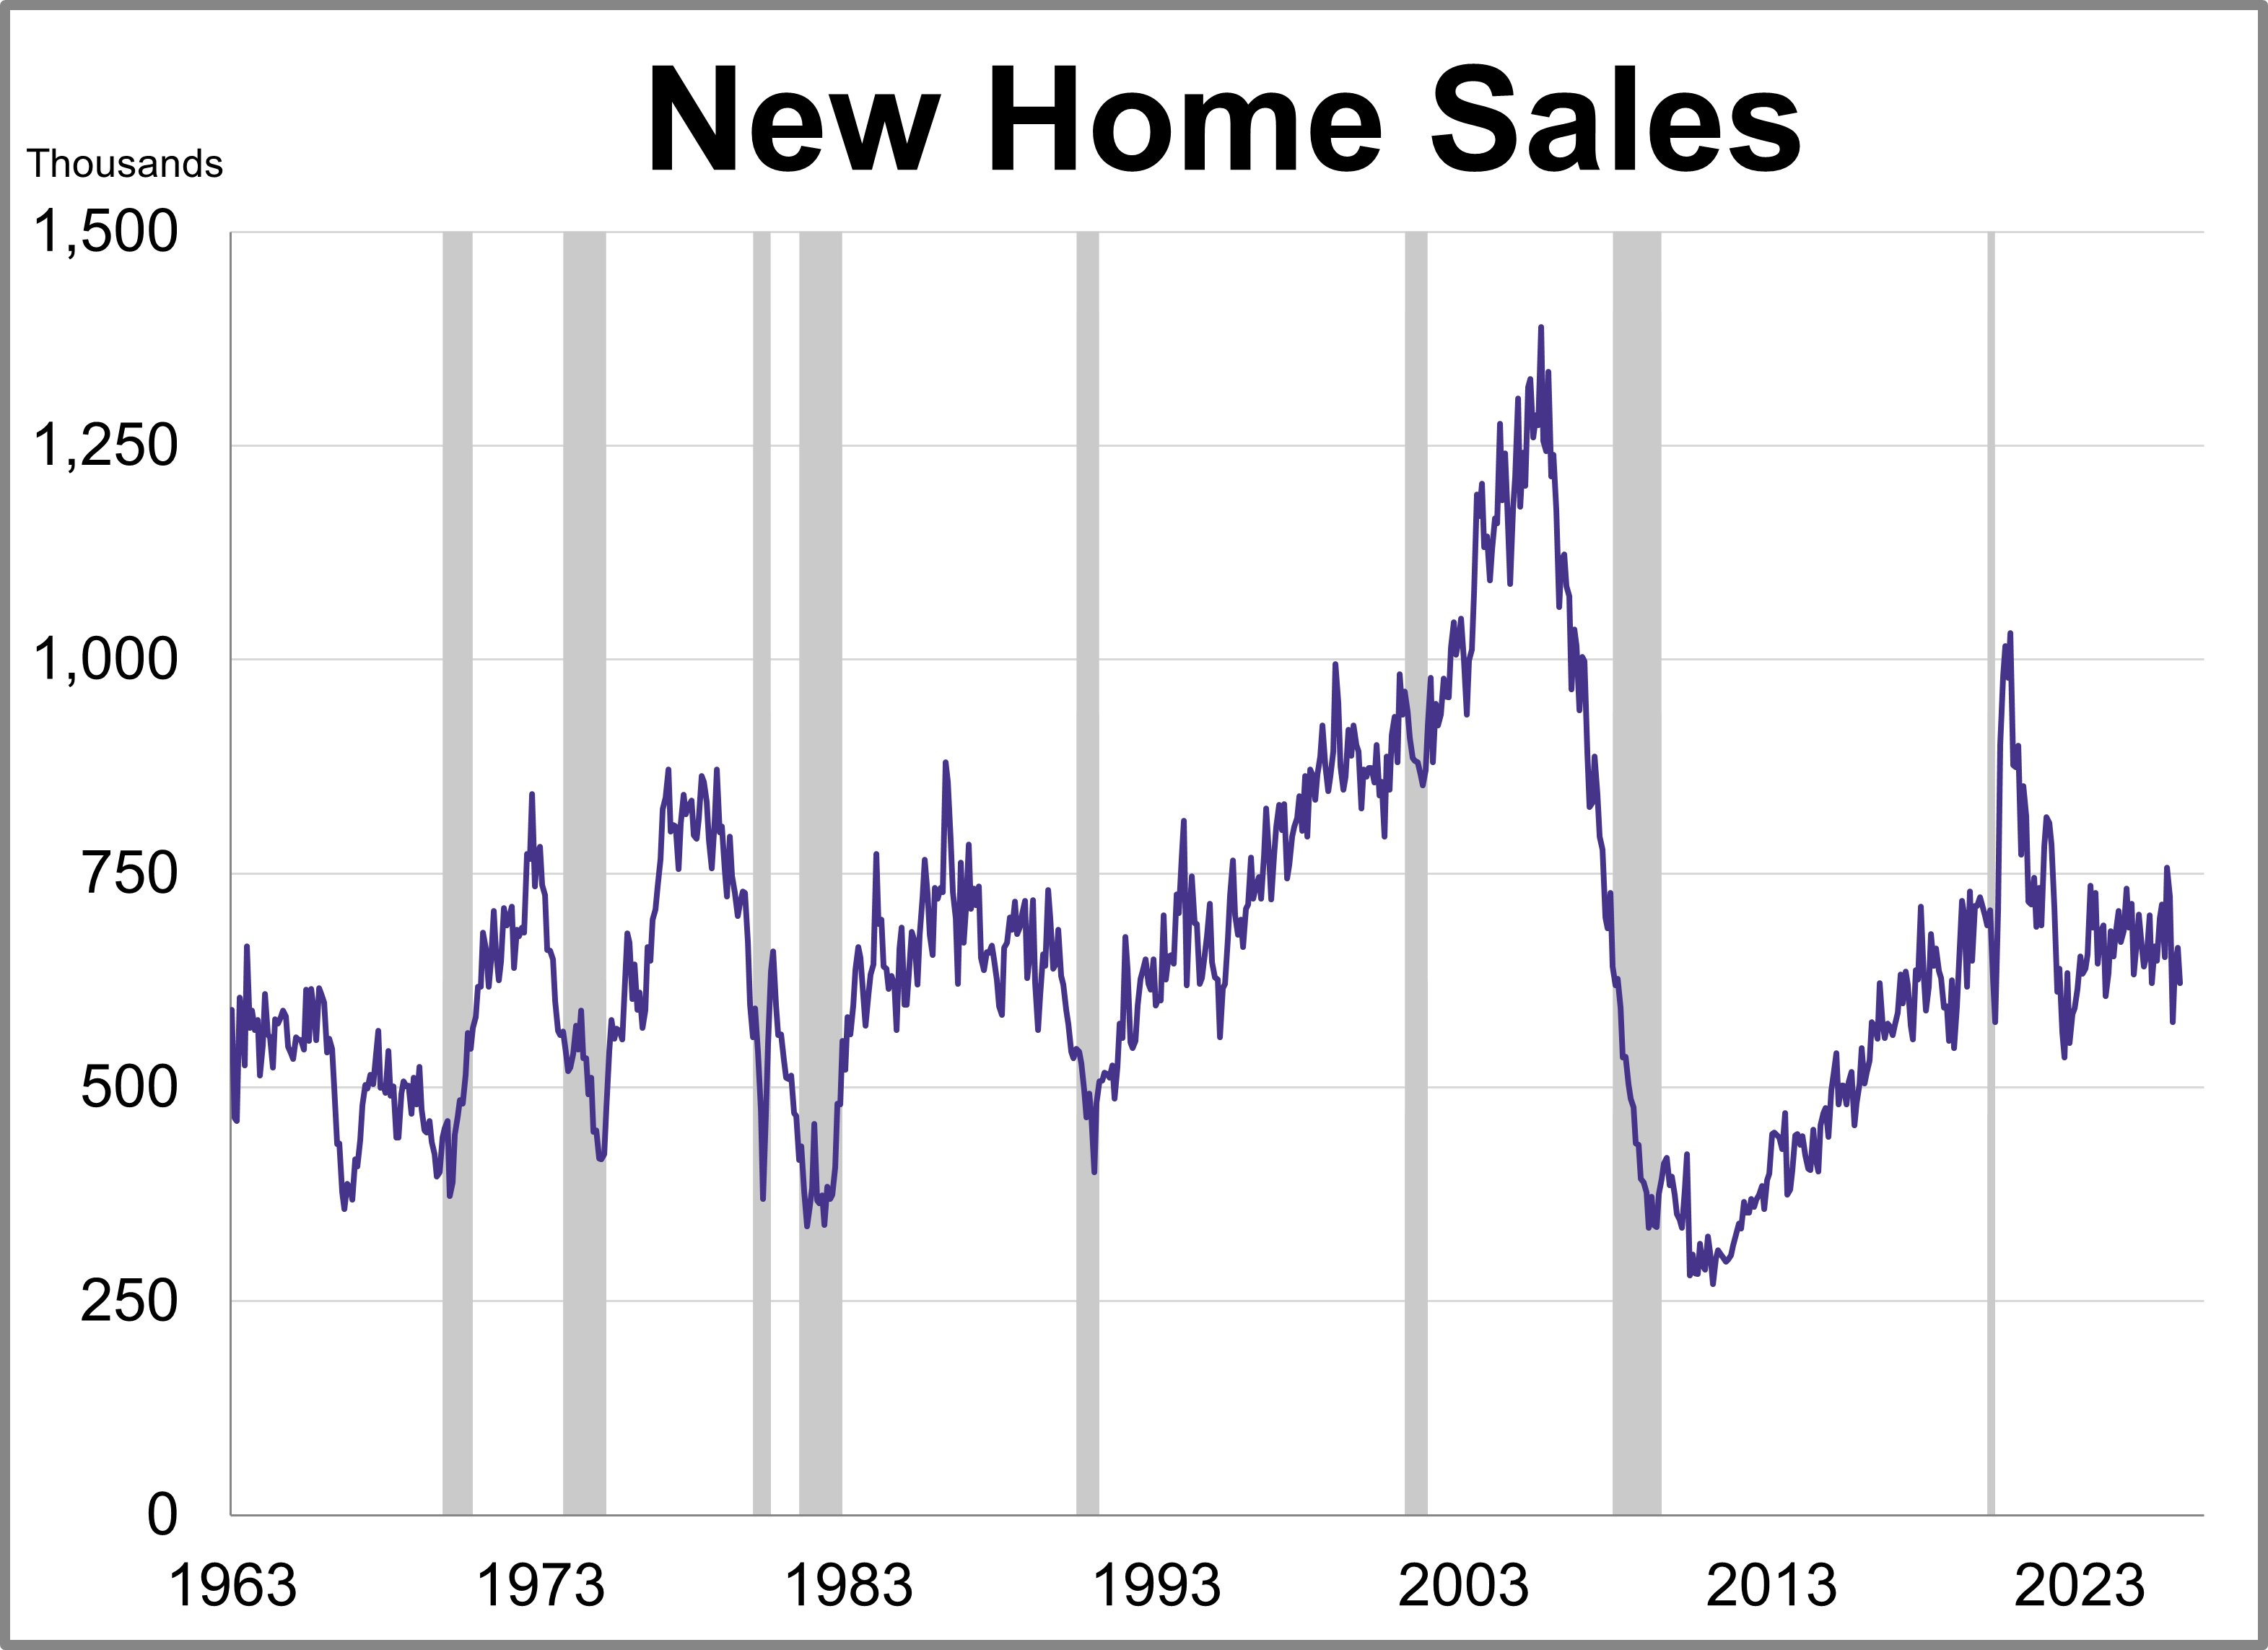
New home sales fell more than expected in April while the median price experienced its largest jump in seven years.