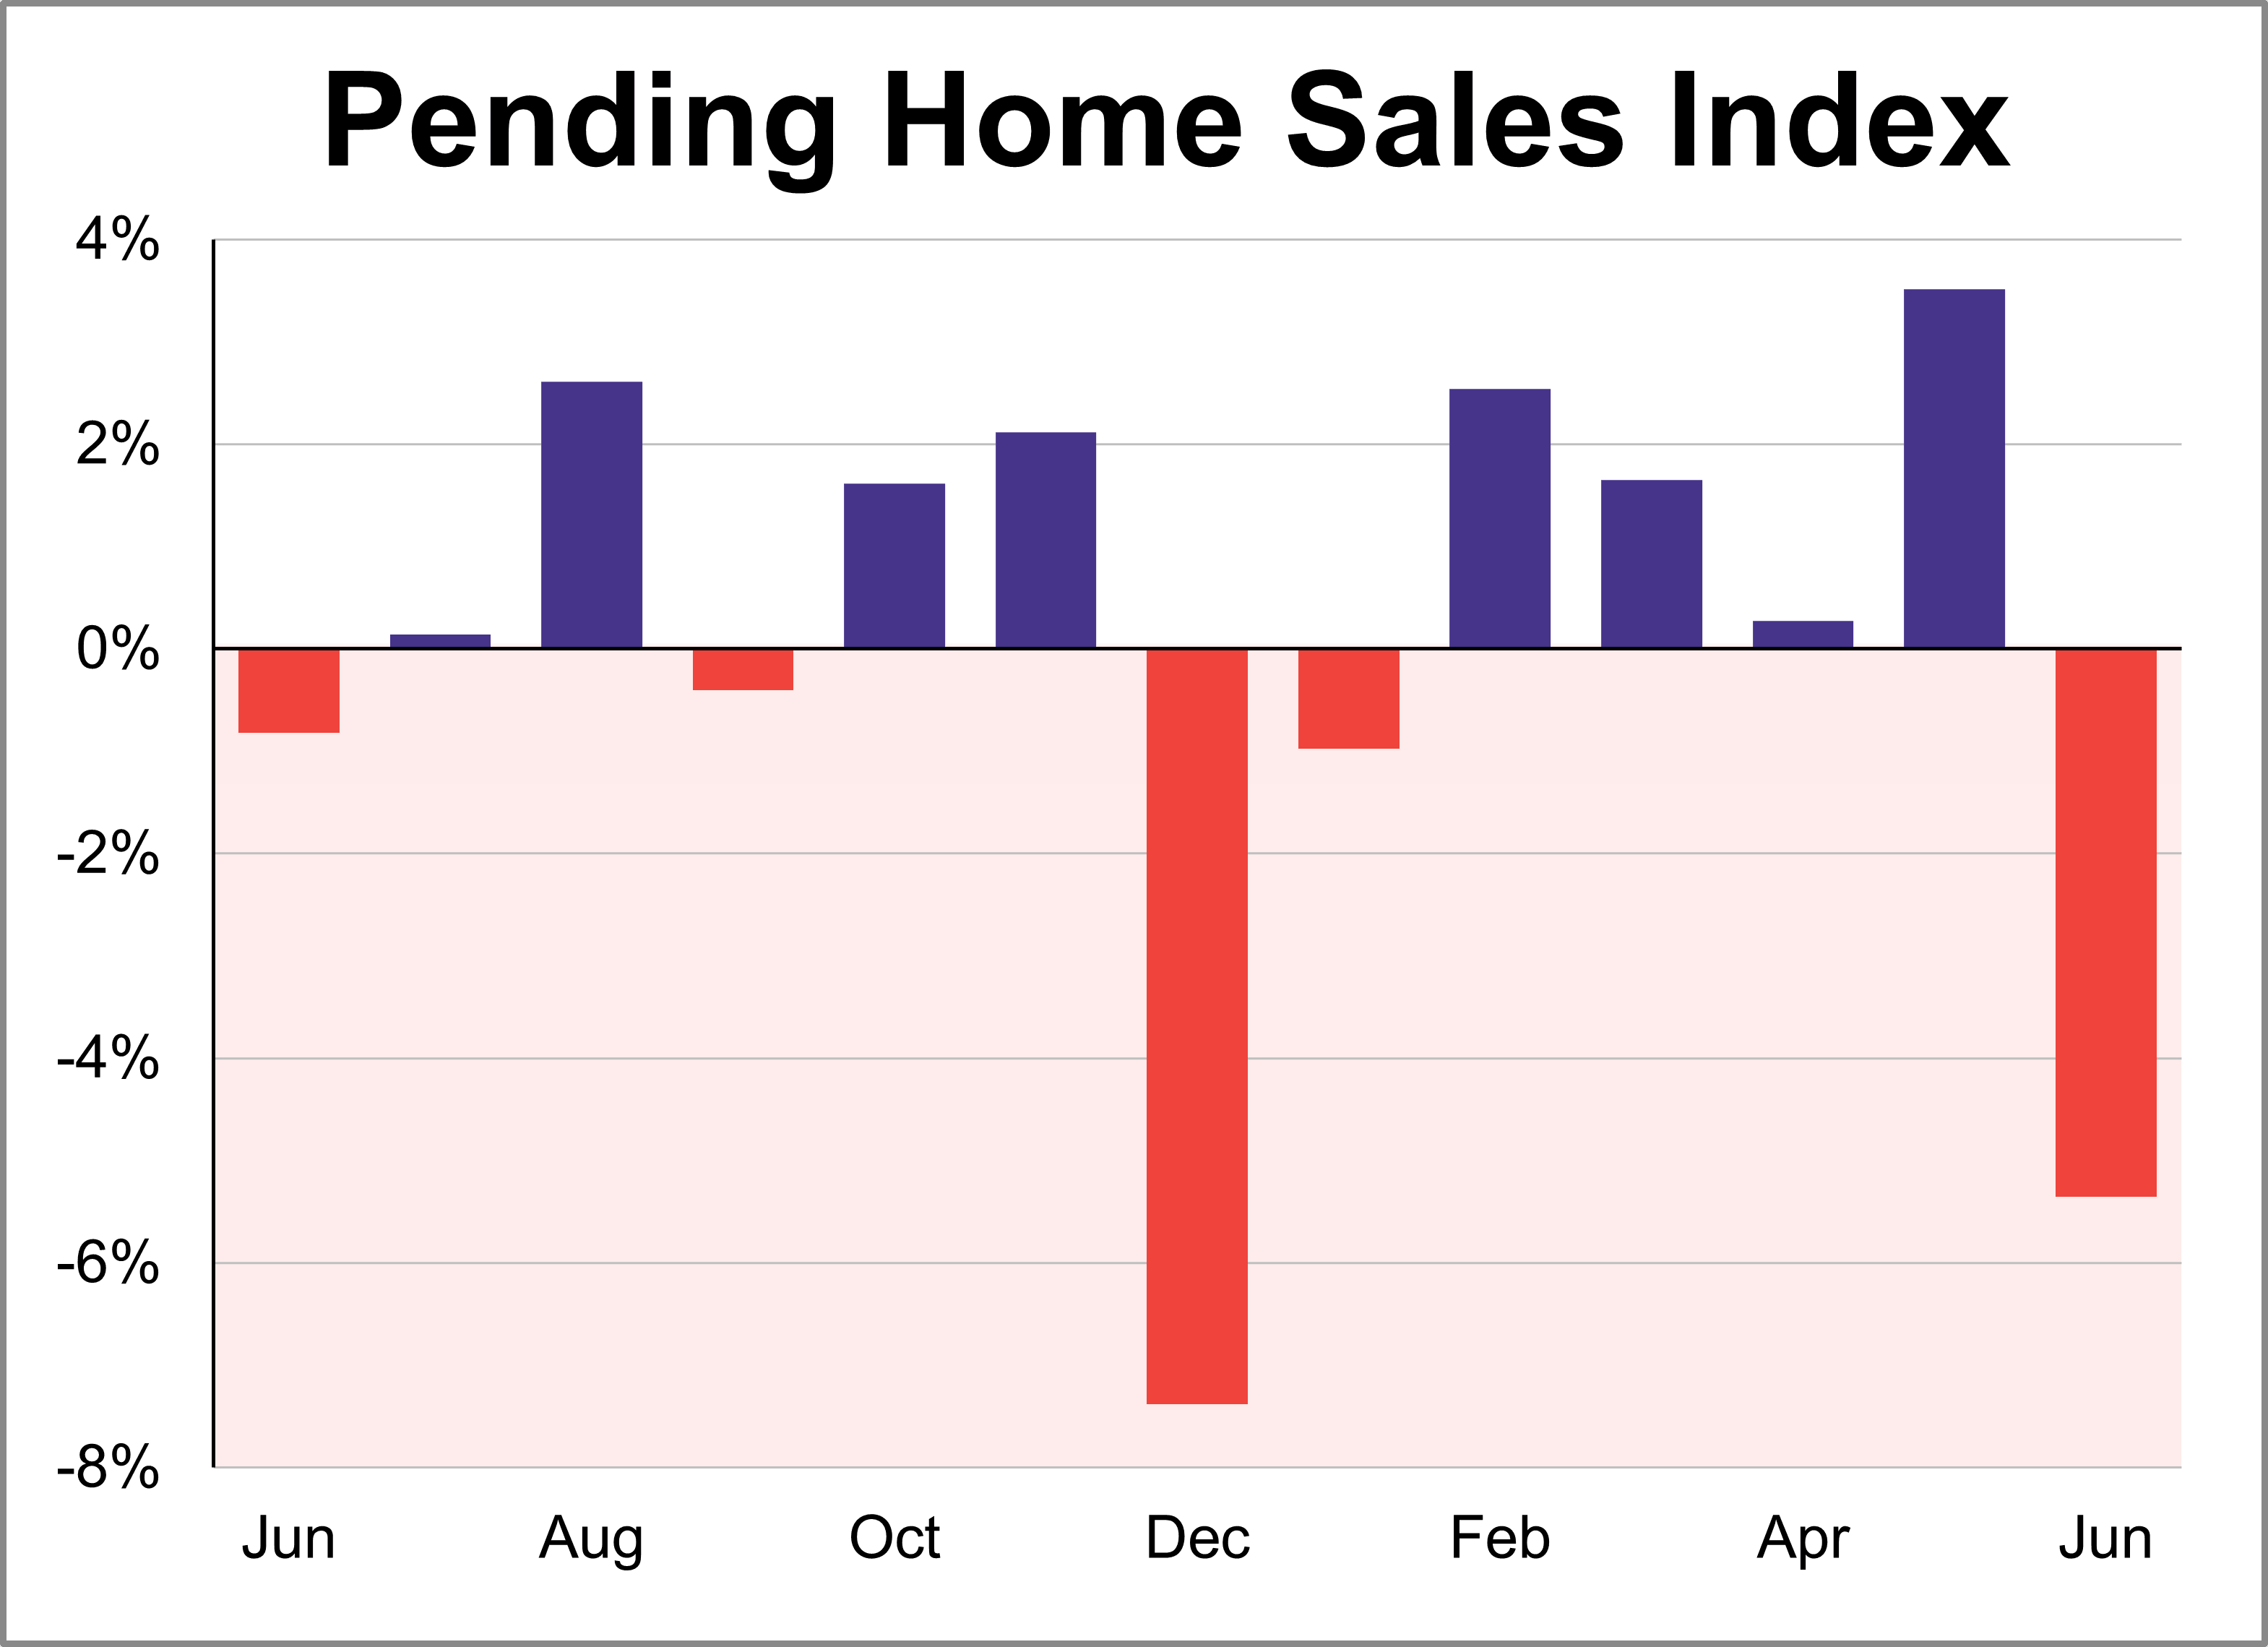
The National Association of Realtors® (NAR) pending home sales index sank 5.4% in June to 72.5, the lowest level since January. This was more than the expected 0.5% decline and marks the first decrease for the index in five months. Compared to one year ago, the index is down 0.3%.
Key Takeaways
- The pending home sales index fell 5.4% in June to 72.5 and is down 0.3% compared to one year ago.
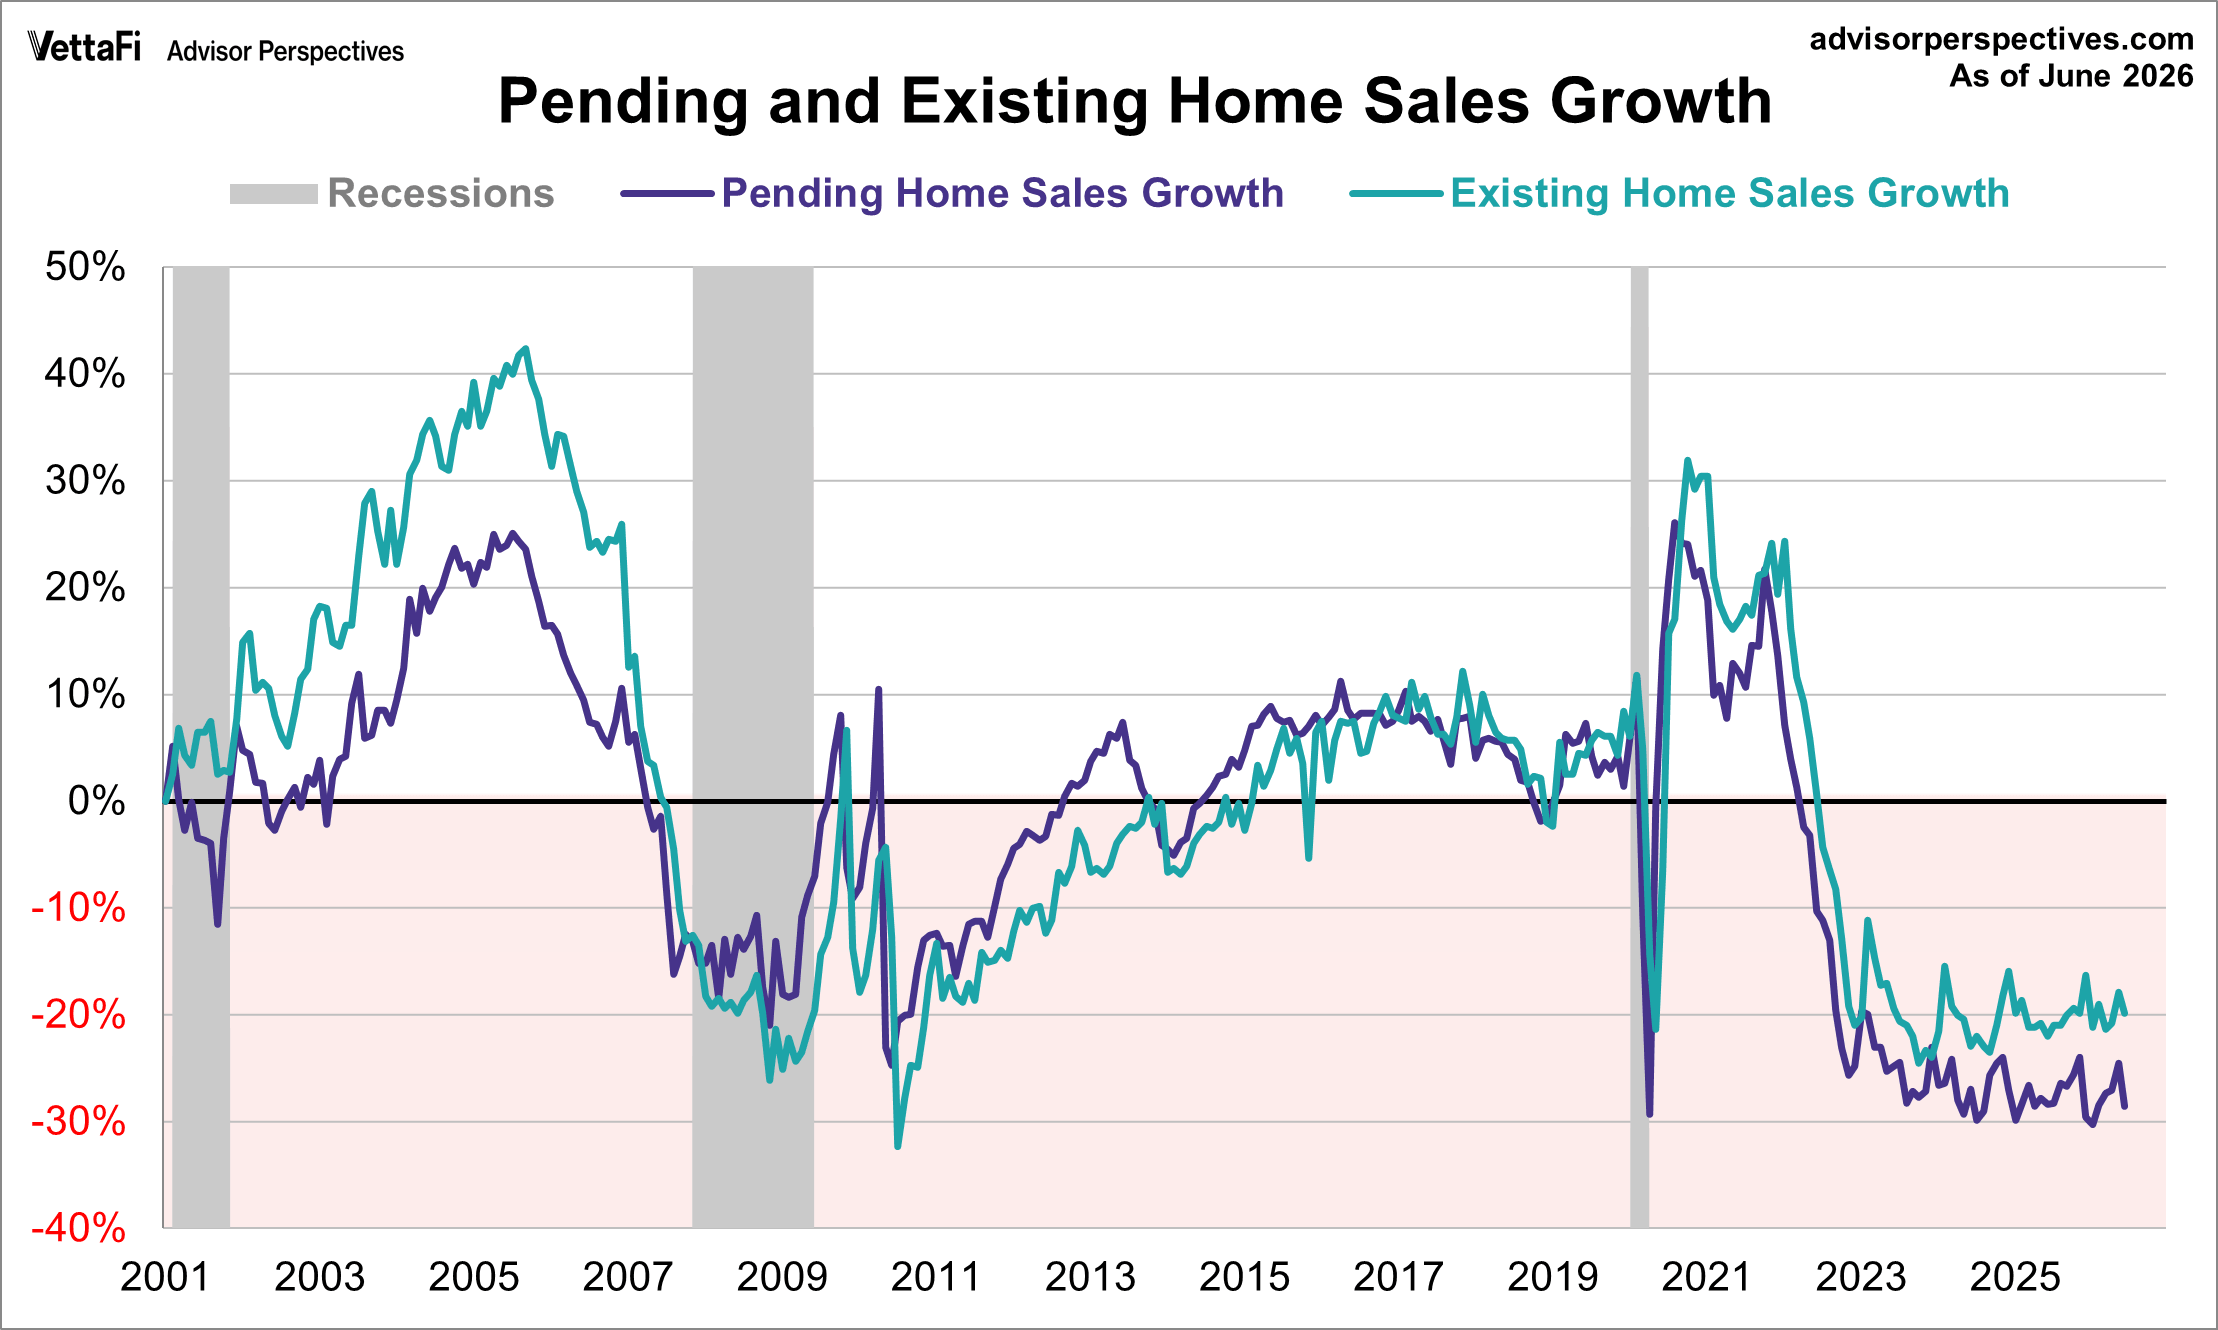
- Since 2001, pending home sales have fallen 28.6%, while existing home sales have fallen 19.8%.
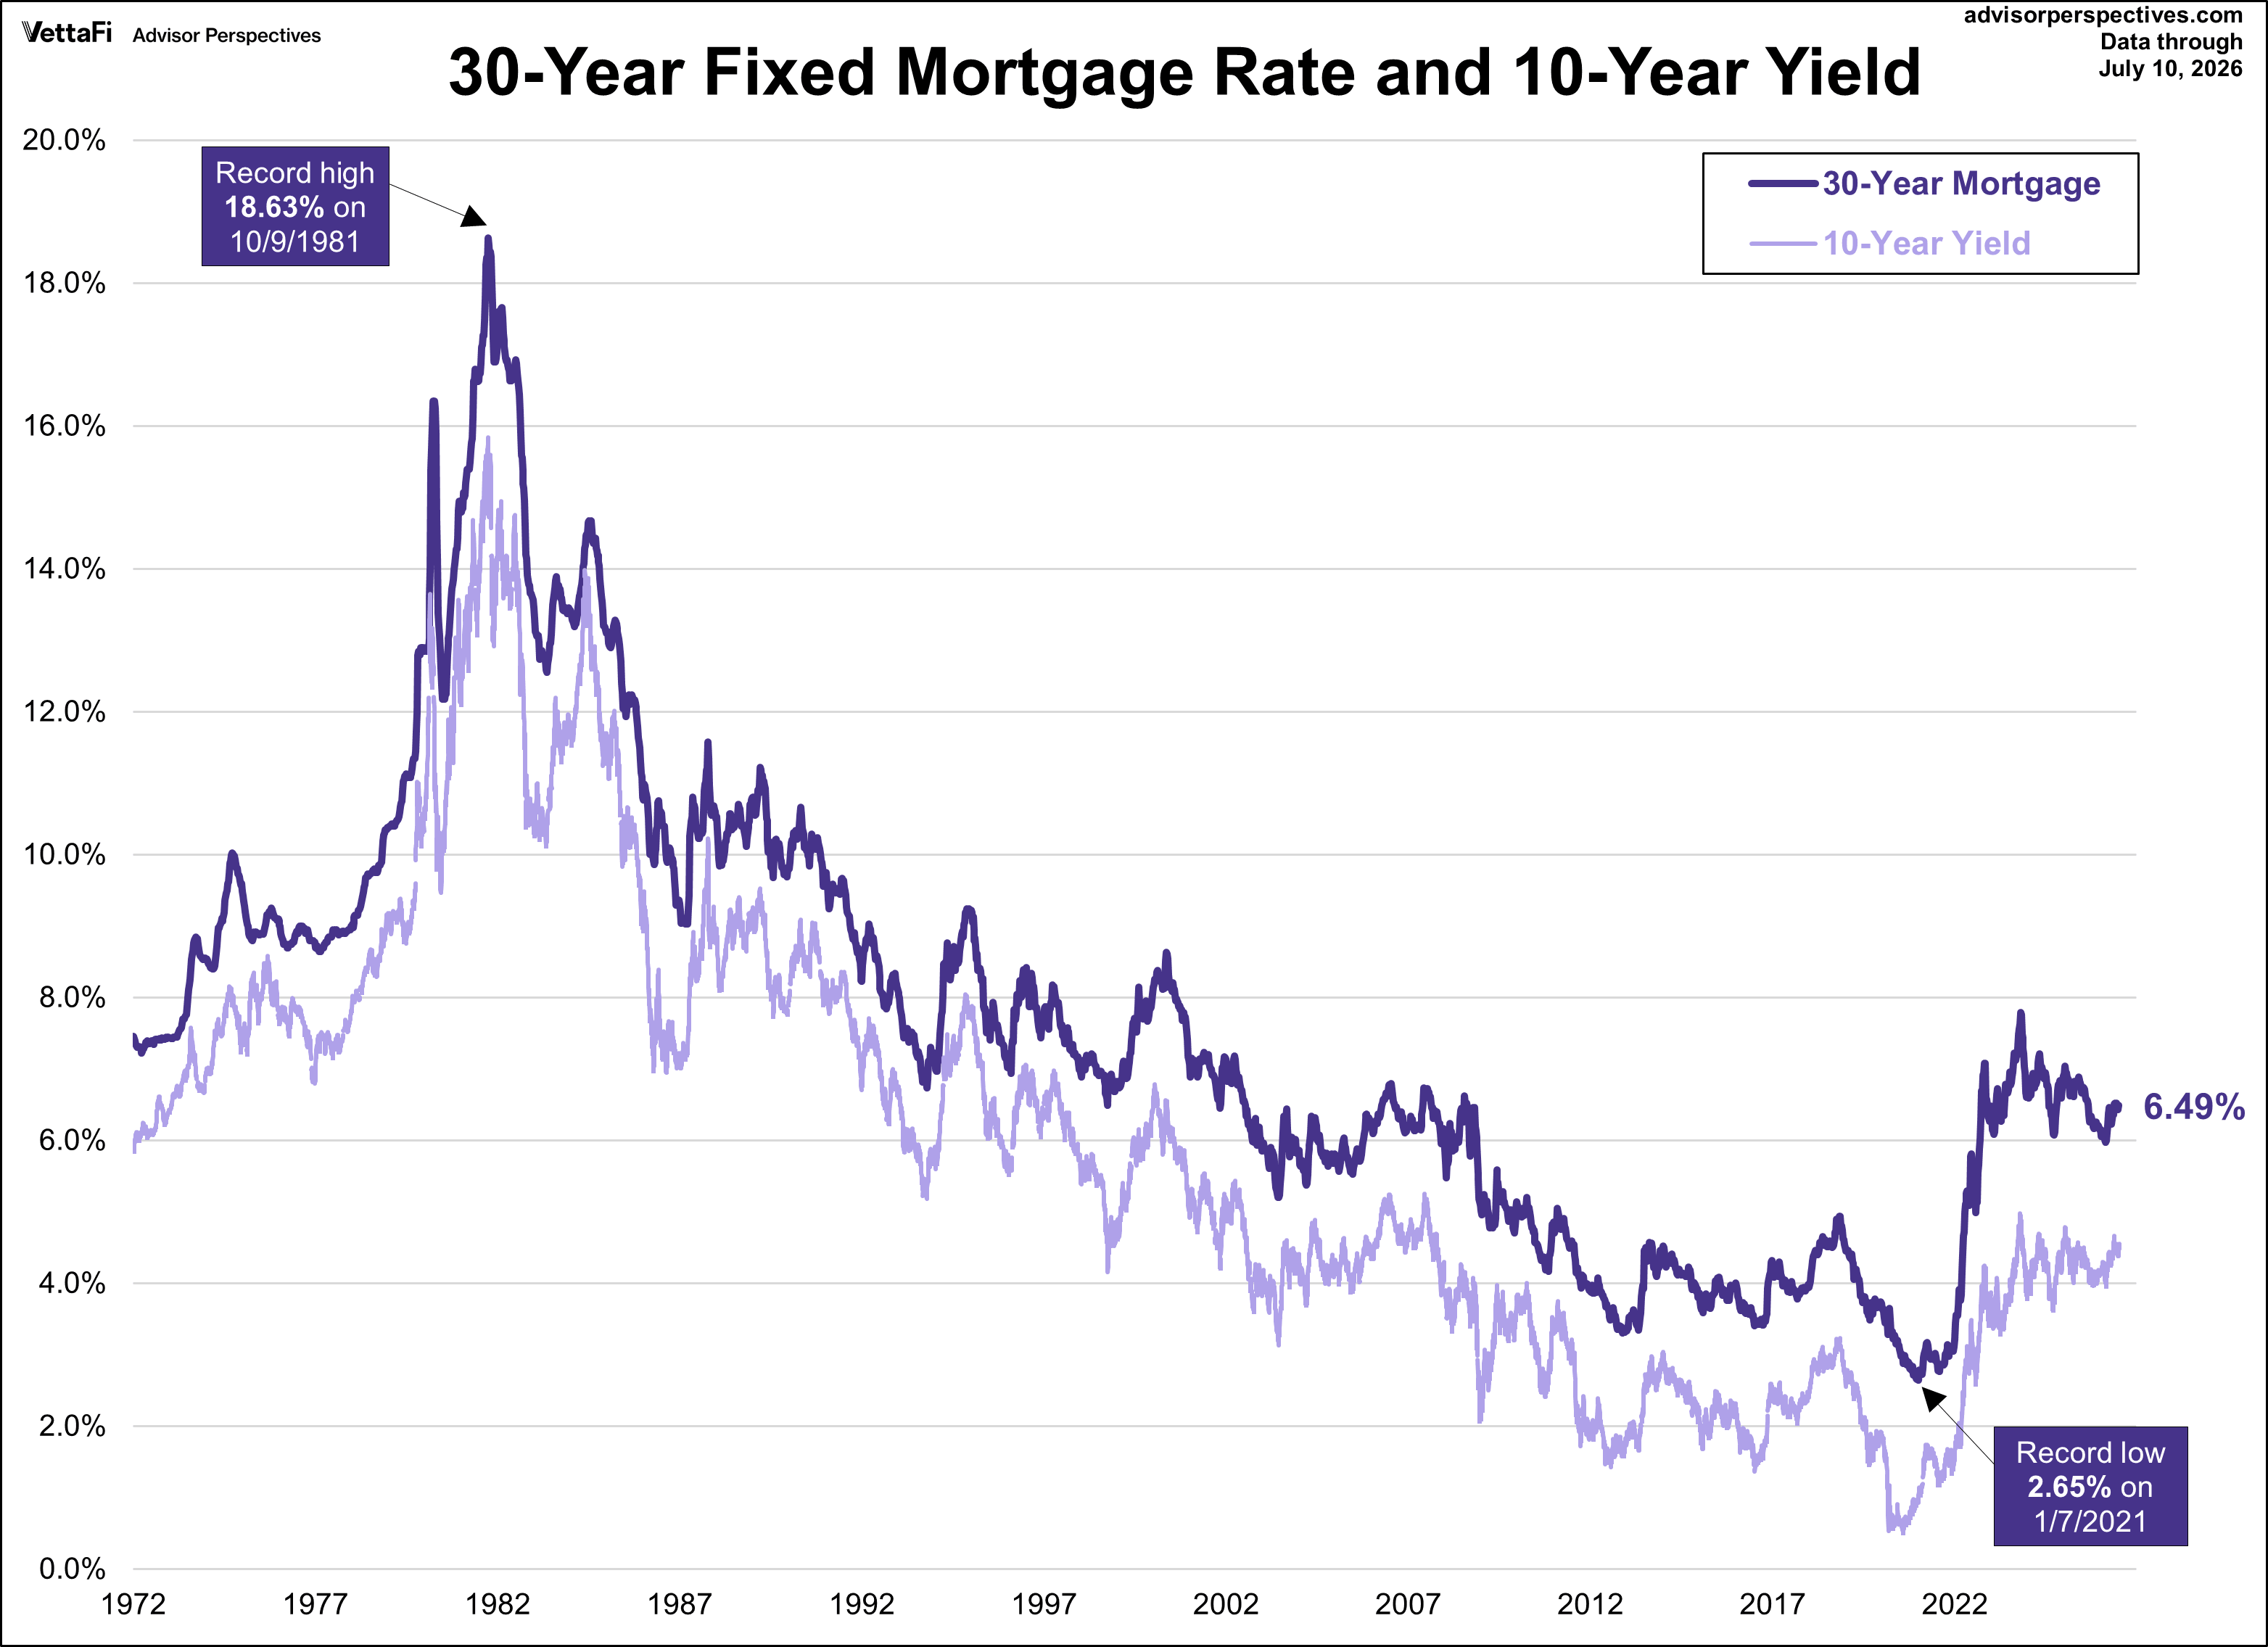
- According to Freddie Mac, the average 30-year fixed-rate mortgage in June 2026 was 6.49%.
“The highest mortgage rates in nearly a year and the record-high national median home price together are contributing to a tepid housing market that is especially difficult for first-time homebuyers,” said NAR Chief Economist Dr. Lawrence Yun. “However, job gains can help support housing demand.”
“It is worth emphasizing that it is closing activity, not contract signings, that generates economic impact. Pending contracts are only suggestive of upcoming closed deals and do not align perfectly, due to fallout rates and contract contingencies.”
Pending Home Sales Background
The pending home sales index (PHSI) was created by the National Association of Realtors® to track home sales where the contract is signed but the transaction has not yet closed. An index of 100 is equal to the level of contract activity in 2001. The PHSI is a leading economic indicator of future existing home sales.
The chart below gives us a snapshot of the index since 2001, the first year data was analyzed.
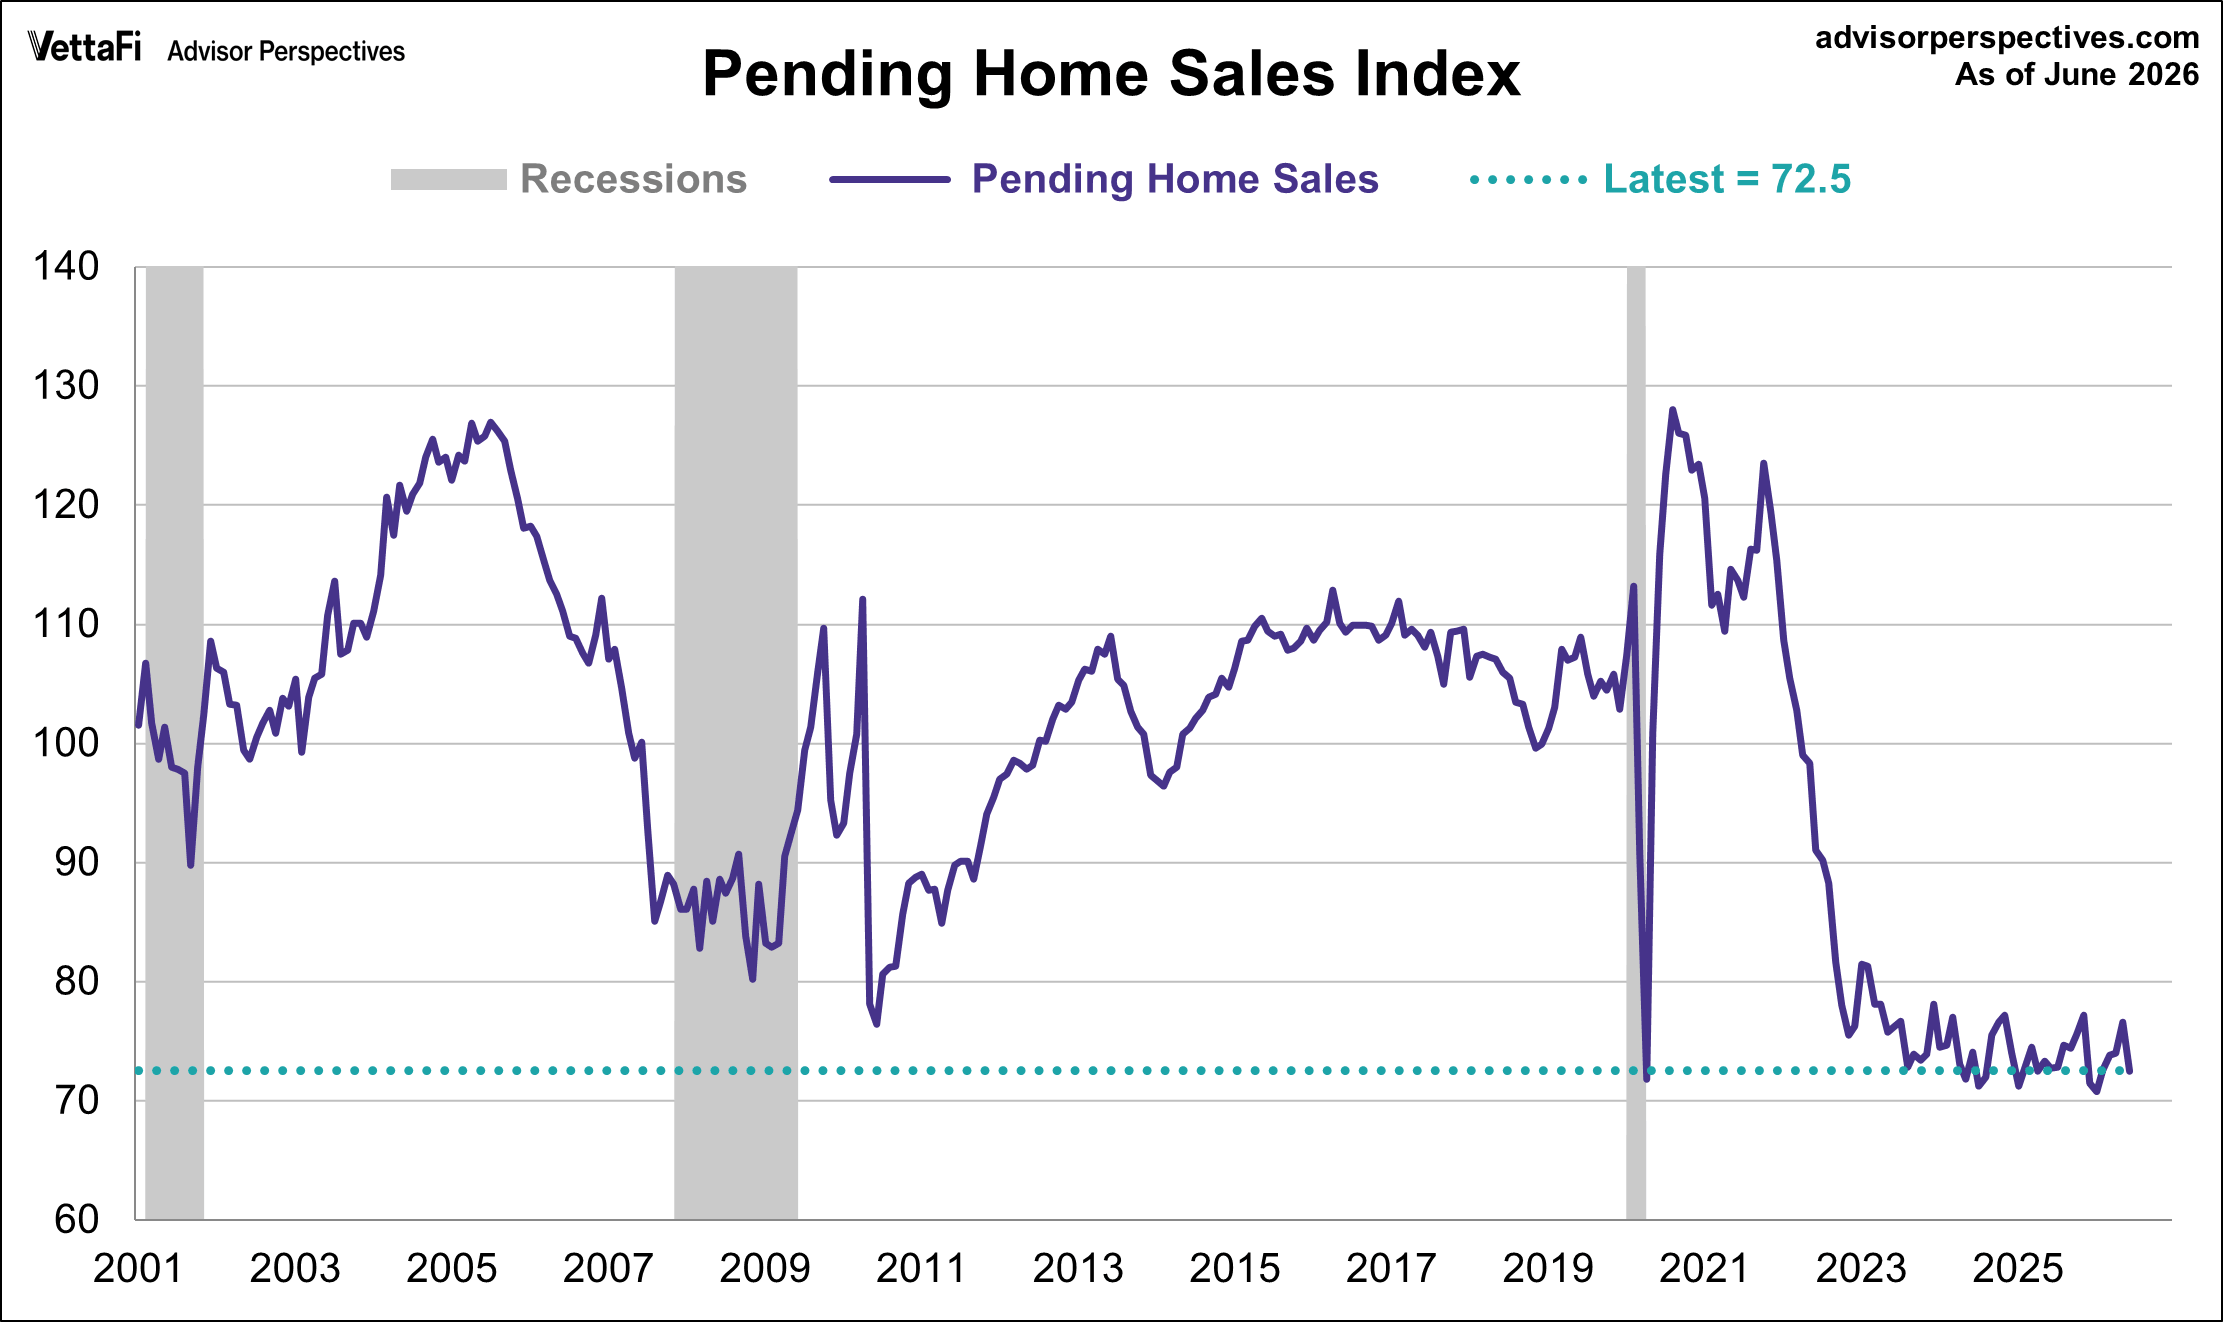
Over this time frame, the US population has grown by 20.7%. For a better look at the underlying trend, here is an overlay with the nominal index and the population-adjusted variant to show the growth in sales over the past 25 years.
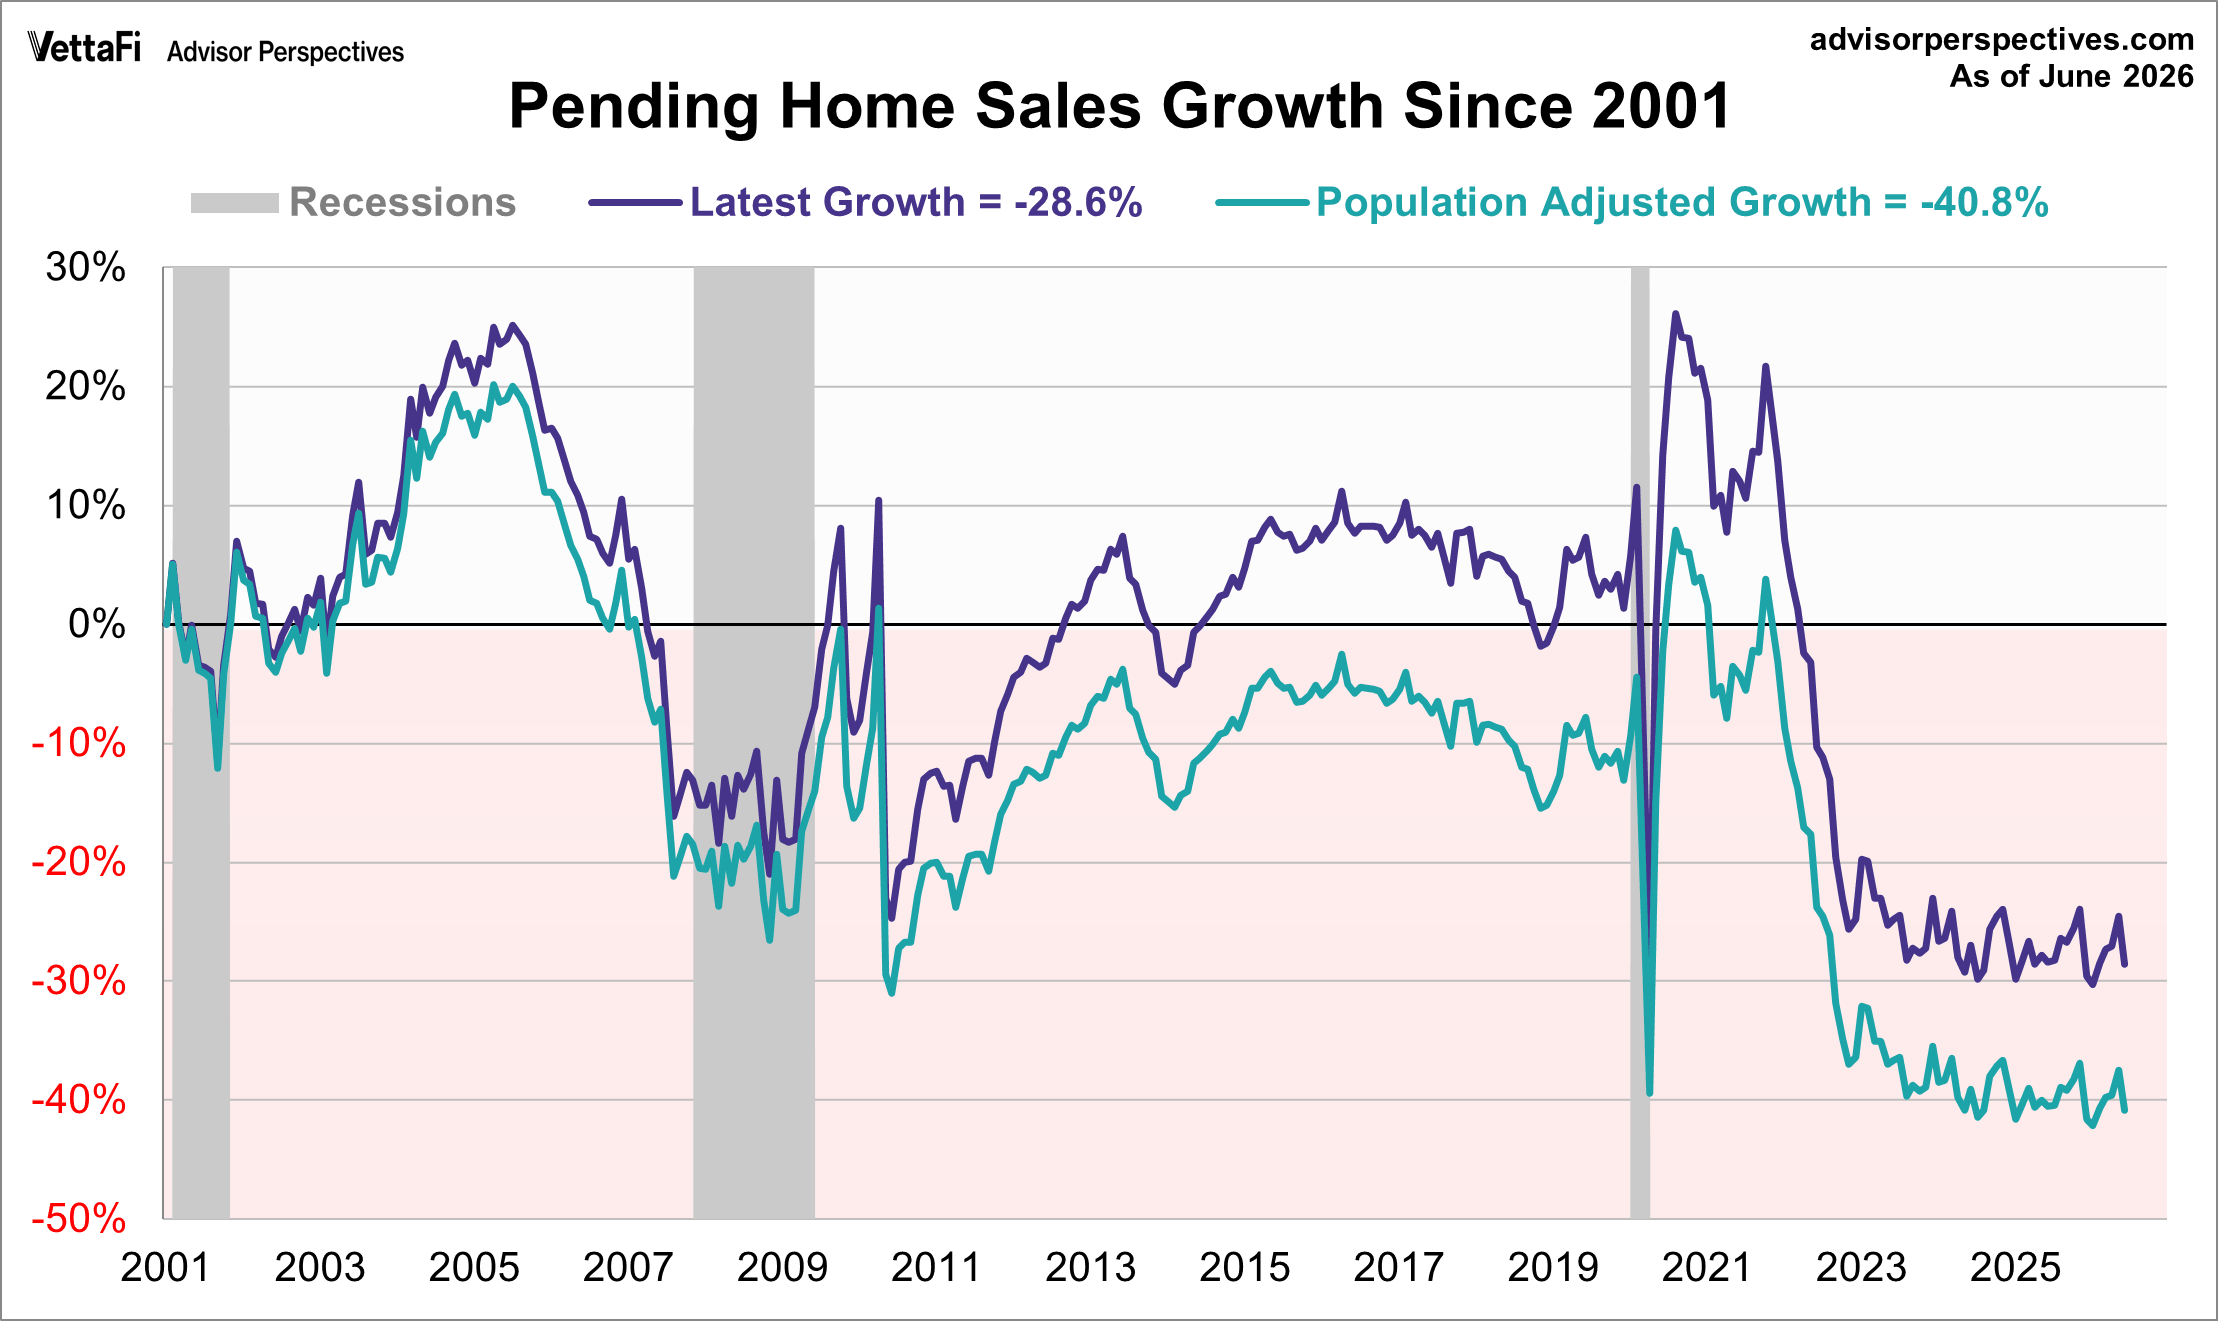
The above chart shows the percent change relative to turn-of-the-century baseline values. The index for the most recent month is currently 43% below its all-time high from August 2020, while the population-adjusted index is 51% off its high from April 2005.