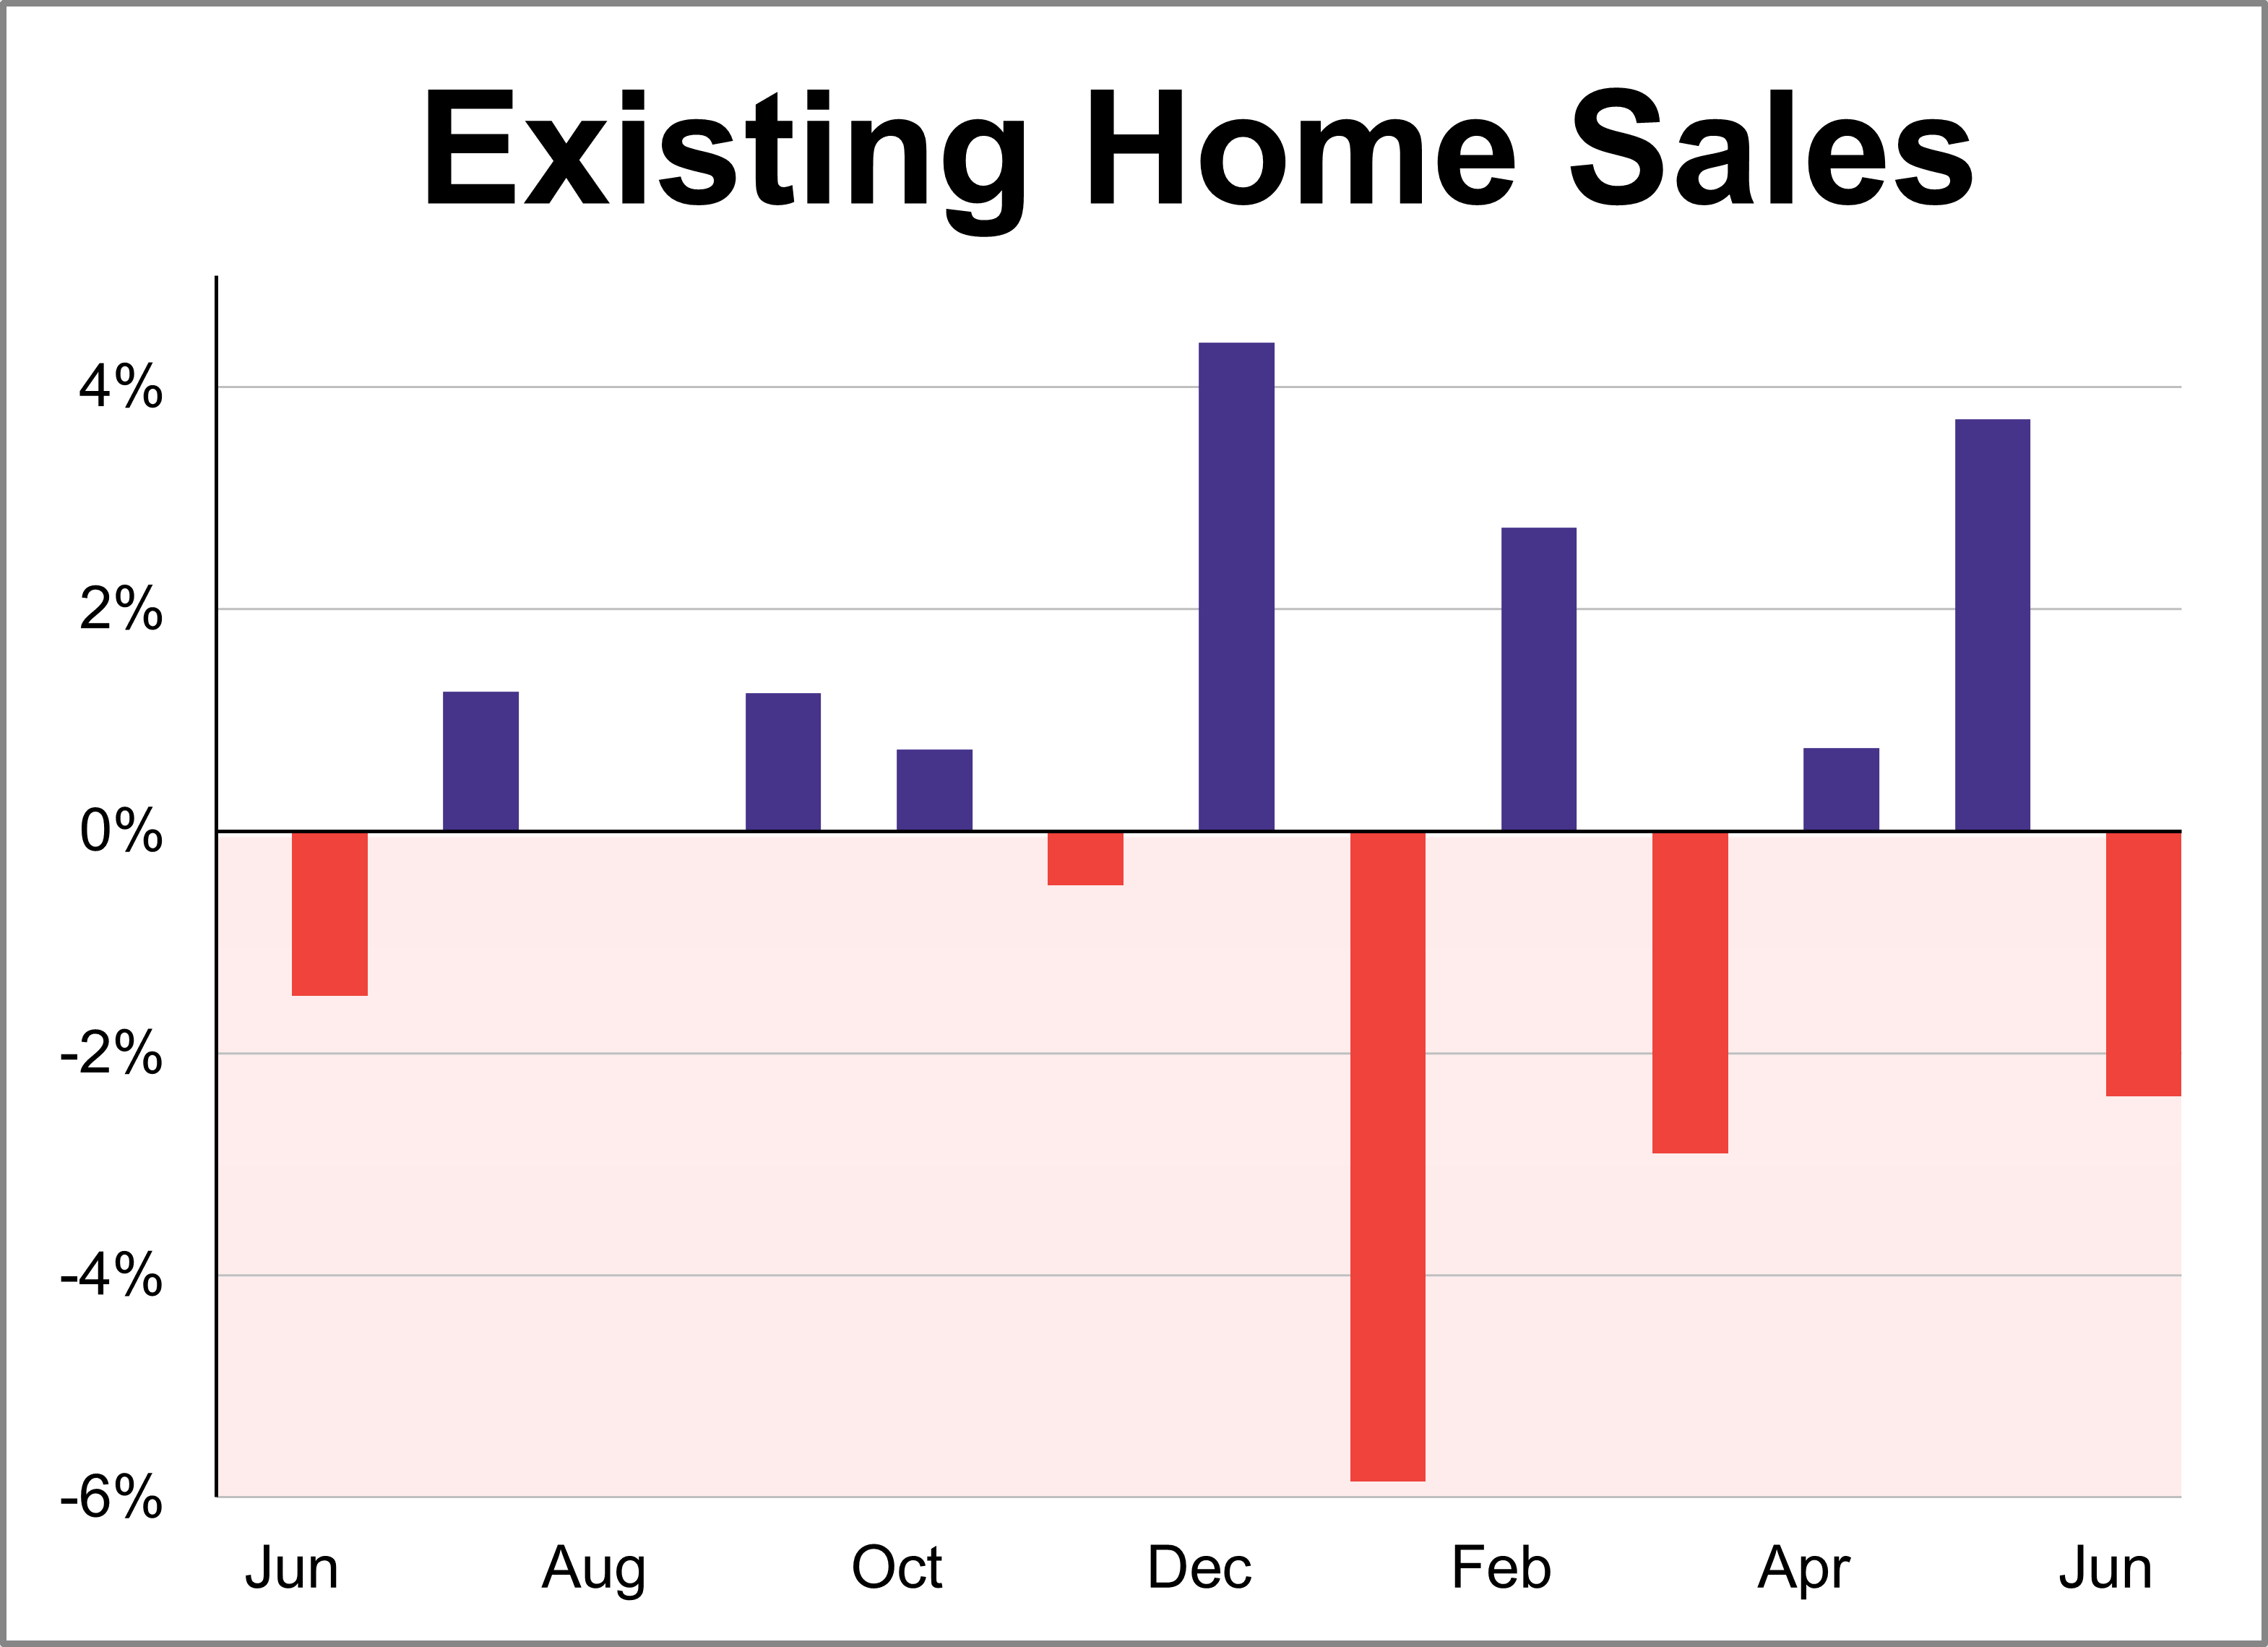
Existing home sales unexpectedly fell in June, dropping 2.4% after a 3.7% increase in May. According to the National Association of Realtors (NAR), sales reached a seasonally adjusted annual rate of 4.09 million units, falling short of the projection 4.19 million. On a year-over-year basis, existing home sales are up 2.8%.

Key Takeaways
- Existing home sales dropped 2.4% in June to a seasonally adjusted annual rate of 4.09 million units.
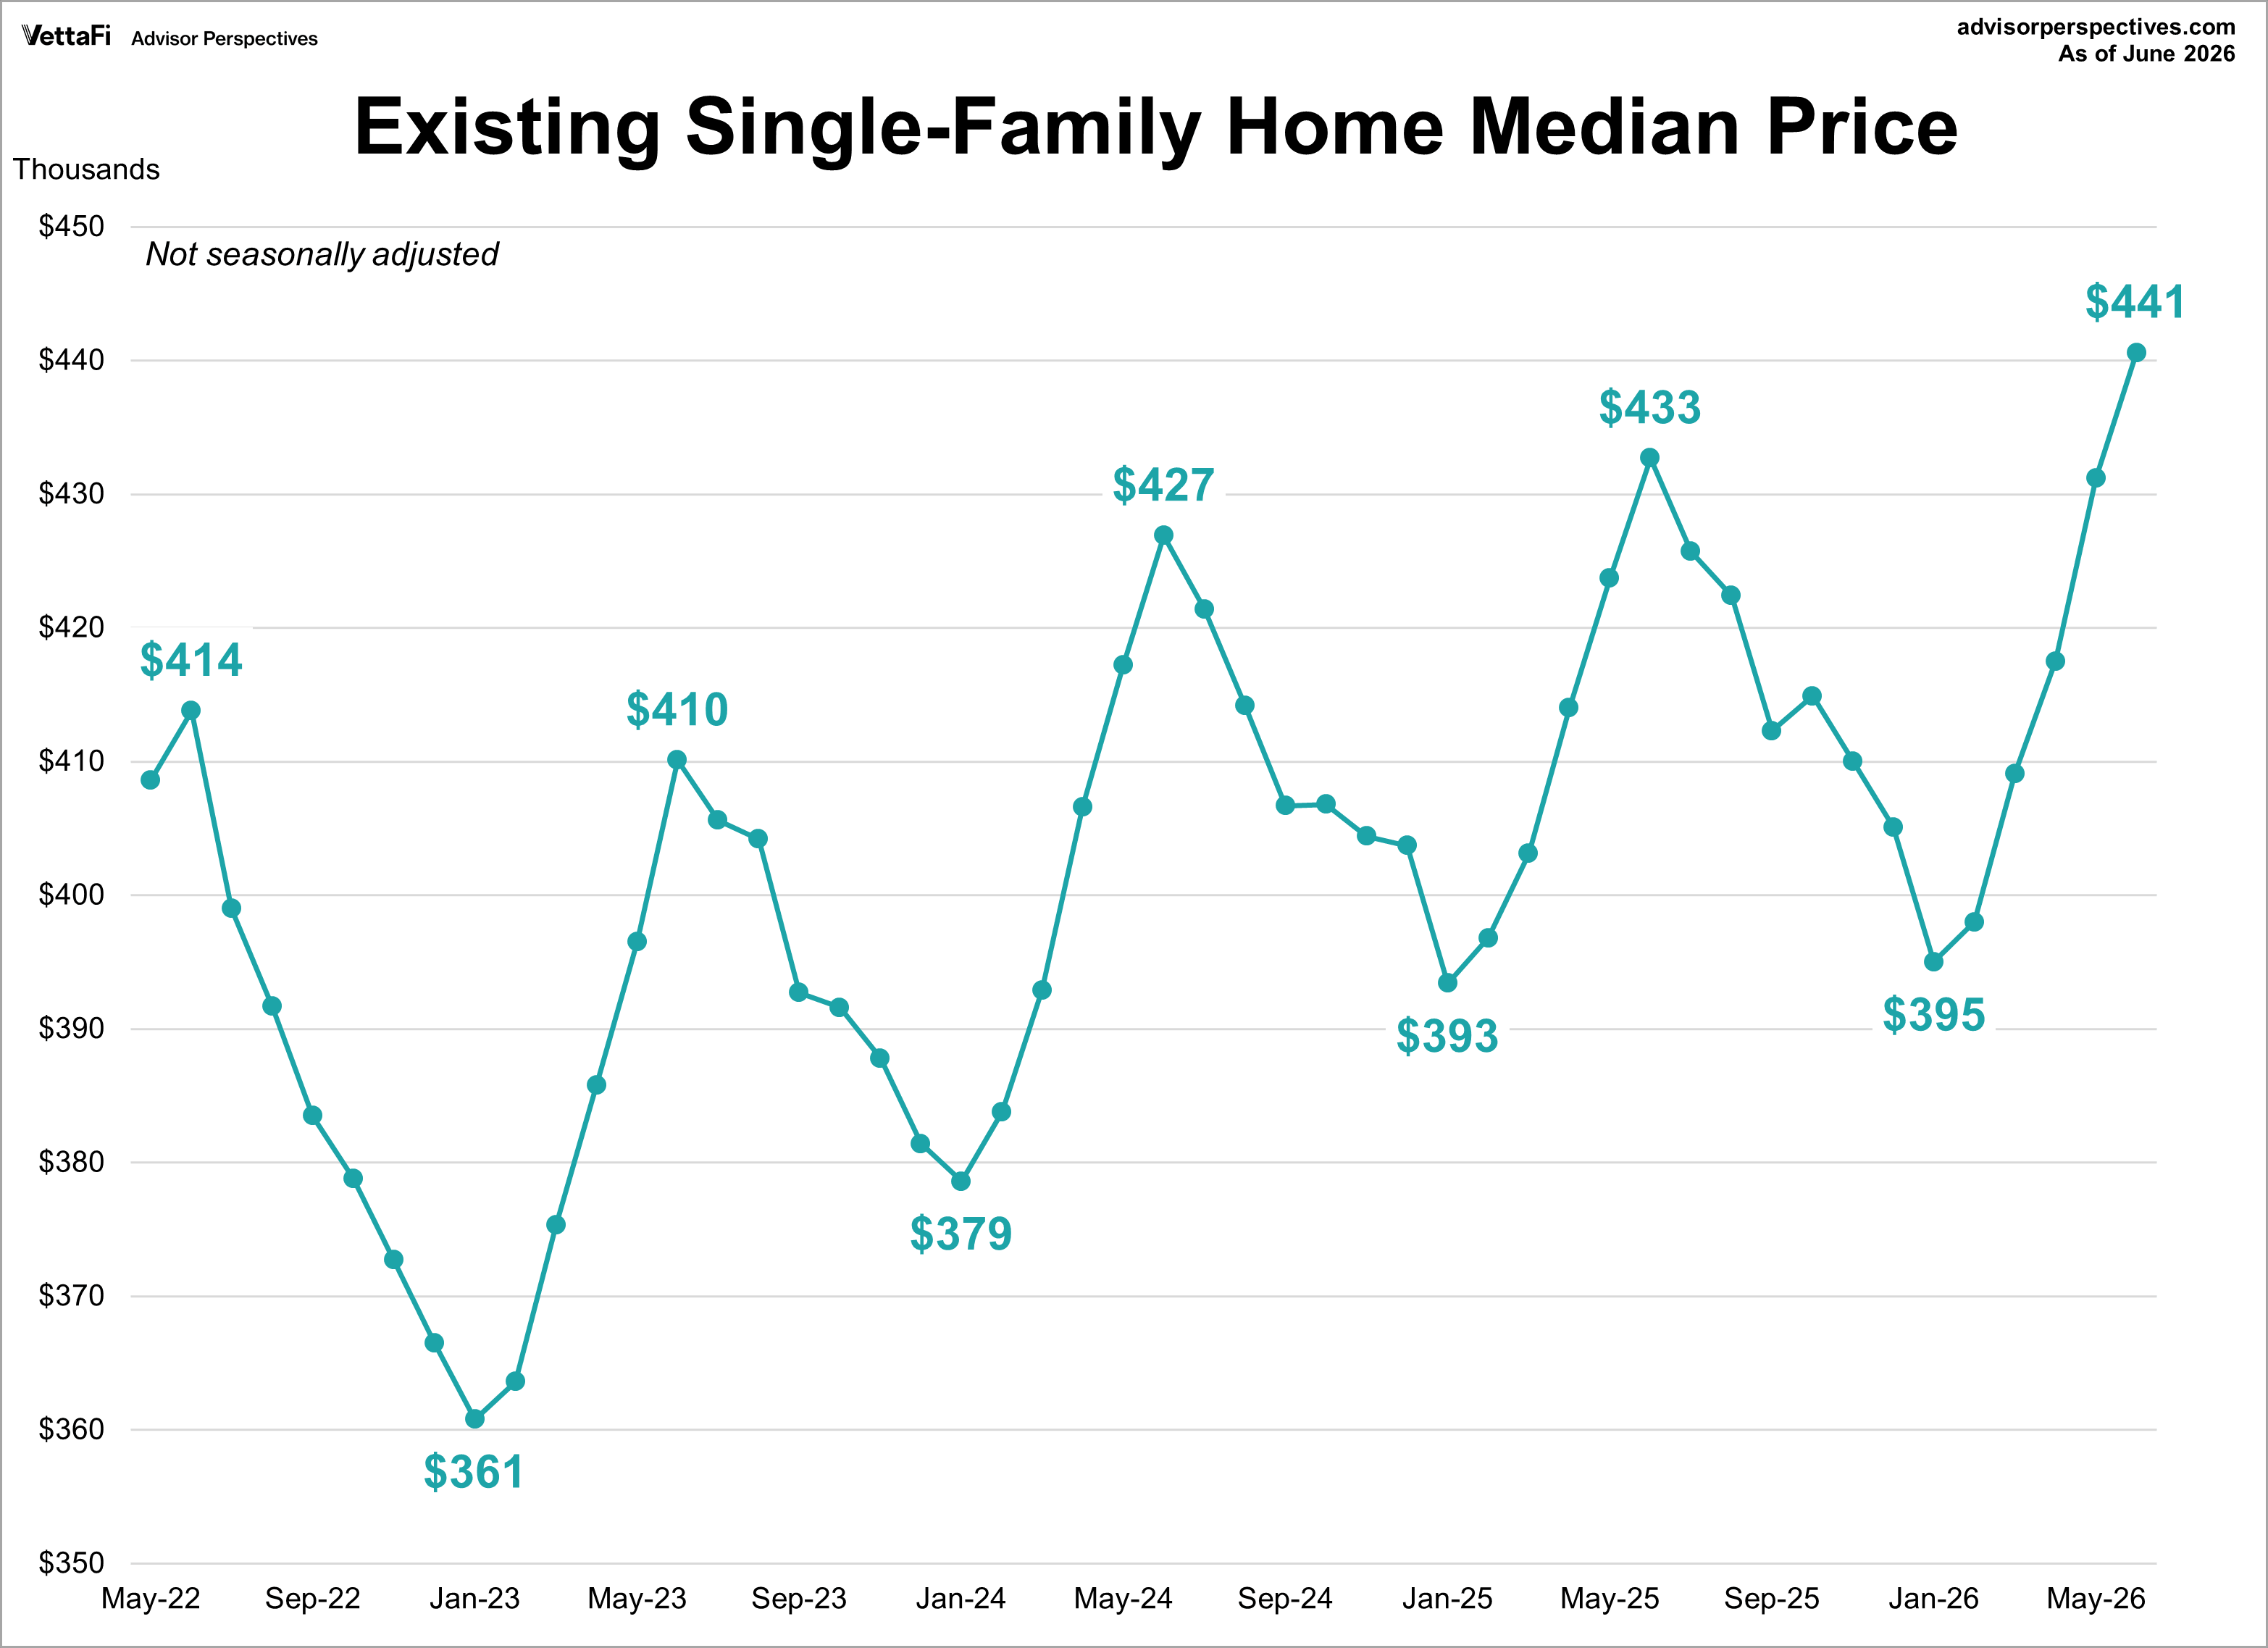
- Median existing-home prices rose to an all-time high of $440,600.
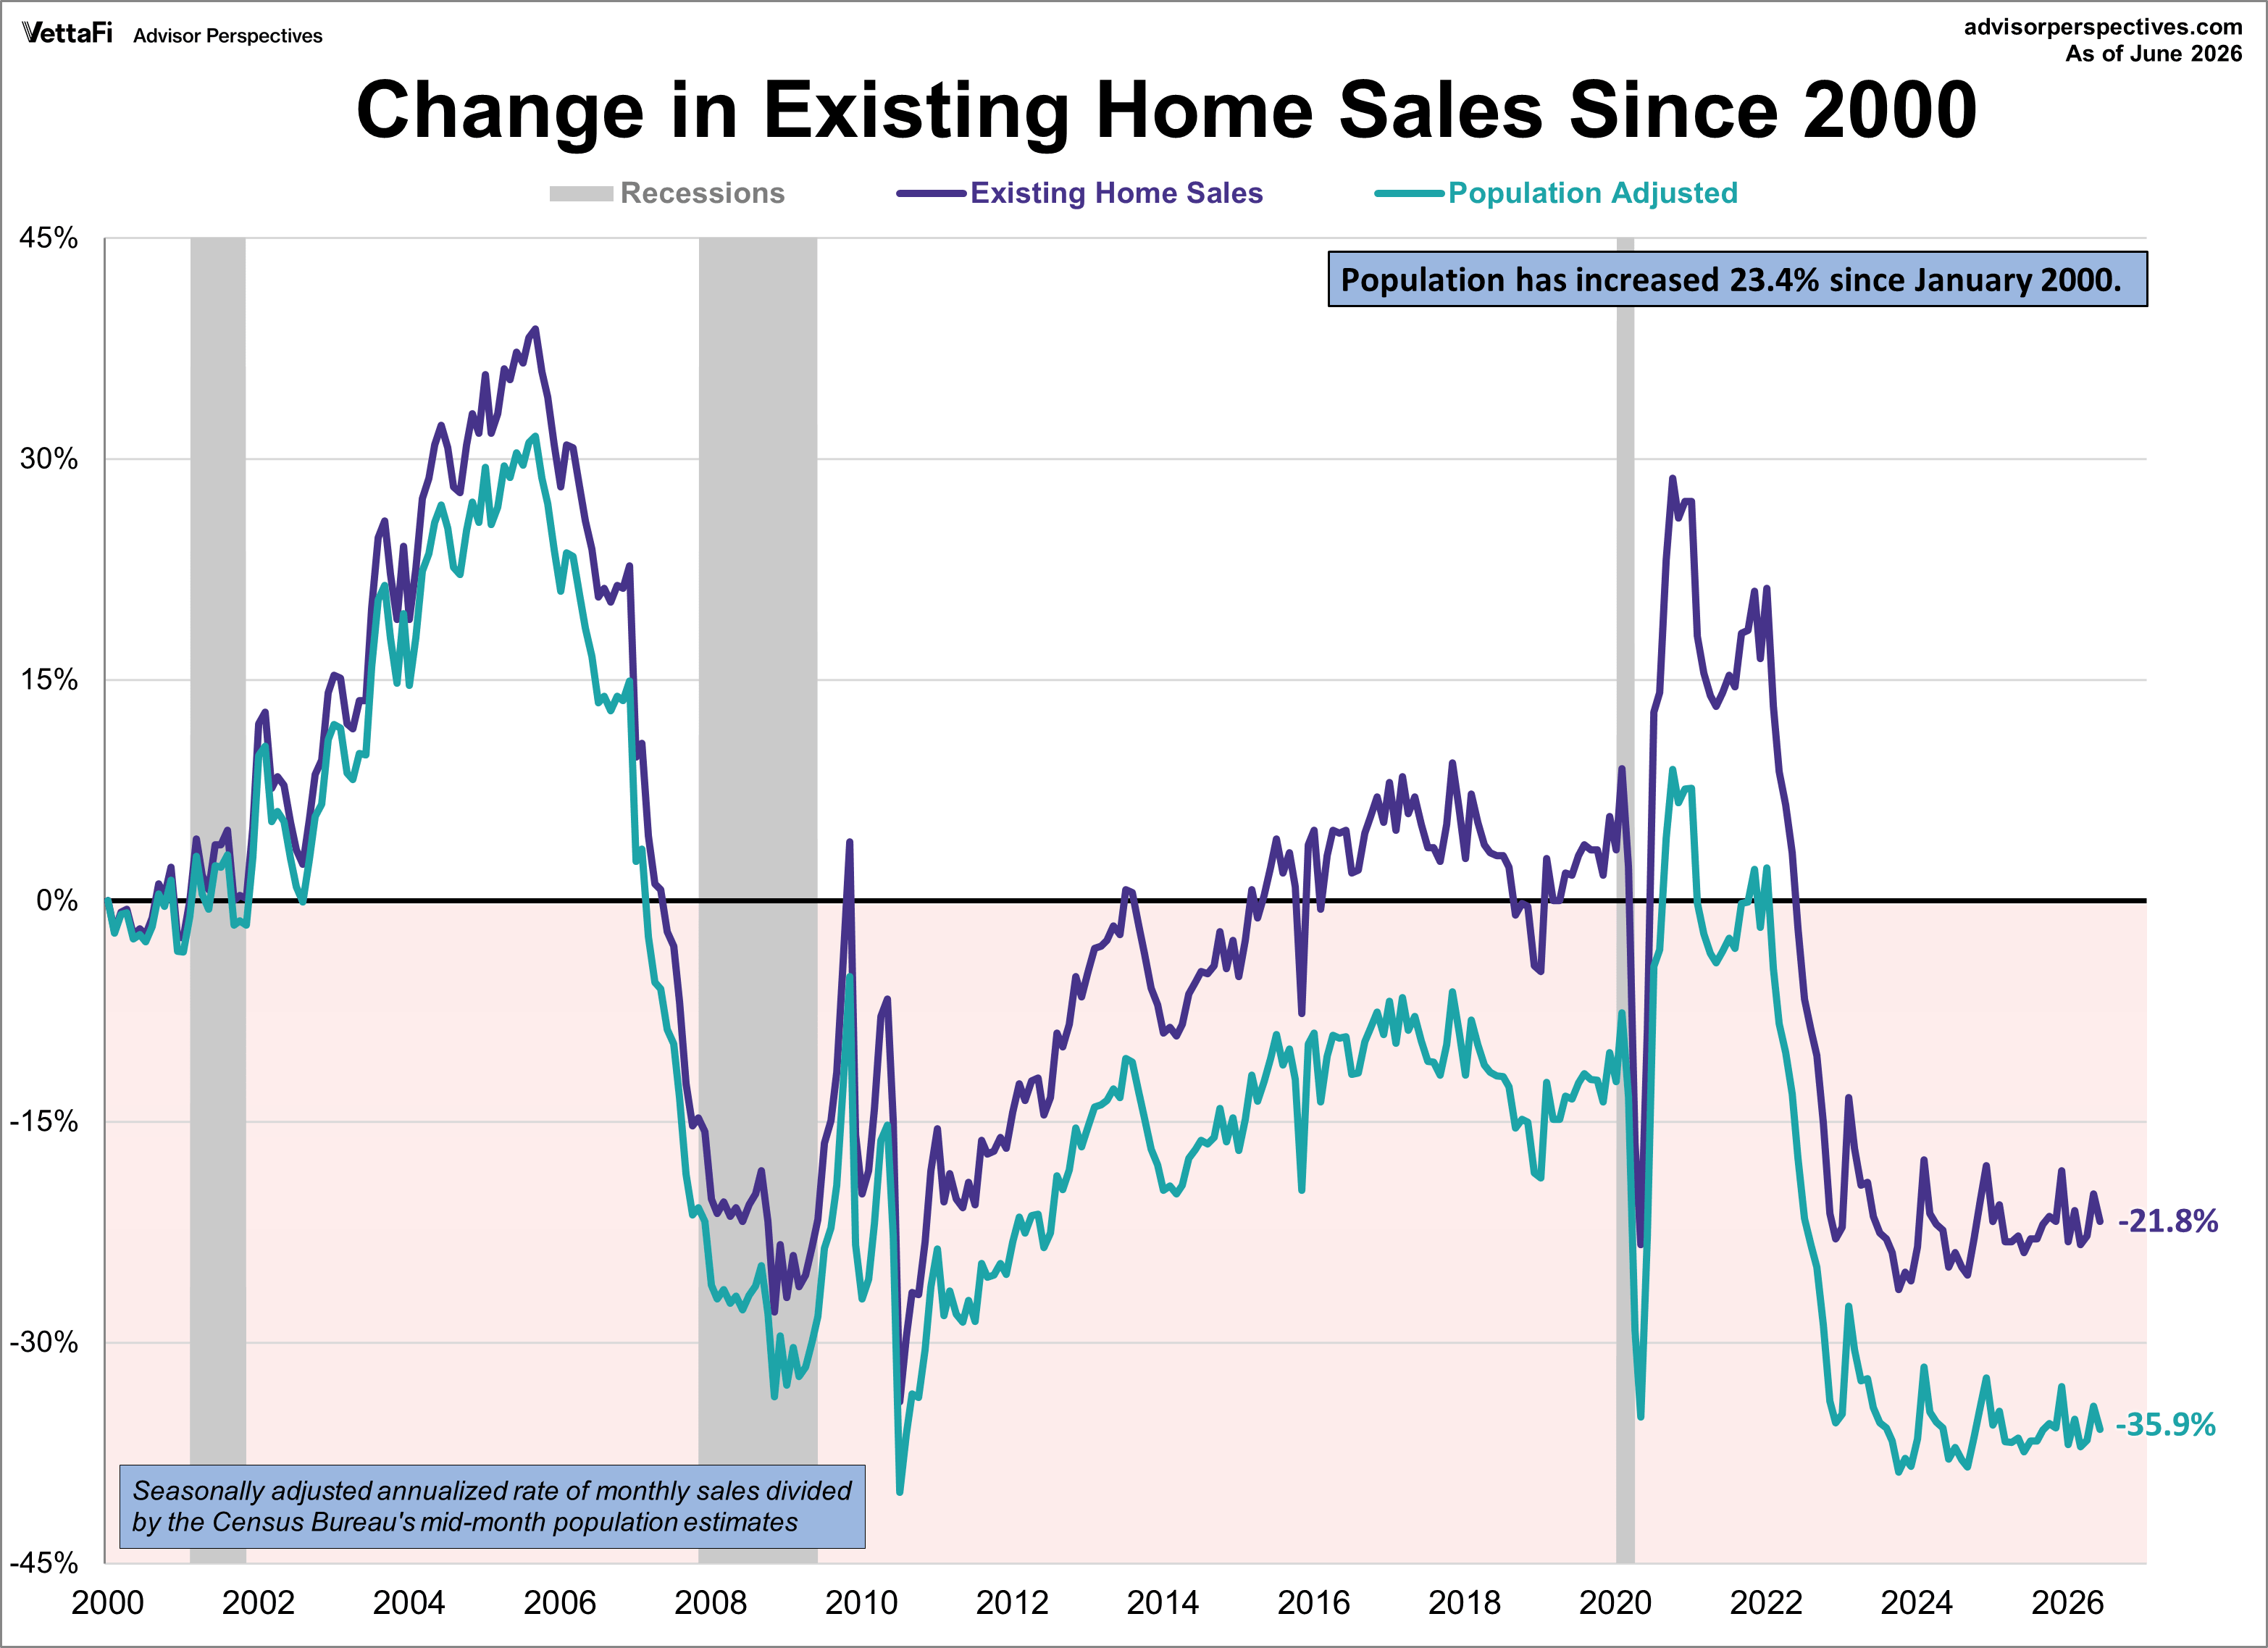
- Adjusted for a 23.4% population growth since 2000, current existing home sales volume actually sits 35.9% below turn-of-the-century levels.
Insights from the NAR
Reflecting on the latest data, NAR Chief Economist Dr. Lawrence Yun highlighted the ongoing tug-of-war between shifting buyer affordability and overall economic resilience:
“The back-and-forth in monthly home sales activity, driven by mild fluctuations in mortgage rates, shows how sensitive home buyers are to affordability conditions,” said NAR Chief Economist Lawrence Yun. “However, job gains—more than half a million since the beginning of the year—will continue to provide support for the housing market.”
Background: Why Existing Home Sales Matter
Existing home sales measures the monthly sales of previously owned single-family homes, condos, and co-ops. Because they account for roughly 90% of the residential market, they serve as a vital pulse check on the broader economy.
There is a high correlation between these sales and broader consumer spending. A move into a "new" existing home typically triggers secondary purchases in furnishings, appliances, and home improvement. Conversely, a sustained downturn in this data often serves as a leading indicator of economic contraction.
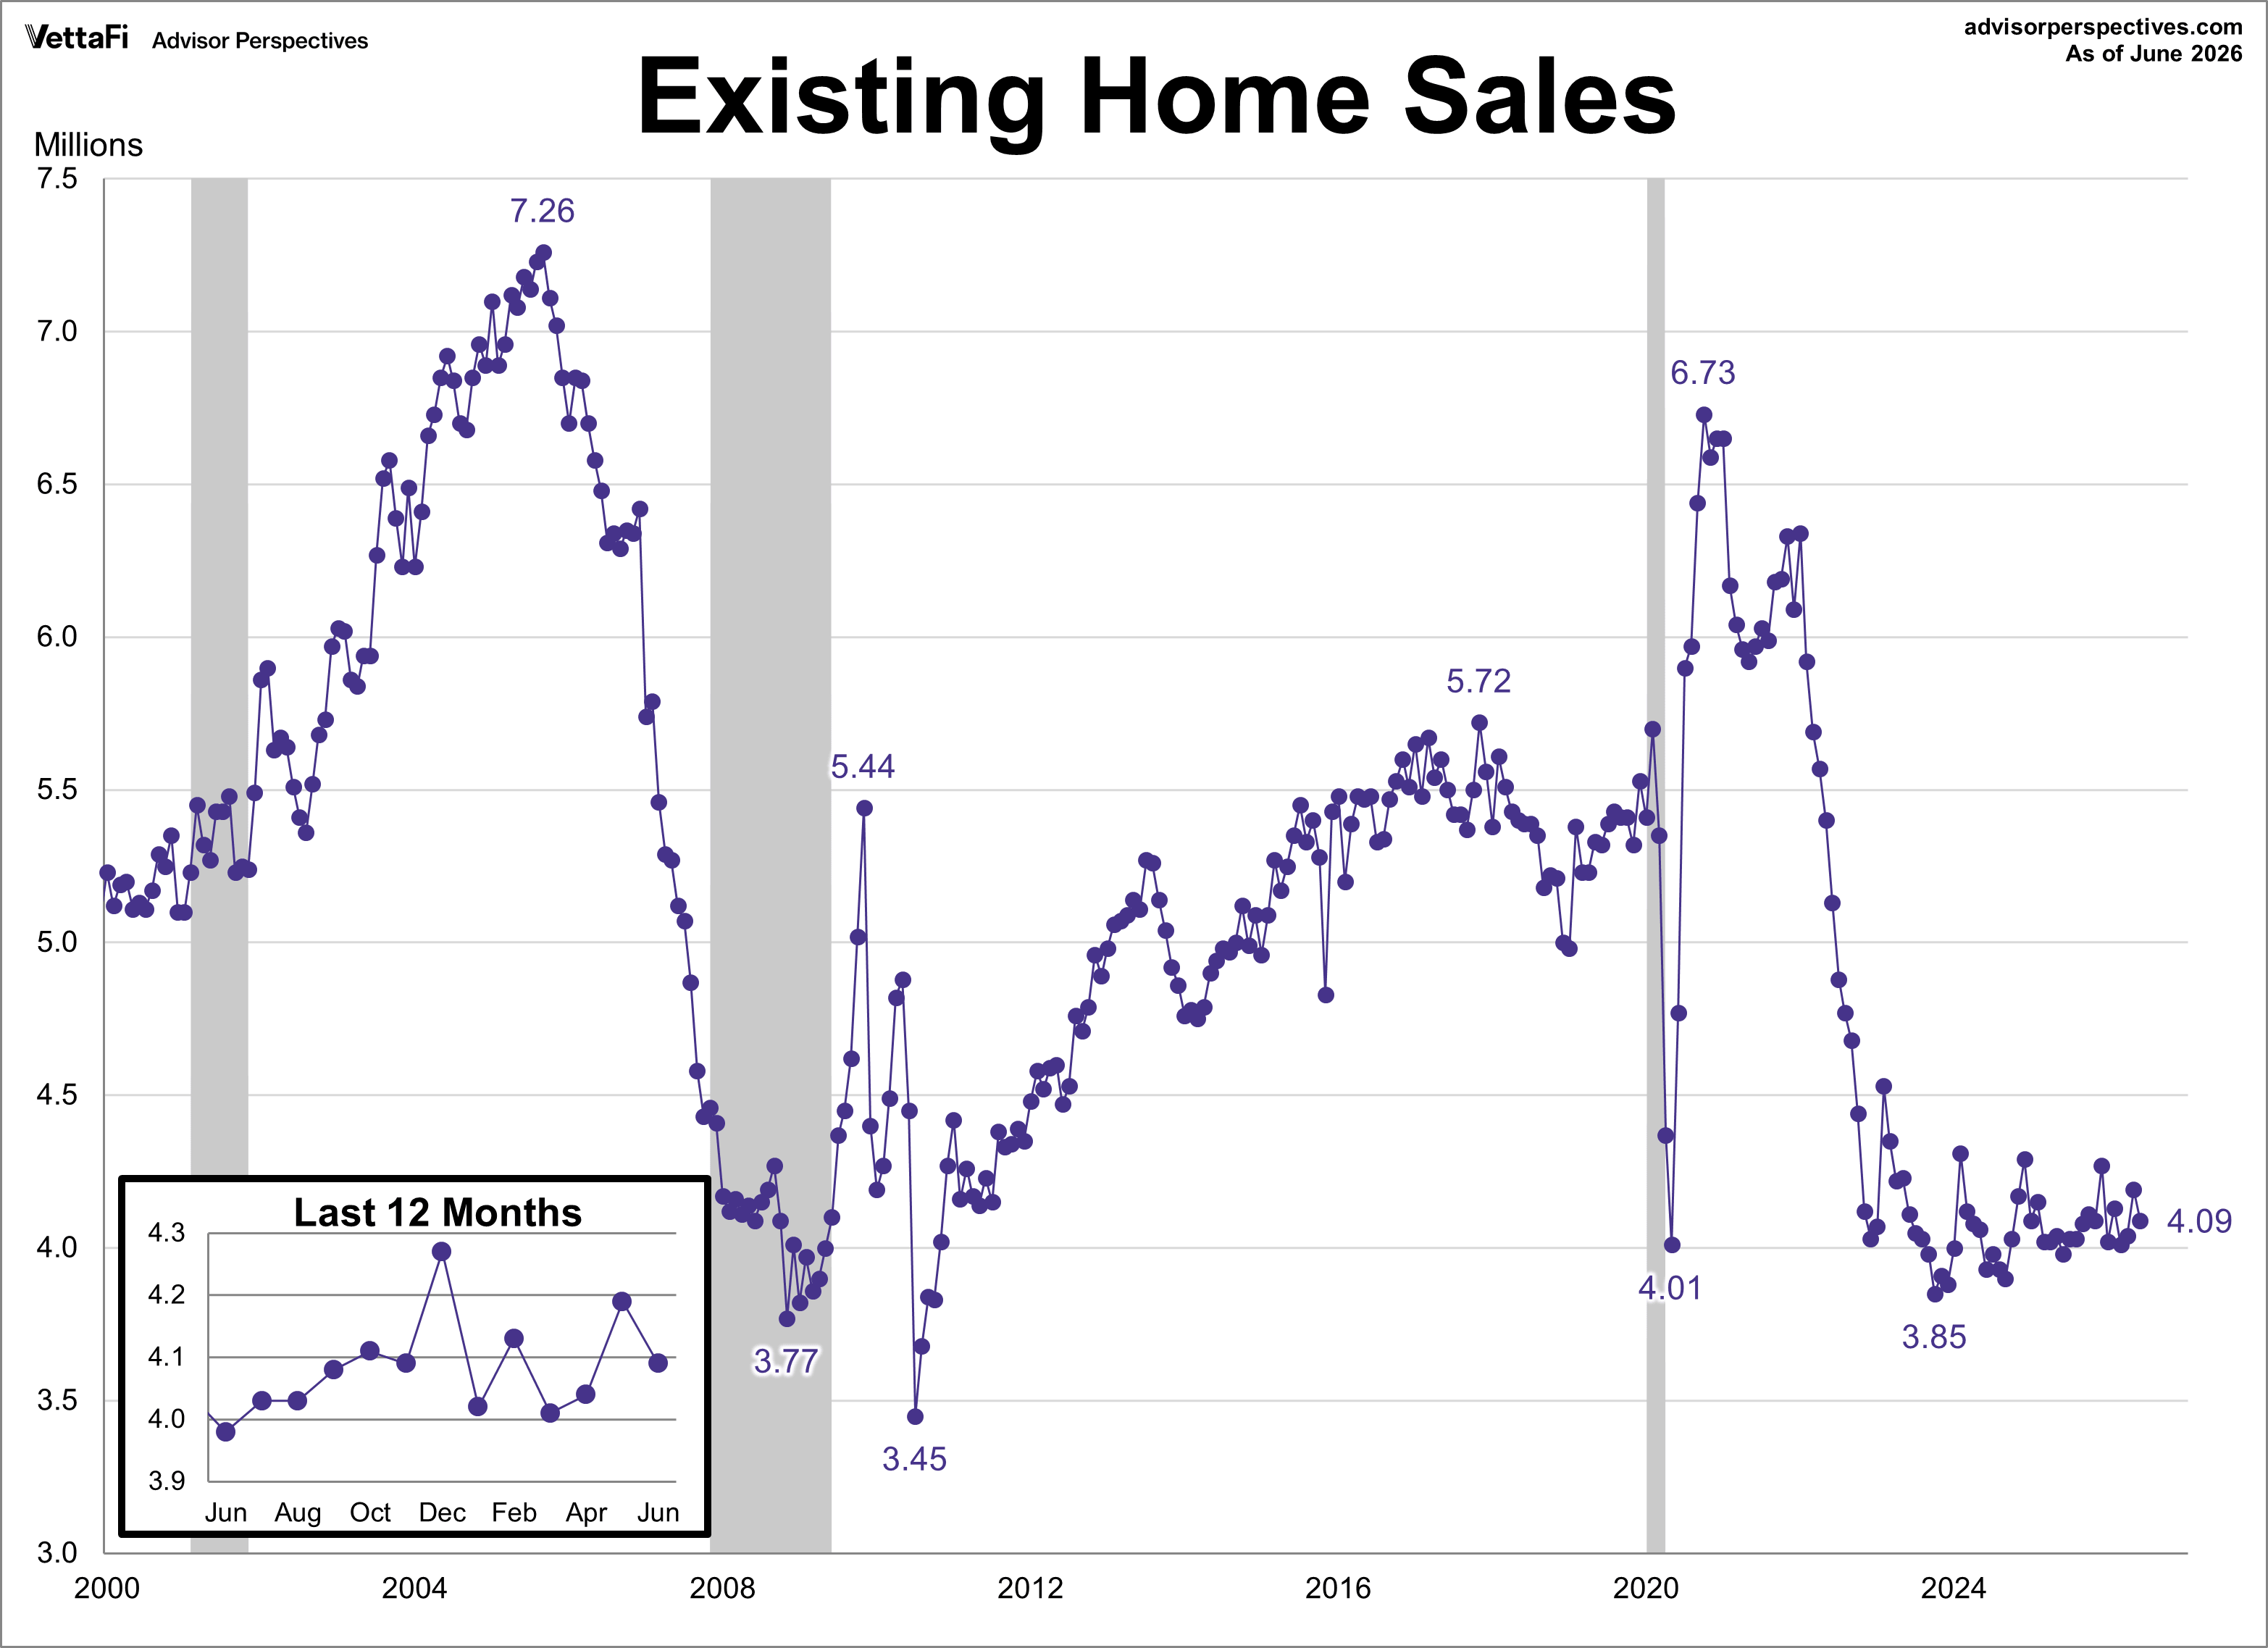
Over this time frame, we clearly see the real estate bubble, which peaked in 2005 and then fell dramatically. Sales were volatile for the first year or so following the Great Recession with monthly sales as low as 3.45 million units to as high as 5.44 million units. We have seen that same volatility following the most recent recession, with sales ranging between 3.85 million units to 6.73 million units.
Existing Home Sales: The Population-Adjusted Reality
While raw data shows a market in flux, adjusting for population growth reveals a deeper trend. Since 2000, the U.S. population has grown by approximately 23.4%. Existing home sales are 21.8% below the NAR's January 2000 estimate but when we account for population growth, current sales levels are 35.9% below turn-of-the-century levels.
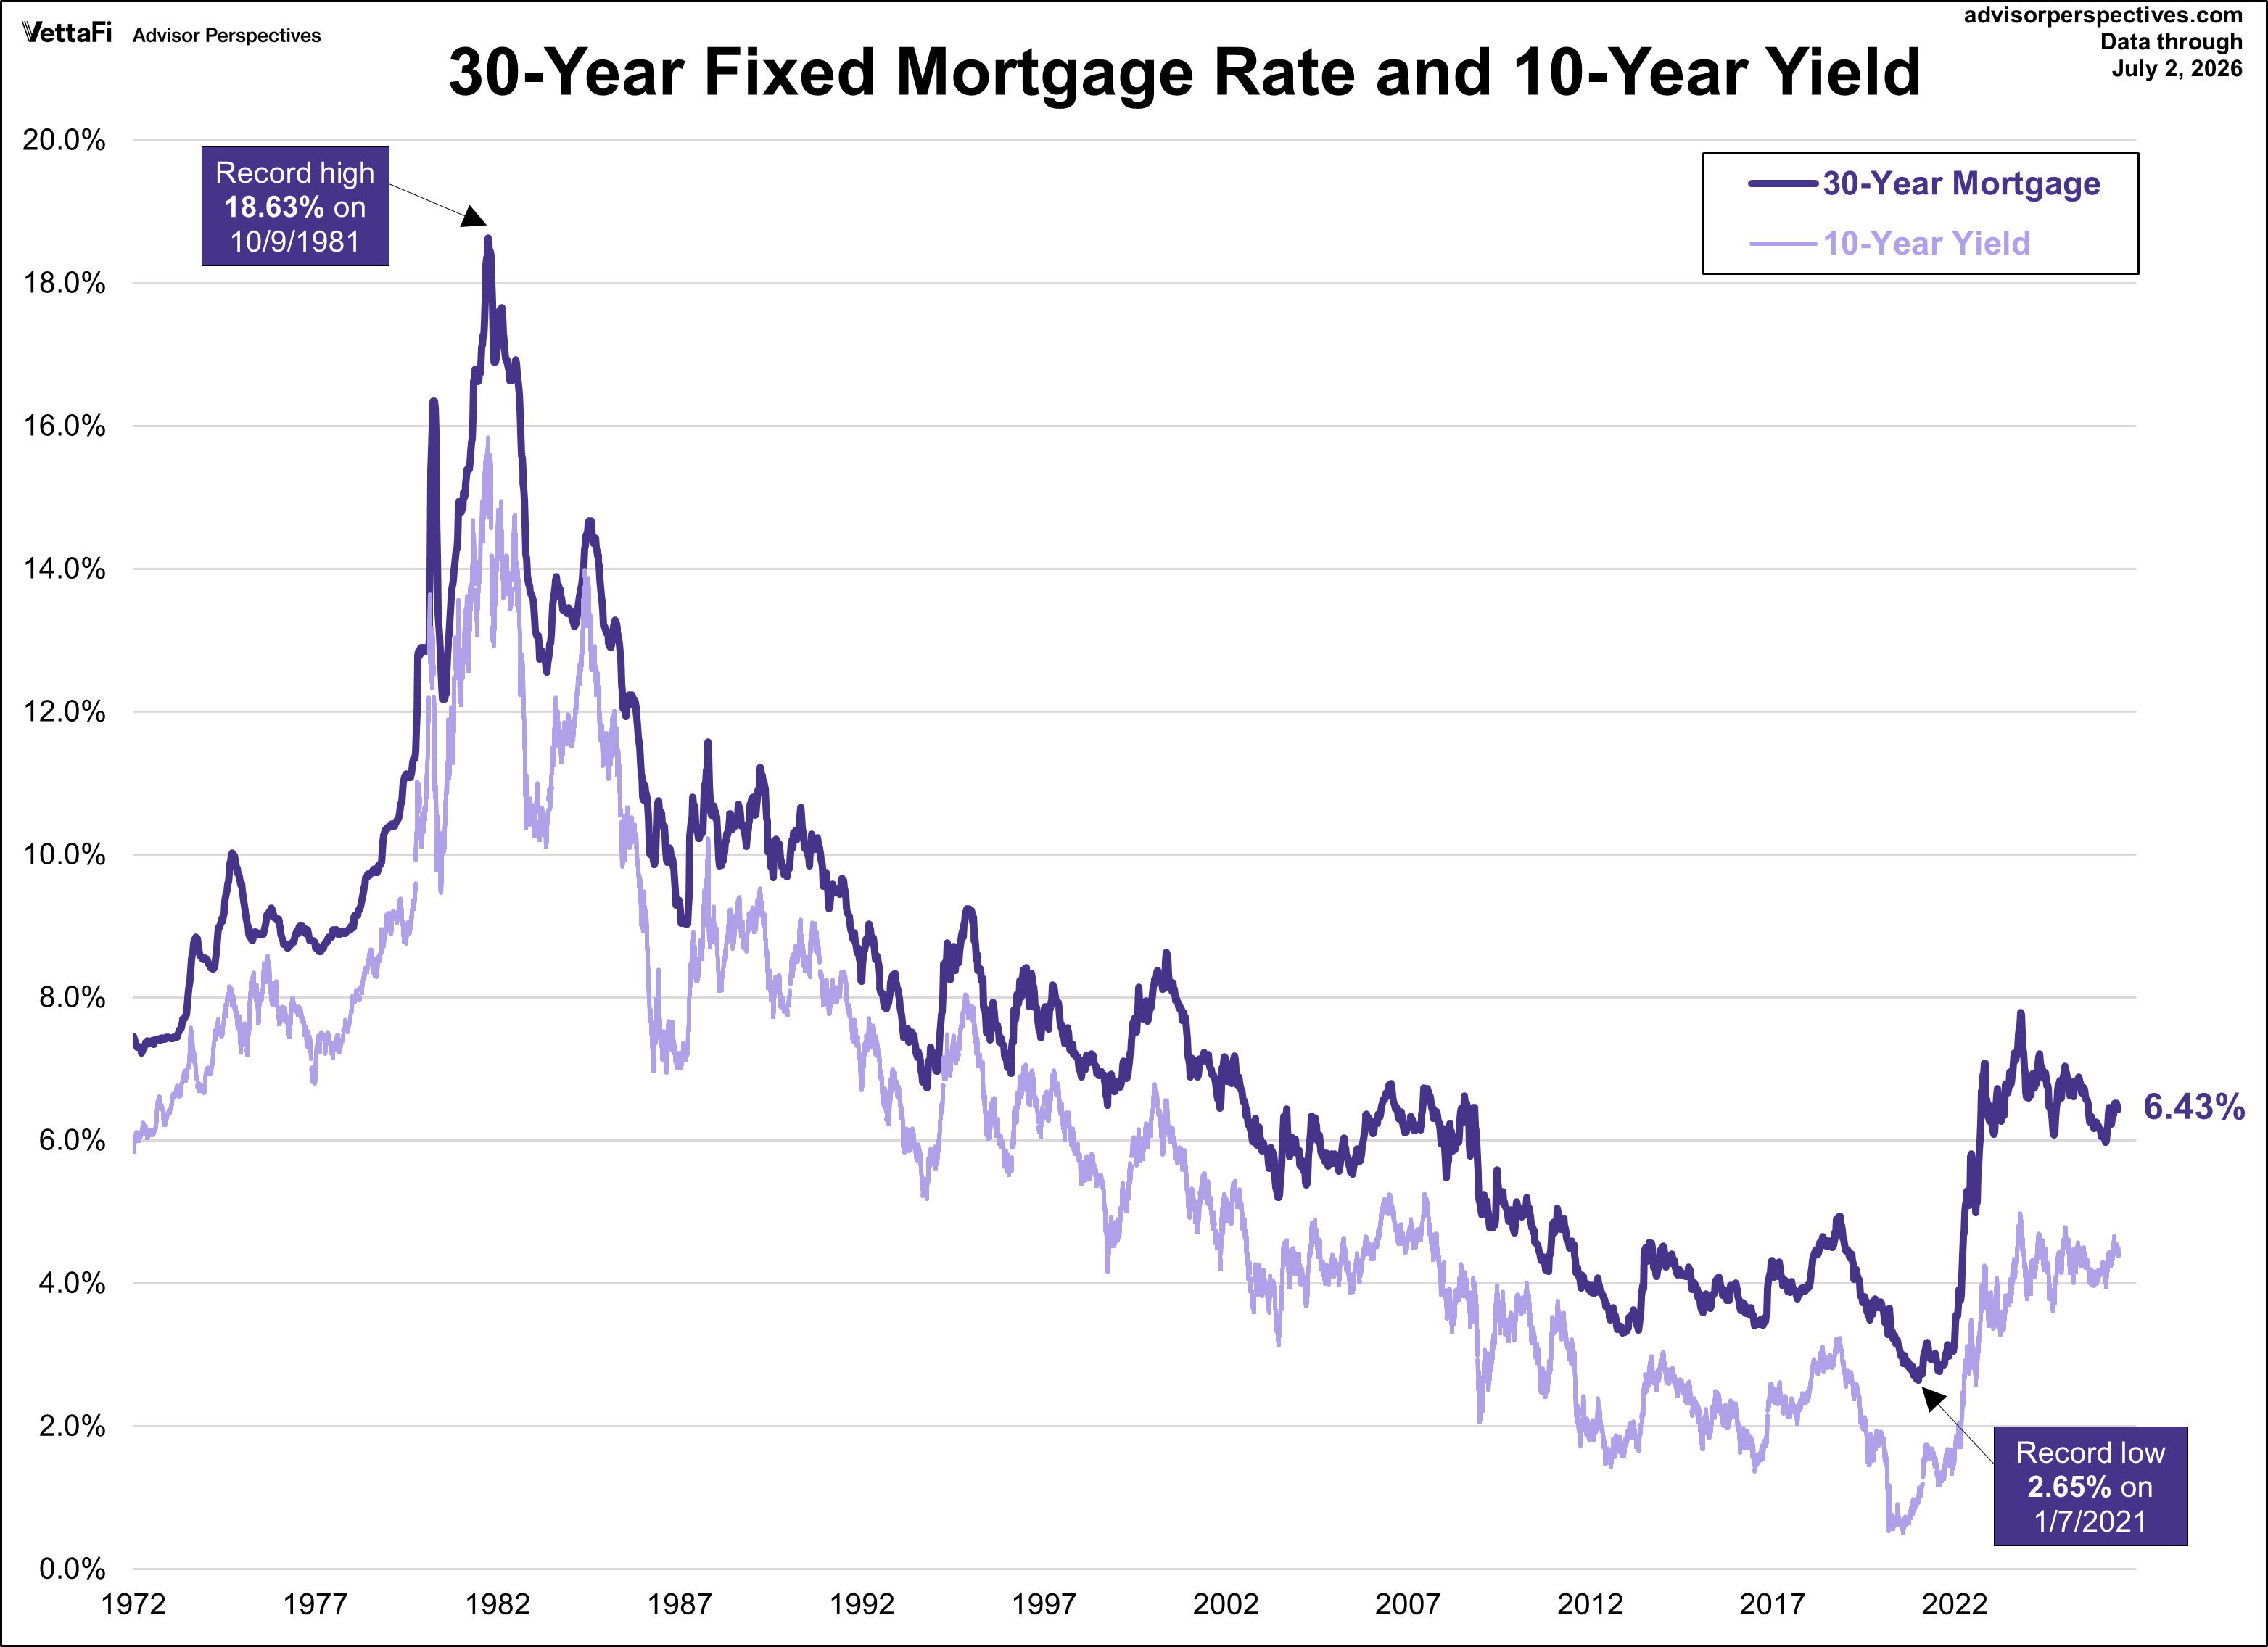
The 30-Year Fixed Rate Mortgage
According to Freddie Mac, the average 30-year fixed rate mortgage in June 2026 was 6.49%, the highest level since last August.
Existing Home Sales: Median Price
The median price for an existing home rose for a fifth straight month in June to $440,600, the highest level in history. This represents a 2.2% increase from the previous month and a 1.8% increase from one year ago, marking the 36th consecutive month of year-over-year increases.
Addressing the record-breaking price growth and the critical factors dictating the market's future, Yun added:
“The median home price has reached an all-time high. Even so, affordability is better than a year ago because wage growth is outpacing home price growth,” Yun continued. “However, progress on long-term housing affordability could be hampered if inventory growth continues to stall. Without consistent gains in inventory, home prices can accelerate. It is critical to introduce more supply to the market to widen the opportunity for homeownership.”
ETFs associated with residential real-estate include: iShares Residential and Multisector Real Estate ETF (REZ).
Read more updates by Jen Nash