The Case for Small-Cap Investing: A Cyclical Story, Not a Broken One
Membership required
Membership is now required to use this feature. To learn more:
View Membership Benefits
Key Takeaways
- Small caps are enduring one of the deepest, most prolonged stretches of underperformance versus large caps in nearly 90 years of market history.
- Every prior cycle of extended small-cap weakness since the 1930s has eventually reversed, though history offers no guarantee that pattern repeats.
- Academic research indicates the size premium is concentrated in higher-quality, better-valued small caps rather than the broad small-cap universe.
Open any market commentary today and the conversation is dominated by giants. Mega-cap technology companies command outsized shares of major indexes, and the private markets tell a similar story, as we watch companies increasingly staying private well past the point where they once would have gone public. When they finally do list, they often arrive already valued at $1 billion, $10 billion or even $100 billion or more. Size, it seems, has become the story of this market cycle.
Against that backdrop, small-cap stocks have largely faded into the background. Not only have they received less attention, they’ve also delivered weaker returns, trailing their large-cap counterparts for an extended stretch. For investors who came of age professionally during this period, it would be easy to conclude that “small” has simply stopped working as an investment concept.
However, we have to remember that market cycles are exactly that, cycles. Periods of extreme size concentration have happened before, and they have eventually given way to broader participation.
Is this the moment small caps deserve a second look?
See more: Rate Hikes and Market Impacts
The Pendulum of Size: Small- and Large-Cap Leadership since the 1930s
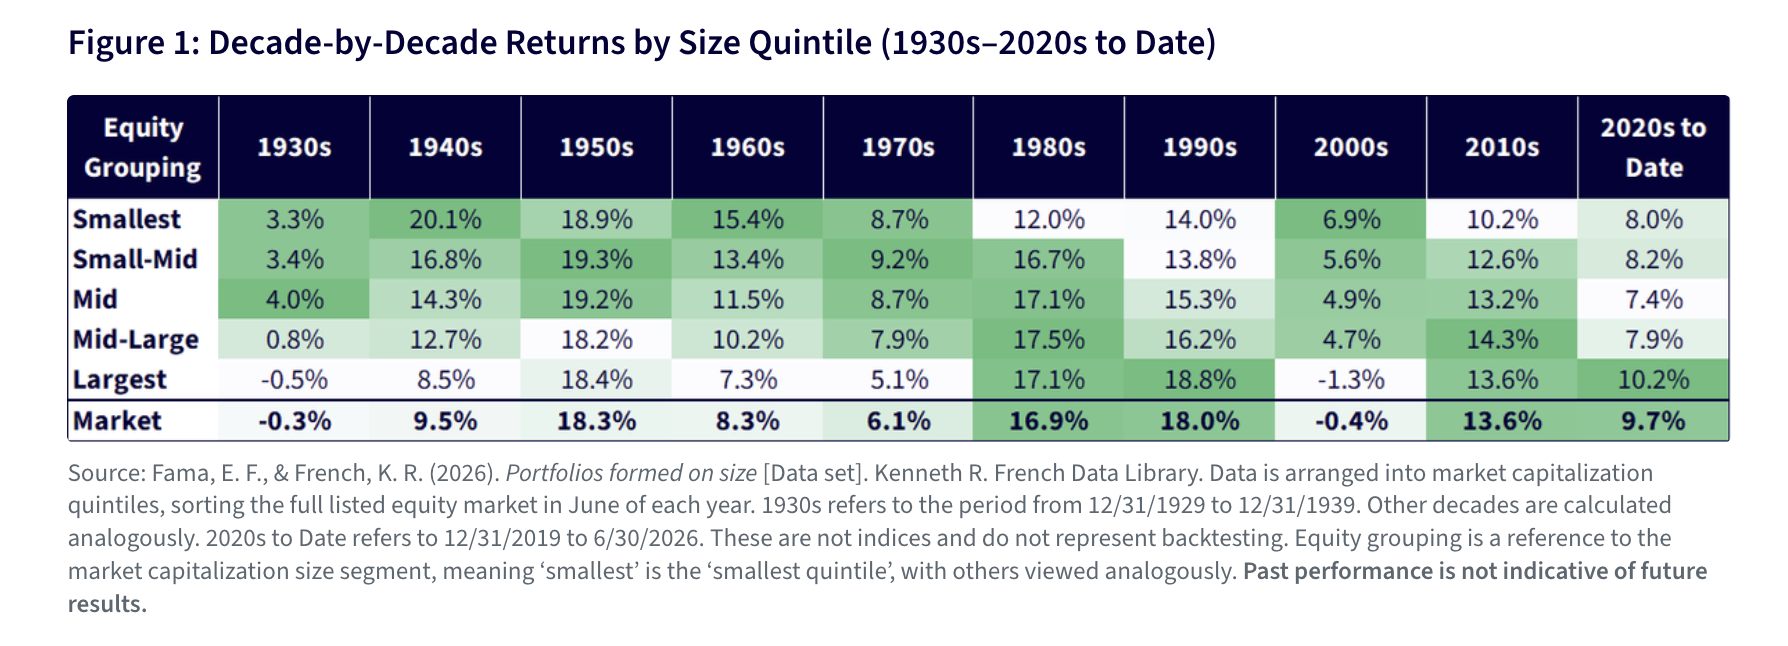
Looking at small-cap performance decade by decade, as we do in Figure 1, tells a more useful story than any single long-run average, because it shows that size leadership has moved in extended cycles, and those cycles tend to line up with periods investors may already remember. For example:
- In the 1930s and 1960s, the smallest stocks meaningfully outpaced the broader, large-cap-dominated market.
- The 1970s, an era defined by stagflation and skepticism toward the largest, most established companies, again favored smaller companies.
- The 1980s and especially the 1990s told the opposite story: as the ‘Tech Bubble’ inflated, the largest companies pulled decisively ahead, with mega-cap strength doing the heavy lifting for the overall market’s returns.
- That leadership reversed sharply in the 2000s, when the largest stocks posted negative returns for the decade while smaller companies held up far better in the post-Tech Bubble unwind.
- The 2010s marked another shift back toward size, with a long bull market increasingly concentrated in a small number of mega-cap technology winners, and the largest stocks once again outpaced the smallest. There was a huge advantage accruing to companies with massive bases of users.
- That pattern has persisted into the current decade, defined thus far by the ‘AI-Buildout,’ with the largest companies still ahead of the smallest so far.
Rolling 10-Year Returns: Measuring the Depth of the Current Cycle
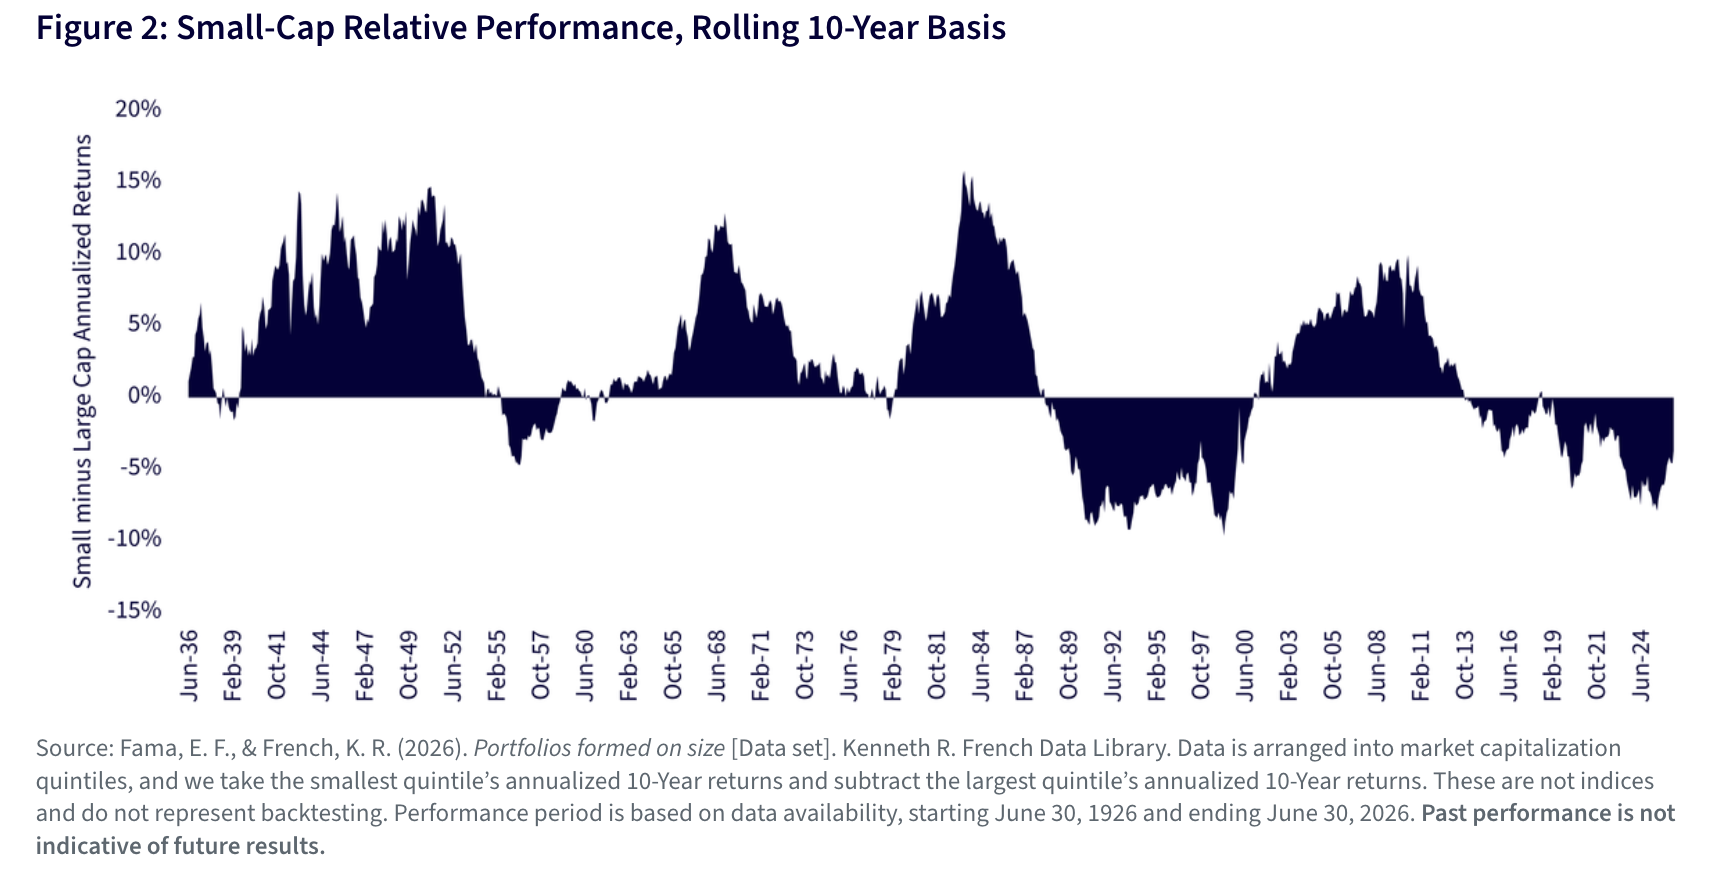
Viewed through a rolling 10-year lens, the size premium looks less like a steady tailwind and more like a slow-moving pendulum. Small-cap outperformance has historically arrived in prolonged waves, multi-year stretches where rolling 10-year returns for small caps relative to large caps climbed well into positive double digits, followed by equally prolonged stretches where the pendulum swung the other way. Each of these cycles has played out over the better part of a decade or more, not months or quarters, which is precisely why decade-level thinking is a useful lens for this equity size segment.
The current cycle stands out for its depth and duration. Small caps have now spent an extended period in negative territory relative to large caps, an underperformance that ranks among the deepest and most prolonged readings in this nearly 90-year history. History suggests these extended negative stretches have not persisted indefinitely, as every prior cycle of sustained small-cap underperformance was eventually followed by a swing back toward small-cap leadership. That doesn’t guarantee the pattern repeats, but it does frame the current environment as one point in a recurring cycle, rather than as evidence that the size premium itself has permanently disappeared.
The Academic Record on Small-Cap Outperformance
The performance gap between small and large stocks has been studied by academics since the early 1980s, and three papers in particular help explain both why the small-cap premium exists and why it has proven so difficult to count on.
The starting point is Rolf Banz’s 1981 study, widely credited as the first rigorous documentation of what became known as the “size effect.” Analyzing NYSE common stocks from 1936 to 1975, Banz found that the smallest firms in his sample earned meaningfully higher risk-adjusted returns than the largest firms, a result the standard asset pricing model of the time, the Capital Asset Pricing Model, could not explain. Importantly, Banz was careful about what he had and had not shown. The effect, he found, was not linear. It was concentrated almost entirely in the very smallest firms, with little difference between mid-sized and large companies. He was also explicit that his data could not determine whether size itself was the cause, or whether size was simply standing in for some other, unidentified risk factor. That humility has aged well; more than 40 years later, the “why” behind the size effect remains genuinely unsettled.1
A more recent contribution from Eugene Fama and Kenneth French, the researchers most responsible for turning “size” into a standard factor in asset pricing, adds an important nuance. Their 2007 paper on stock migration found that the size premium is not a broad, evenly distributed edge held by small stocks in general. Instead, it comes almost entirely from a specific subset.
This is defined as small stocks that perform so well that they graduate into the “big” category the following year.
Stocks that stay small, by contrast, contribute little to the premium, and in some cases even work against it. This reframes the size effect less as “small stocks reliably beat large stocks” and more as “the small-cap universe periodically produces its own future large caps,” a meaningfully different and more nuanced story.2 Reading this made me think about what we have been seeing in private markets in the 2020s, and how if this transition happens when companies are still private it shifts the entirety of how we might even measure it.
Finally, Mathijs van Dijk’s 2011 review of three decades of size-effect research captures why the debate has never fully settled. Van Dijk documents that the size premium appeared to weaken, and by some measures disappear, in the U.S. after the early 1980s, only to reemerge with force in the 2000s, when small stocks outperformed large stocks by more than 11% annualized. His conclusion is deliberately cautious, noting that stock returns are noisy enough, and the historical record short enough, that declaring the size effect “dead,” or fully validated, is premature in either direction.3
Taken together, these three papers suggest the size premium is real but conditional.
- It has existed historically
- It tends to be driven by a subset of dramatic winners rather than the average small stock
- It moves through extended cycles of strength and weakness that are difficult to predict in advance
Screening for Quality and Value within Small-Cap Equities
Splitting small caps by quality and valuation reveals that “small cap” performance depends heavily on which small caps an investor owns. Two classic sorting methods make this particularly visible.
- Operating profitability,4 a measure of quality.
- Book-to-market value, a measure of how cheaply (or expensively) a stock trades relative to its underlying assets.
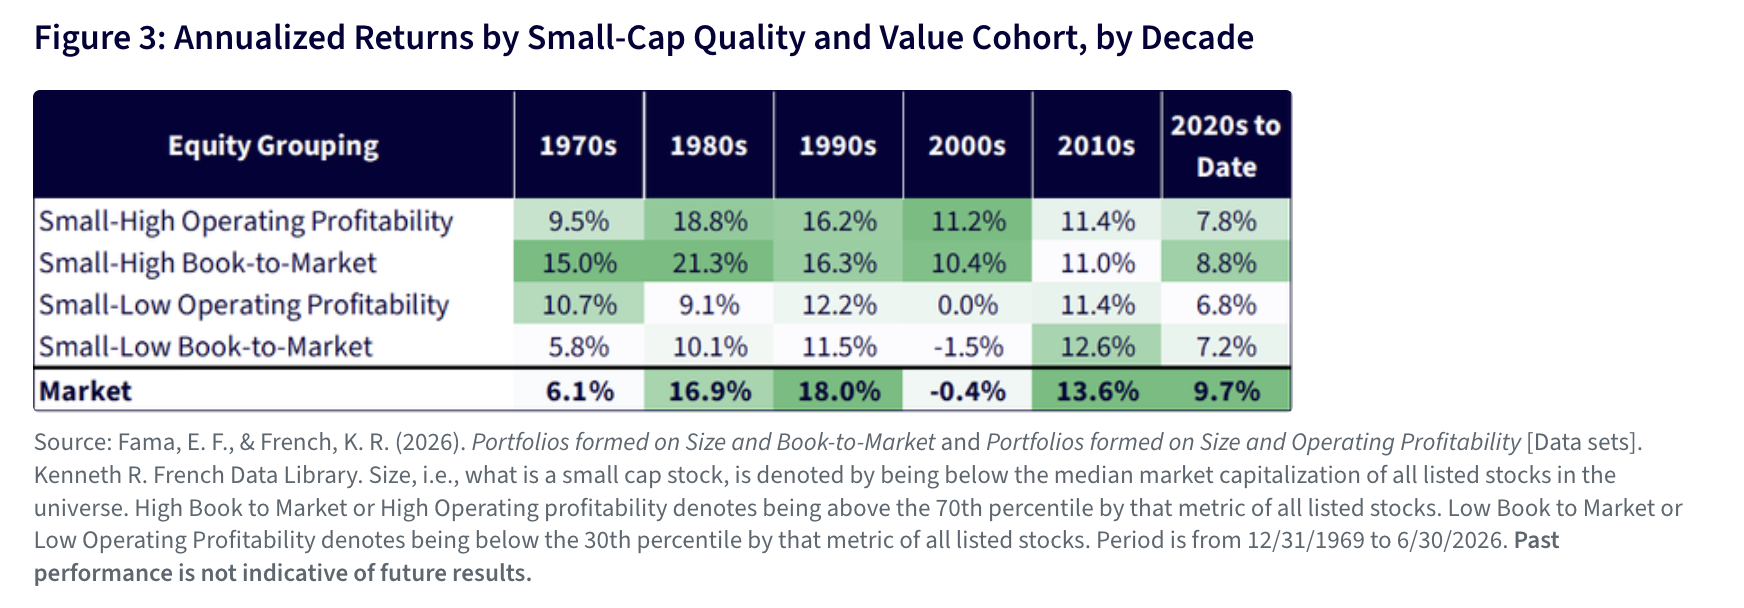
The decade-by-decade pattern, which we denote in Figure 3, shows a consistent tilt.
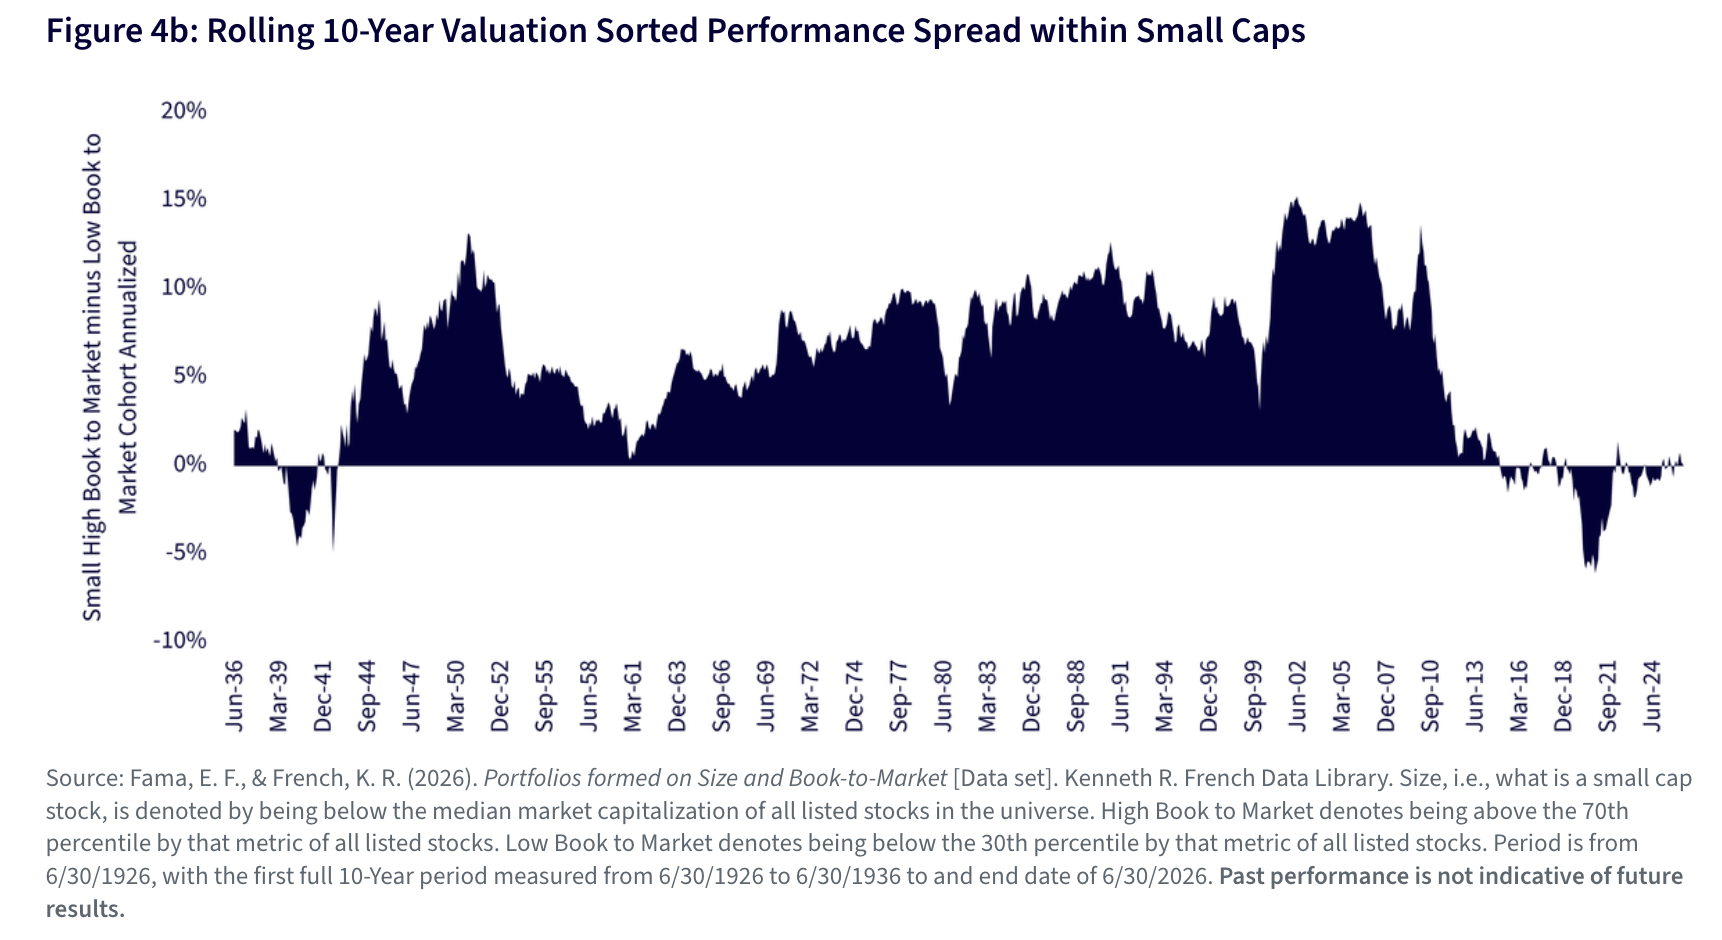
- Small-cap stocks with high book-to-market ratios, namely the less expensive, more traditionally “value” segment of the small-cap universe, outperformed their low book-to-market, often termed as ‘growth’ counterparts in most decades shown, including a wide gap in the 1970s and 1980s.
- Small caps with high operating profitability told a similar story relative to low-profitability small caps, though the gap was generally narrower than the valuation-based split.
In the current decade to date, both high-quality and value-oriented small caps have outpaced their low-quality and low-value counterparts, even as small caps overall have lagged the broader market. This suggests that within a difficult environment for small caps as a category, the case for being selective about which small caps to own, favoring such characteristics as profitability and reasonable valuation, has remained intact rather than breaking down alongside the broader size premium.
Rolling 10-Year Returns for Small-Cap Quality and Value
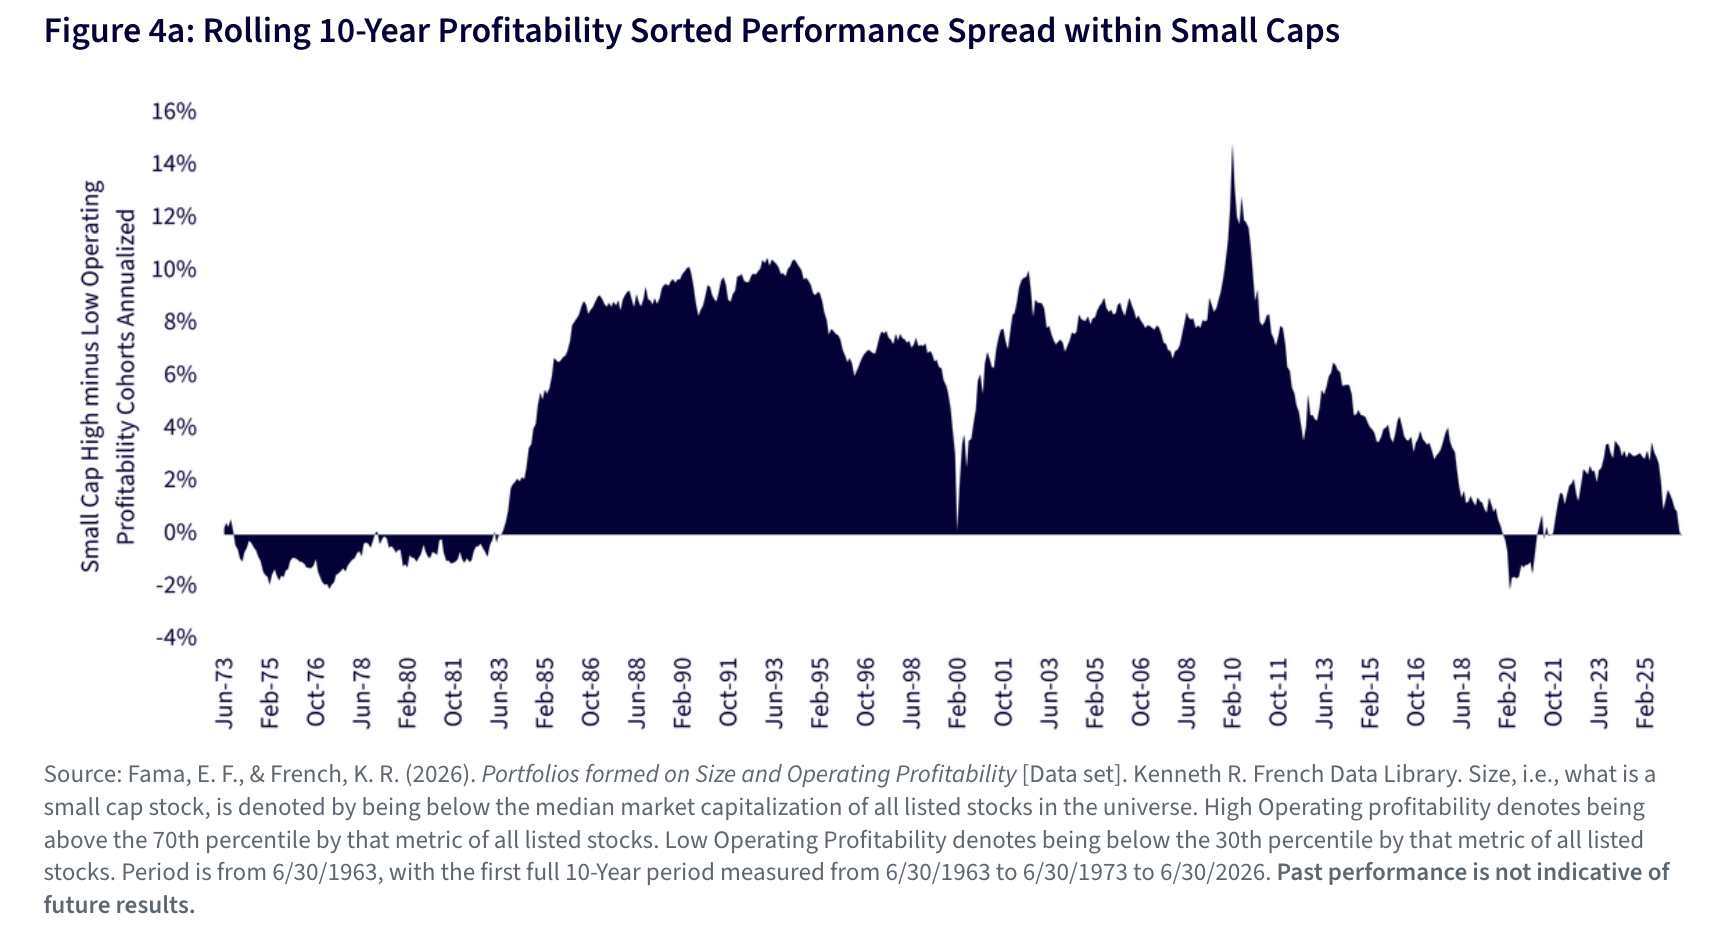
Viewed on a rolling 10-year basis, the quality and value tilts within small caps tell a different story than the broad size premium itself. Rather than the multi-decade pendulum swings seen in small-versus-large returns, both the profitability spread and the value spread have spent the overwhelming majority of their history in positive territory. The high-profitability and high-book-to-market cohorts have outperformed their low-quality, low-value counterparts almost continuously since the 1980s, with only brief, shallow dips below zero, around 1999-2000 and again in the 2020s for profitability, and in the early 1940s and around 2020 for value.
Conclusion: Small-Cap Value and Quality: What the Academic Record Actually Says
The recent stretch of underwhelming small-cap performance can feel like fresh evidence against the idea that small caps truly bring something additive to portfolio allocations. The academic record, however, may suggest something more specific.
What may manifest like a broken size effect has often been a composition problem rather than a disappearance problem.
Asness et al. (2018) make this case directly. Working with nearly a century of U.S. data and 24 international markets, they showed that the standard size premium (SMB) has historically been weak, unstable, easily dismissed, concentrated in microcaps, present mostly in January and largely absent from 1980 through 1999. However, once they control for firm quality (profitability, stability, safety and low investment), the size premium became stable, monotonic across deciles, present in every month, robust to non-price measures of size and evident across virtually every industry and country tested. Their explanation was straightforward.
Small-cap indices are not a uniform basket. They are disproportionately populated by “junk,” which is to say low-quality, financially fragile firms, and that junk exposure is what has historically dragged down and destabilized the raw size premium.
Strip the junk out, or at least control for it statistically, and a real premium comparable in magnitude to value and momentum re-emerged in the data.5
Scislaw and McMillan’s (2014) work on the value premium in small caps told a complementary story from the practitioner side. They found that the theoretical value-minus-growth premium documented in academic (Fama-French style) portfolios largely vanished once realistic, investable constituency rules were applied, rules that simply excluded the smallest, most illiquid and most distressed names. Critically, the benefit of removing those names was asymmetric. Growth portfolios gained three to four times more than value portfolios did, because the worst-performing junk in small caps tended to sit disproportionately in the growth bucket. The practical result was that market-based, investable small-cap value funds have not reliably outperformed their growth counterparts, not because the value premium is fictional, but because building a truly investable portfolio already filters out much of the junk that both of these academic papers identified as the real driver of the effect.6
Read together, these two papers point to the same underlying mechanism working from opposite directions.
Raw, unscreened small-cap exposure is contaminated by a persistent subpopulation of low-quality, often illiquid firms, and that contamination is what has repeatedly made size and value premiums look weak, seasonal or absent in aggregate small-cap data.
In our view, this has direct relevance to the current environment. The narrative that “small caps aren’t working” is, in this light, not new. It echoes the exact “embarrassment” period Asness et al. document for 1980–1999, when the unconditional size premium went dormant for two decades despite a real, quality-adjusted premium persisting underneath it the entire time.
The forward-looking implication is not, in our opinion, that size or value has stopped mattering, but that harvesting either premium requires quality discipline as a precondition, not an afterthought. Indiscriminate small-cap exposure may continue to disappoint for the same structural reasons it has disappointed before; small-cap exposure paired with a profitability or quality screen has a much stronger claim on the historical record, and, by extension, a stronger claim on what should be expected going forward.
1 Source: Banz, R. W. (1981). The relationship between return and market value of common stocks. Journal of Financial Economics, 9(1), 3–18.
2 Source: Fama, E. F., & French, K. R. (2007). Migration. Financial Analysts Journal, 63(3), 48–58.
3 Source: van Dijk, M. A. (2011). Is size dead? A review of the size effect in equity returns. Journal of Banking & Finance, 35(12), 3263–3274.
4 In this piece, ‘operating profitability’ uses the definition noted by the Kenneth French Data Library, which is annual revenues minus cost of goods sold, interest expense and selling, general and administrative expenses divided by book equity for the last fiscal year end in t-1.
5 Source: Asness, C. S., Frazzini, A., Israel, R., Moskowitz, T. J., & Pedersen, L. H. (2018). Size matters, if you control your junk. Journal of Financial Economics, 129(3), 479–509.
6 Source: Scislaw, K. E., & McMillan, D. G. (2014). Portfolio constituency rules and the value premium in the small-cap space (Working paper).
Christopher Gannatti began at WisdomTree as a Research Analyst in December 2010, working directly with Jeremy Schwartz, CFA®, Director of Research.
Investors should carefully consider the investment objectives, risks, charges and expenses of the Funds before investing. U.S. investors only: To obtain a prospectus containing this and other important information, please call 866.909.9473, or click here to view or download a prospectus online. Read the prospectus carefully before you invest. There are risks involved with investing, including the possible loss of principal. Past performance does not guarantee future results.
You cannot invest directly in an index.
Foreign investing involves currency, political and economic risk. Funds focusing on a single country, sector and/or funds that emphasize investments in smaller companies may experience greater price volatility. Investments in emerging markets, real estate, currency, fixed income and alternative investments include additional risks. Due to the investment strategy of certain Funds, they may make higher capital gain distributions than other ETFs. Please see prospectus for discussion of risks.
WisdomTree Funds are distributed by Foreside Fund Services, LLC, in the U.S.
A message from Advisor Perspectives and VettaFi: Discover something new! Click here to register for our upcoming webcasts.
Membership required
Membership is now required to use this feature. To learn more:
View Membership Benefits