As the summer economic landscape takes shape, investors are navigating shifting monetary policy, stubborn inflation pressures, and unexpected market momentum. This week’s snapshot breaks down the most critical updates and data releases from the past week to give you a clear view of where the economy is heading.
We review the Federal Reserve's latest interest rate decision under its new leadership and look at the surprising strength of the American consumer. We also dive into a historic surge in investor leverage and the geopolitical headlines that ultimately steered major stock indices through a volatile trading week.
Key Takeaways
- The Fed unanimously held rates at 3.50%–3.75%, with new dot plot projections signaling a higher-for-longer path.
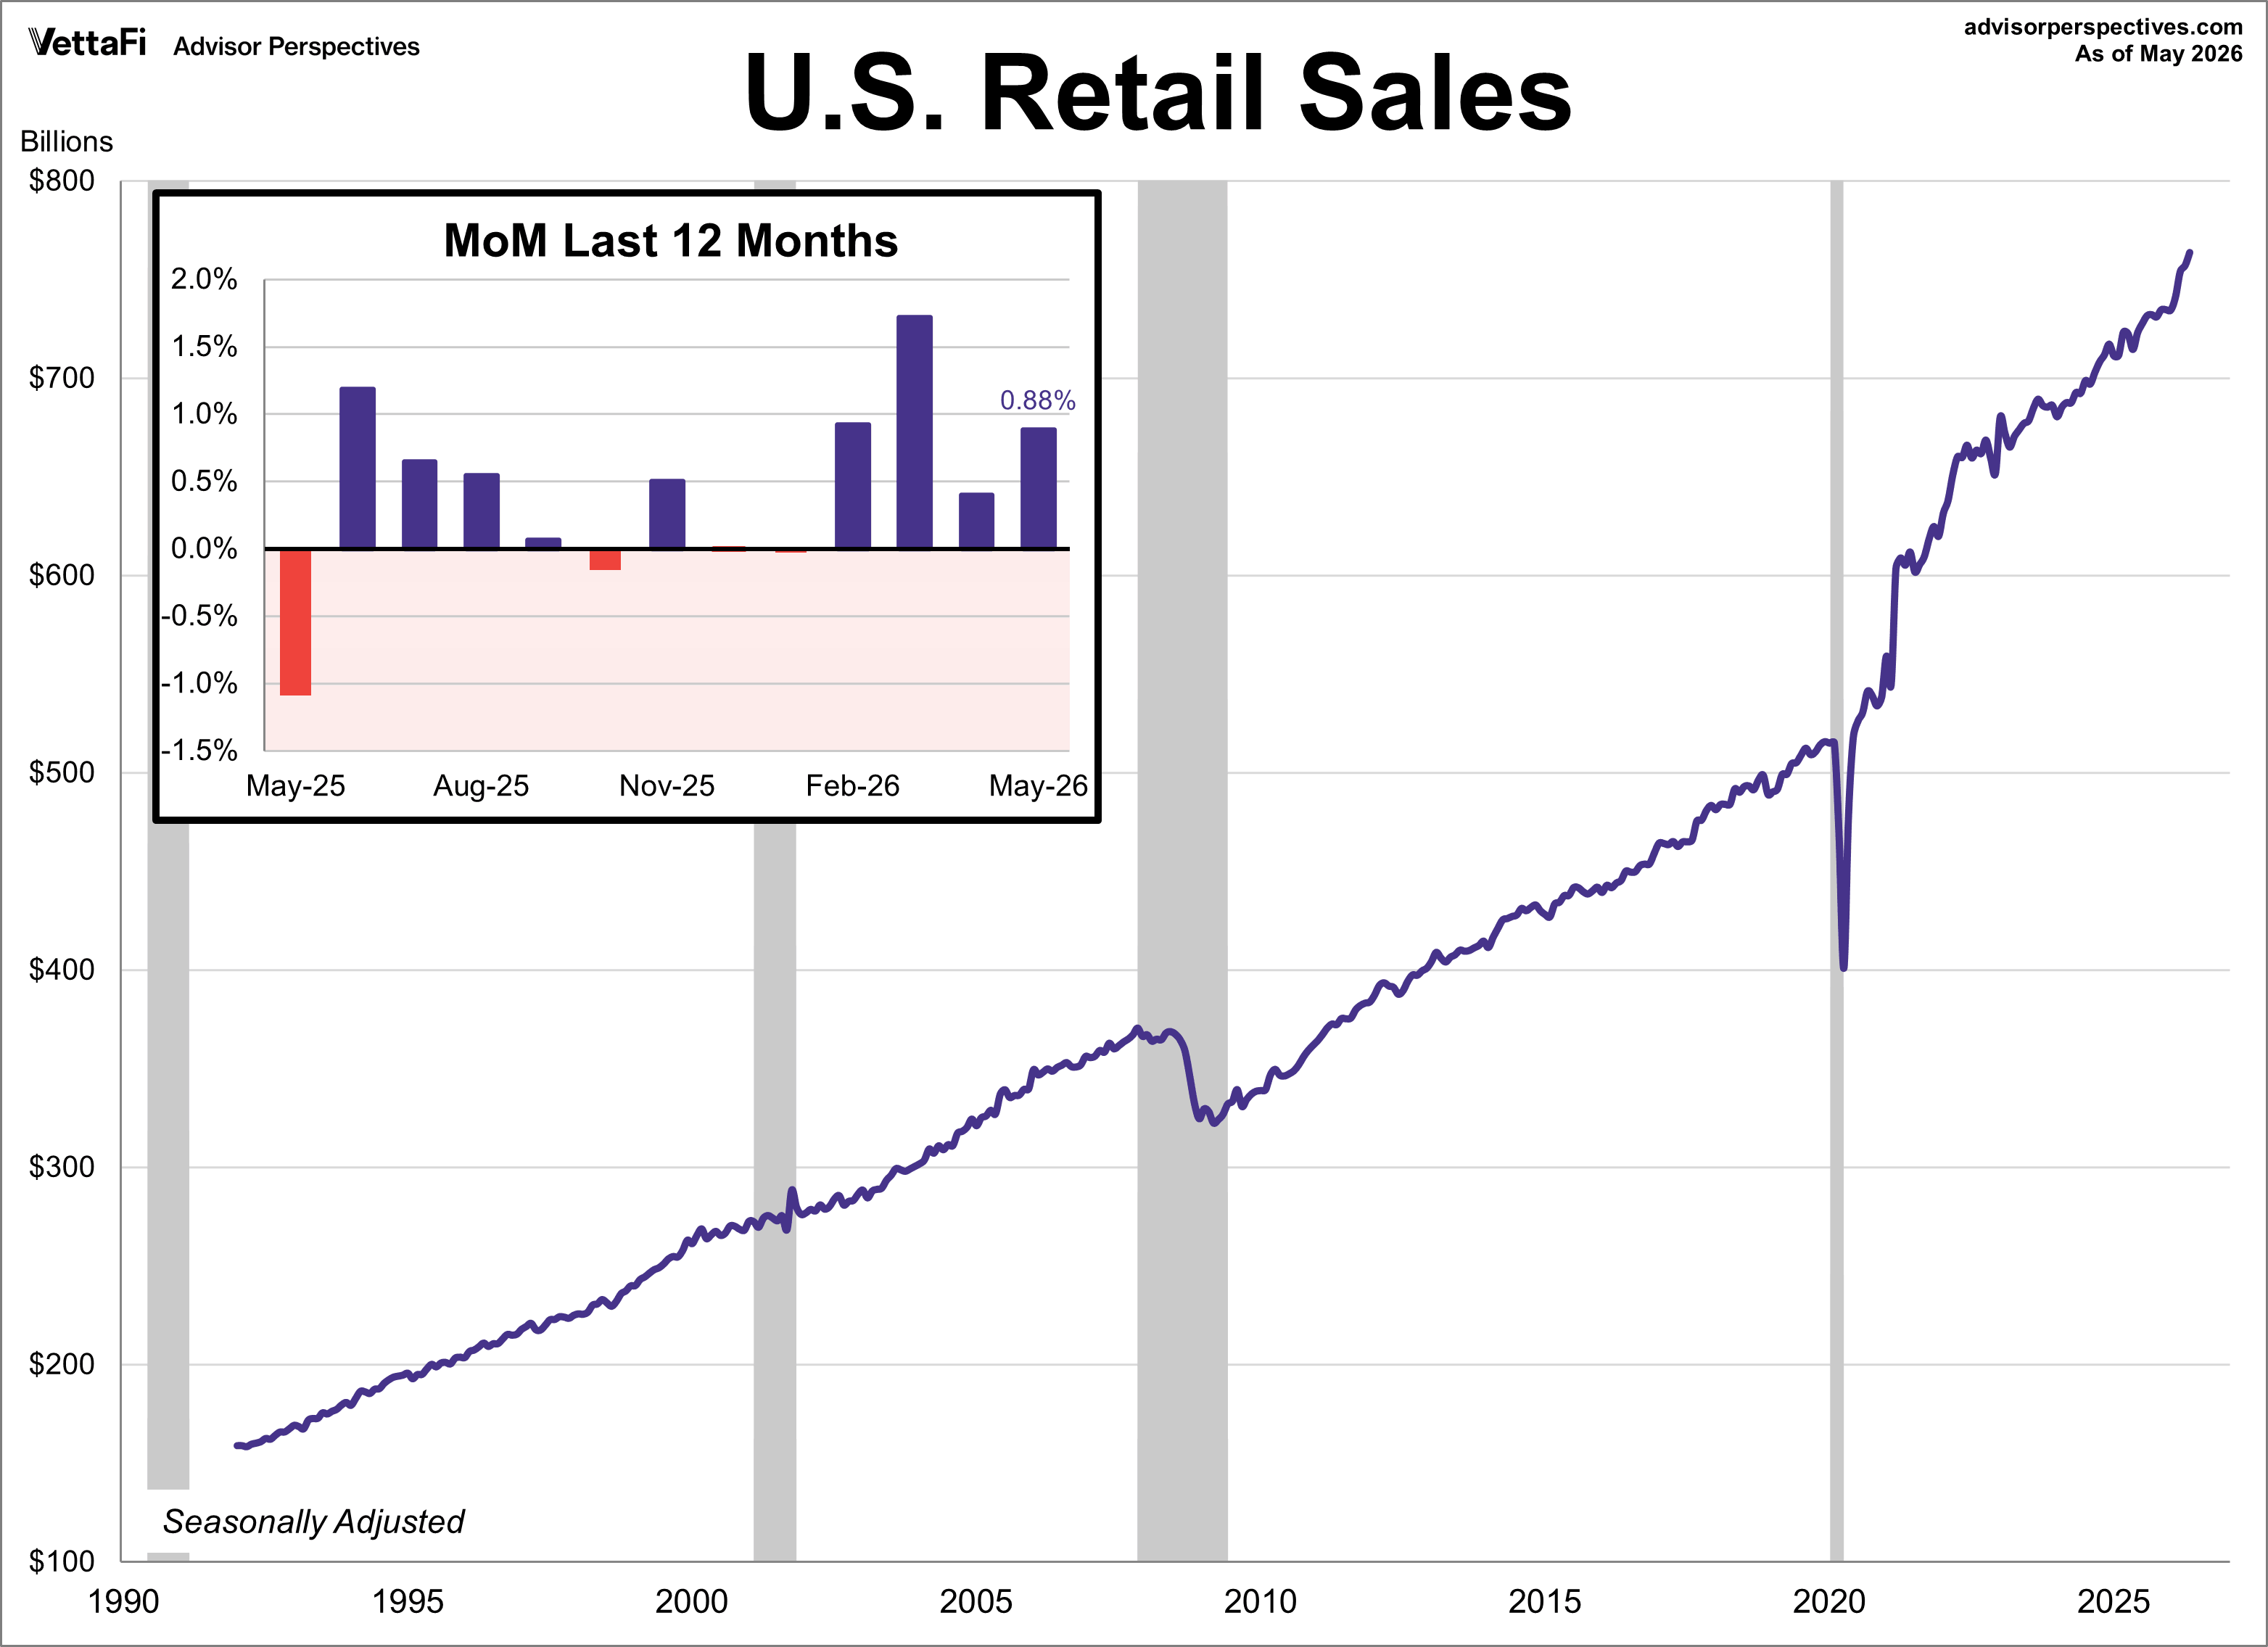
- May U.S. retail sales rose 0.9%, marking four straight months of growth and beating market expectations.
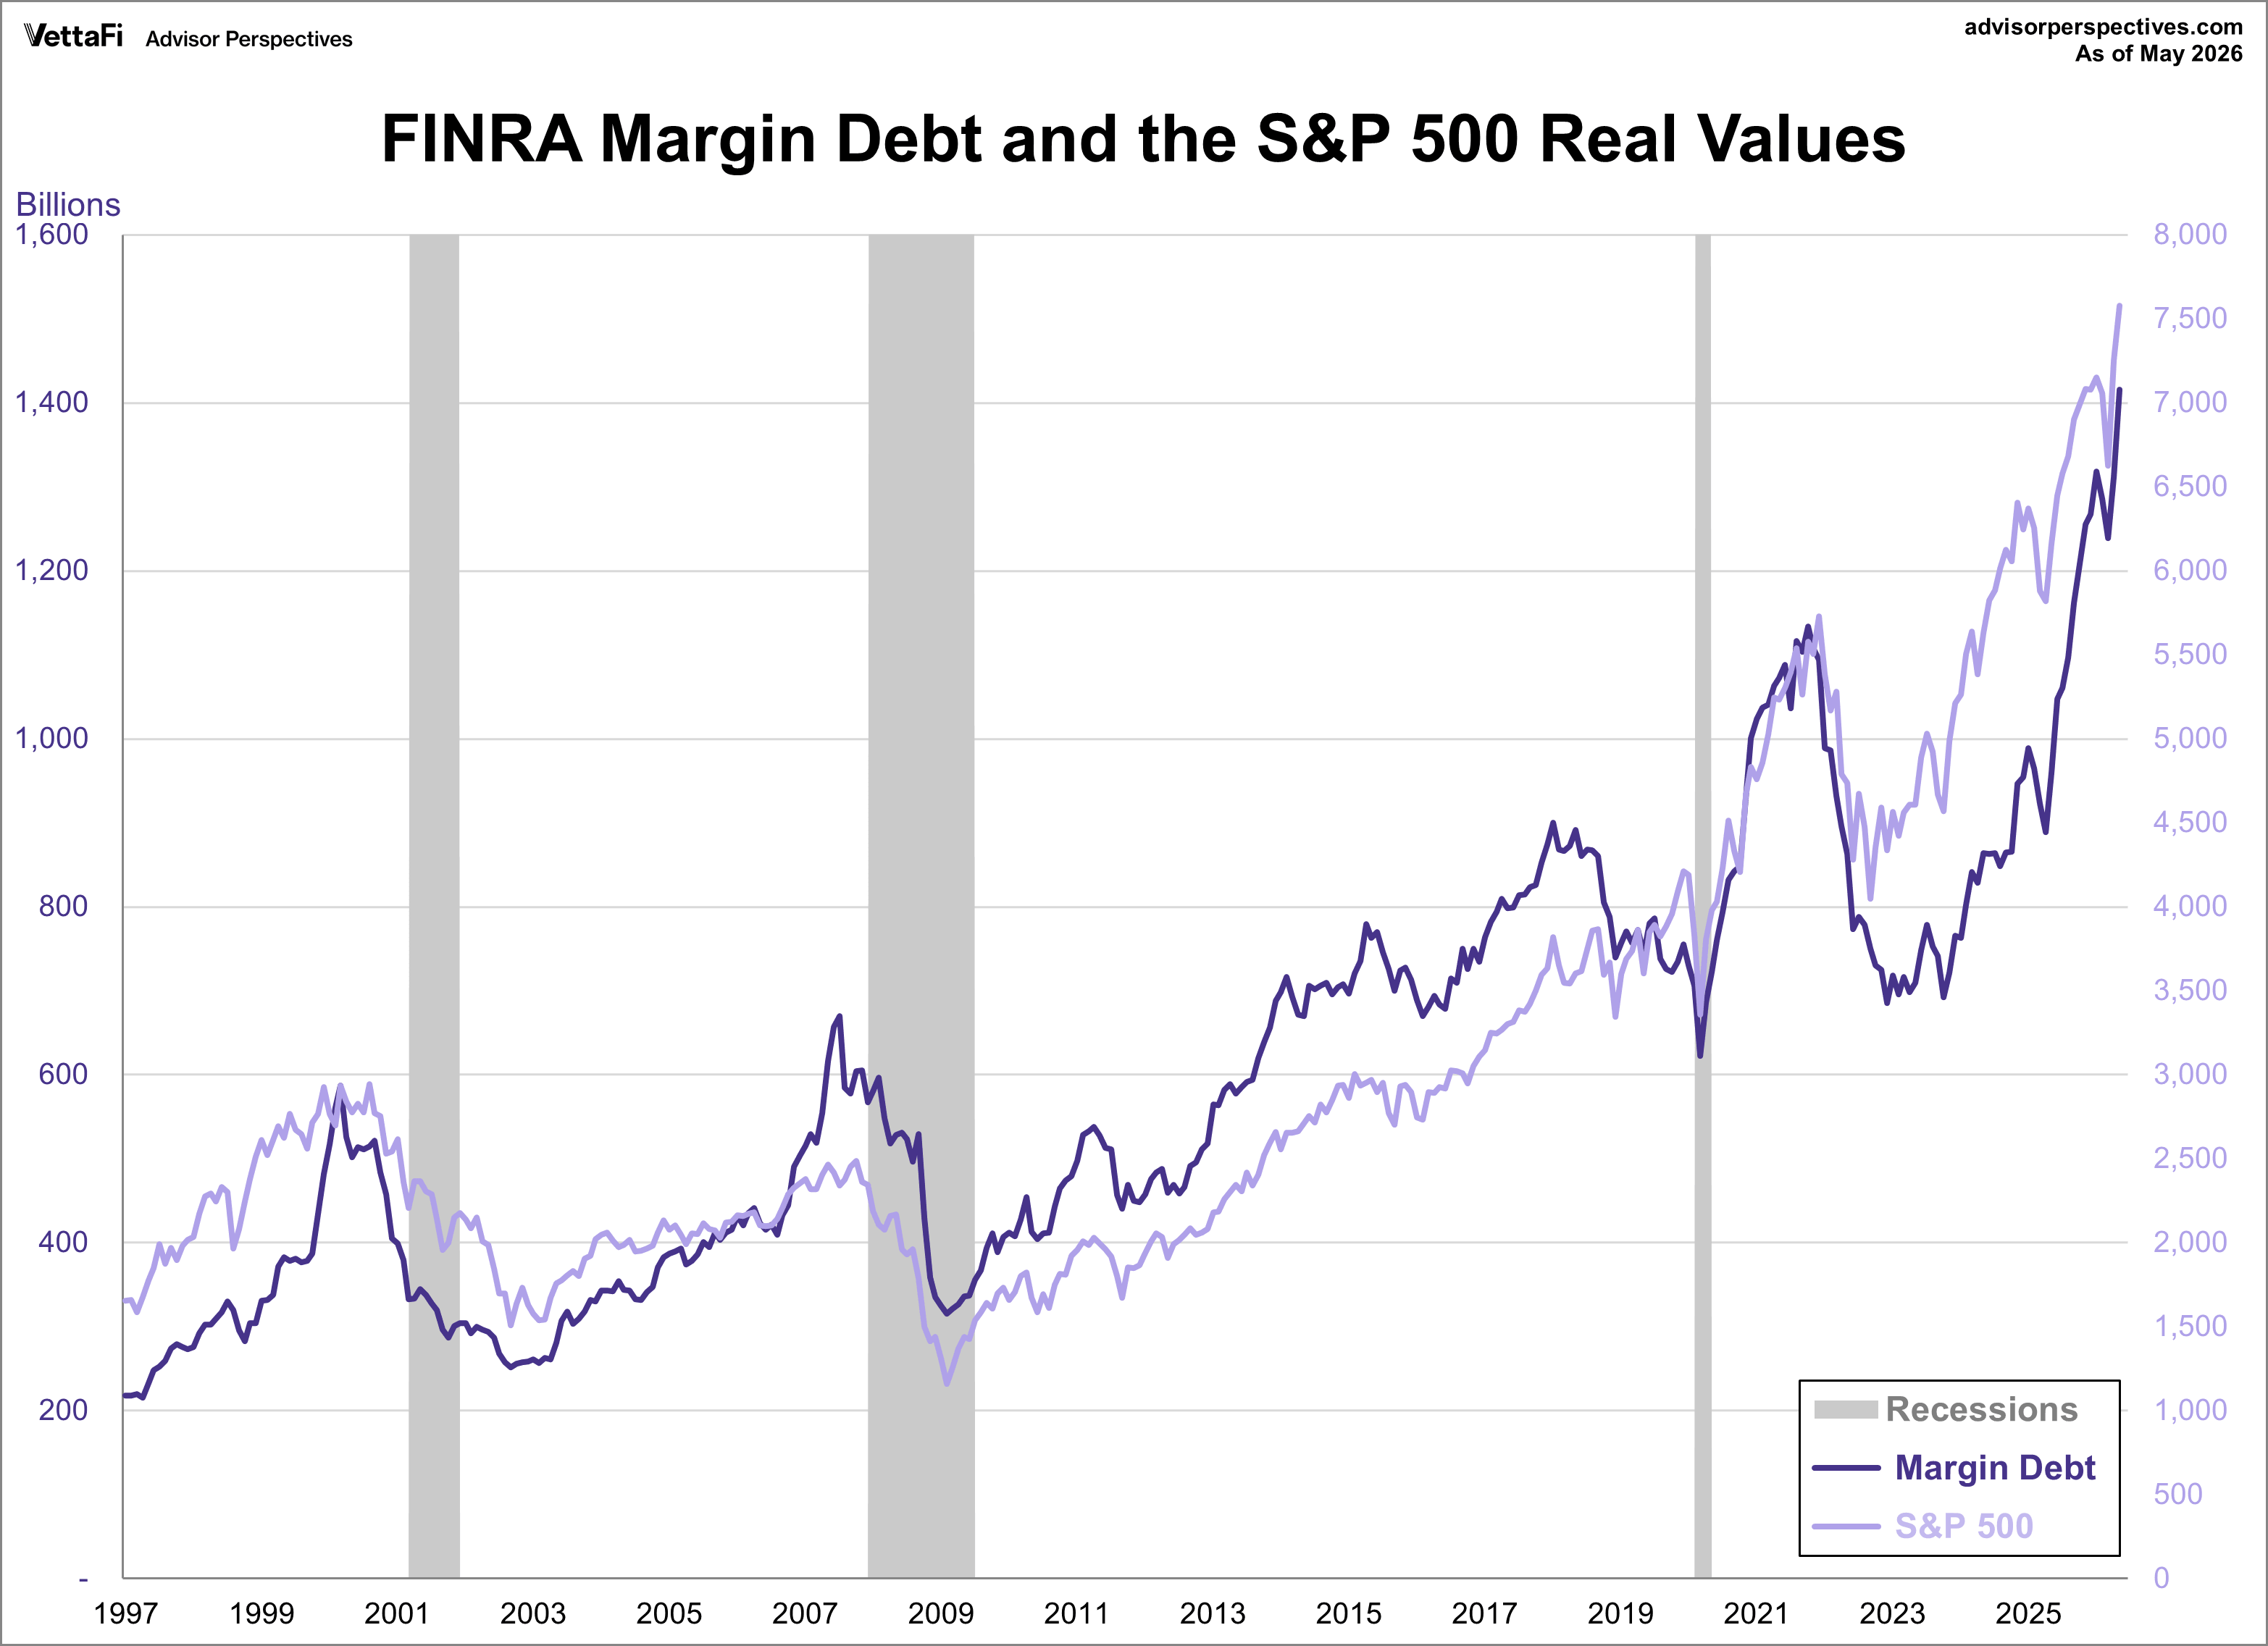
- Margin debt jumped 8.5% in May to a record $1.42 trillion, surging 54% over the past year.
Federal Reserve Meeting
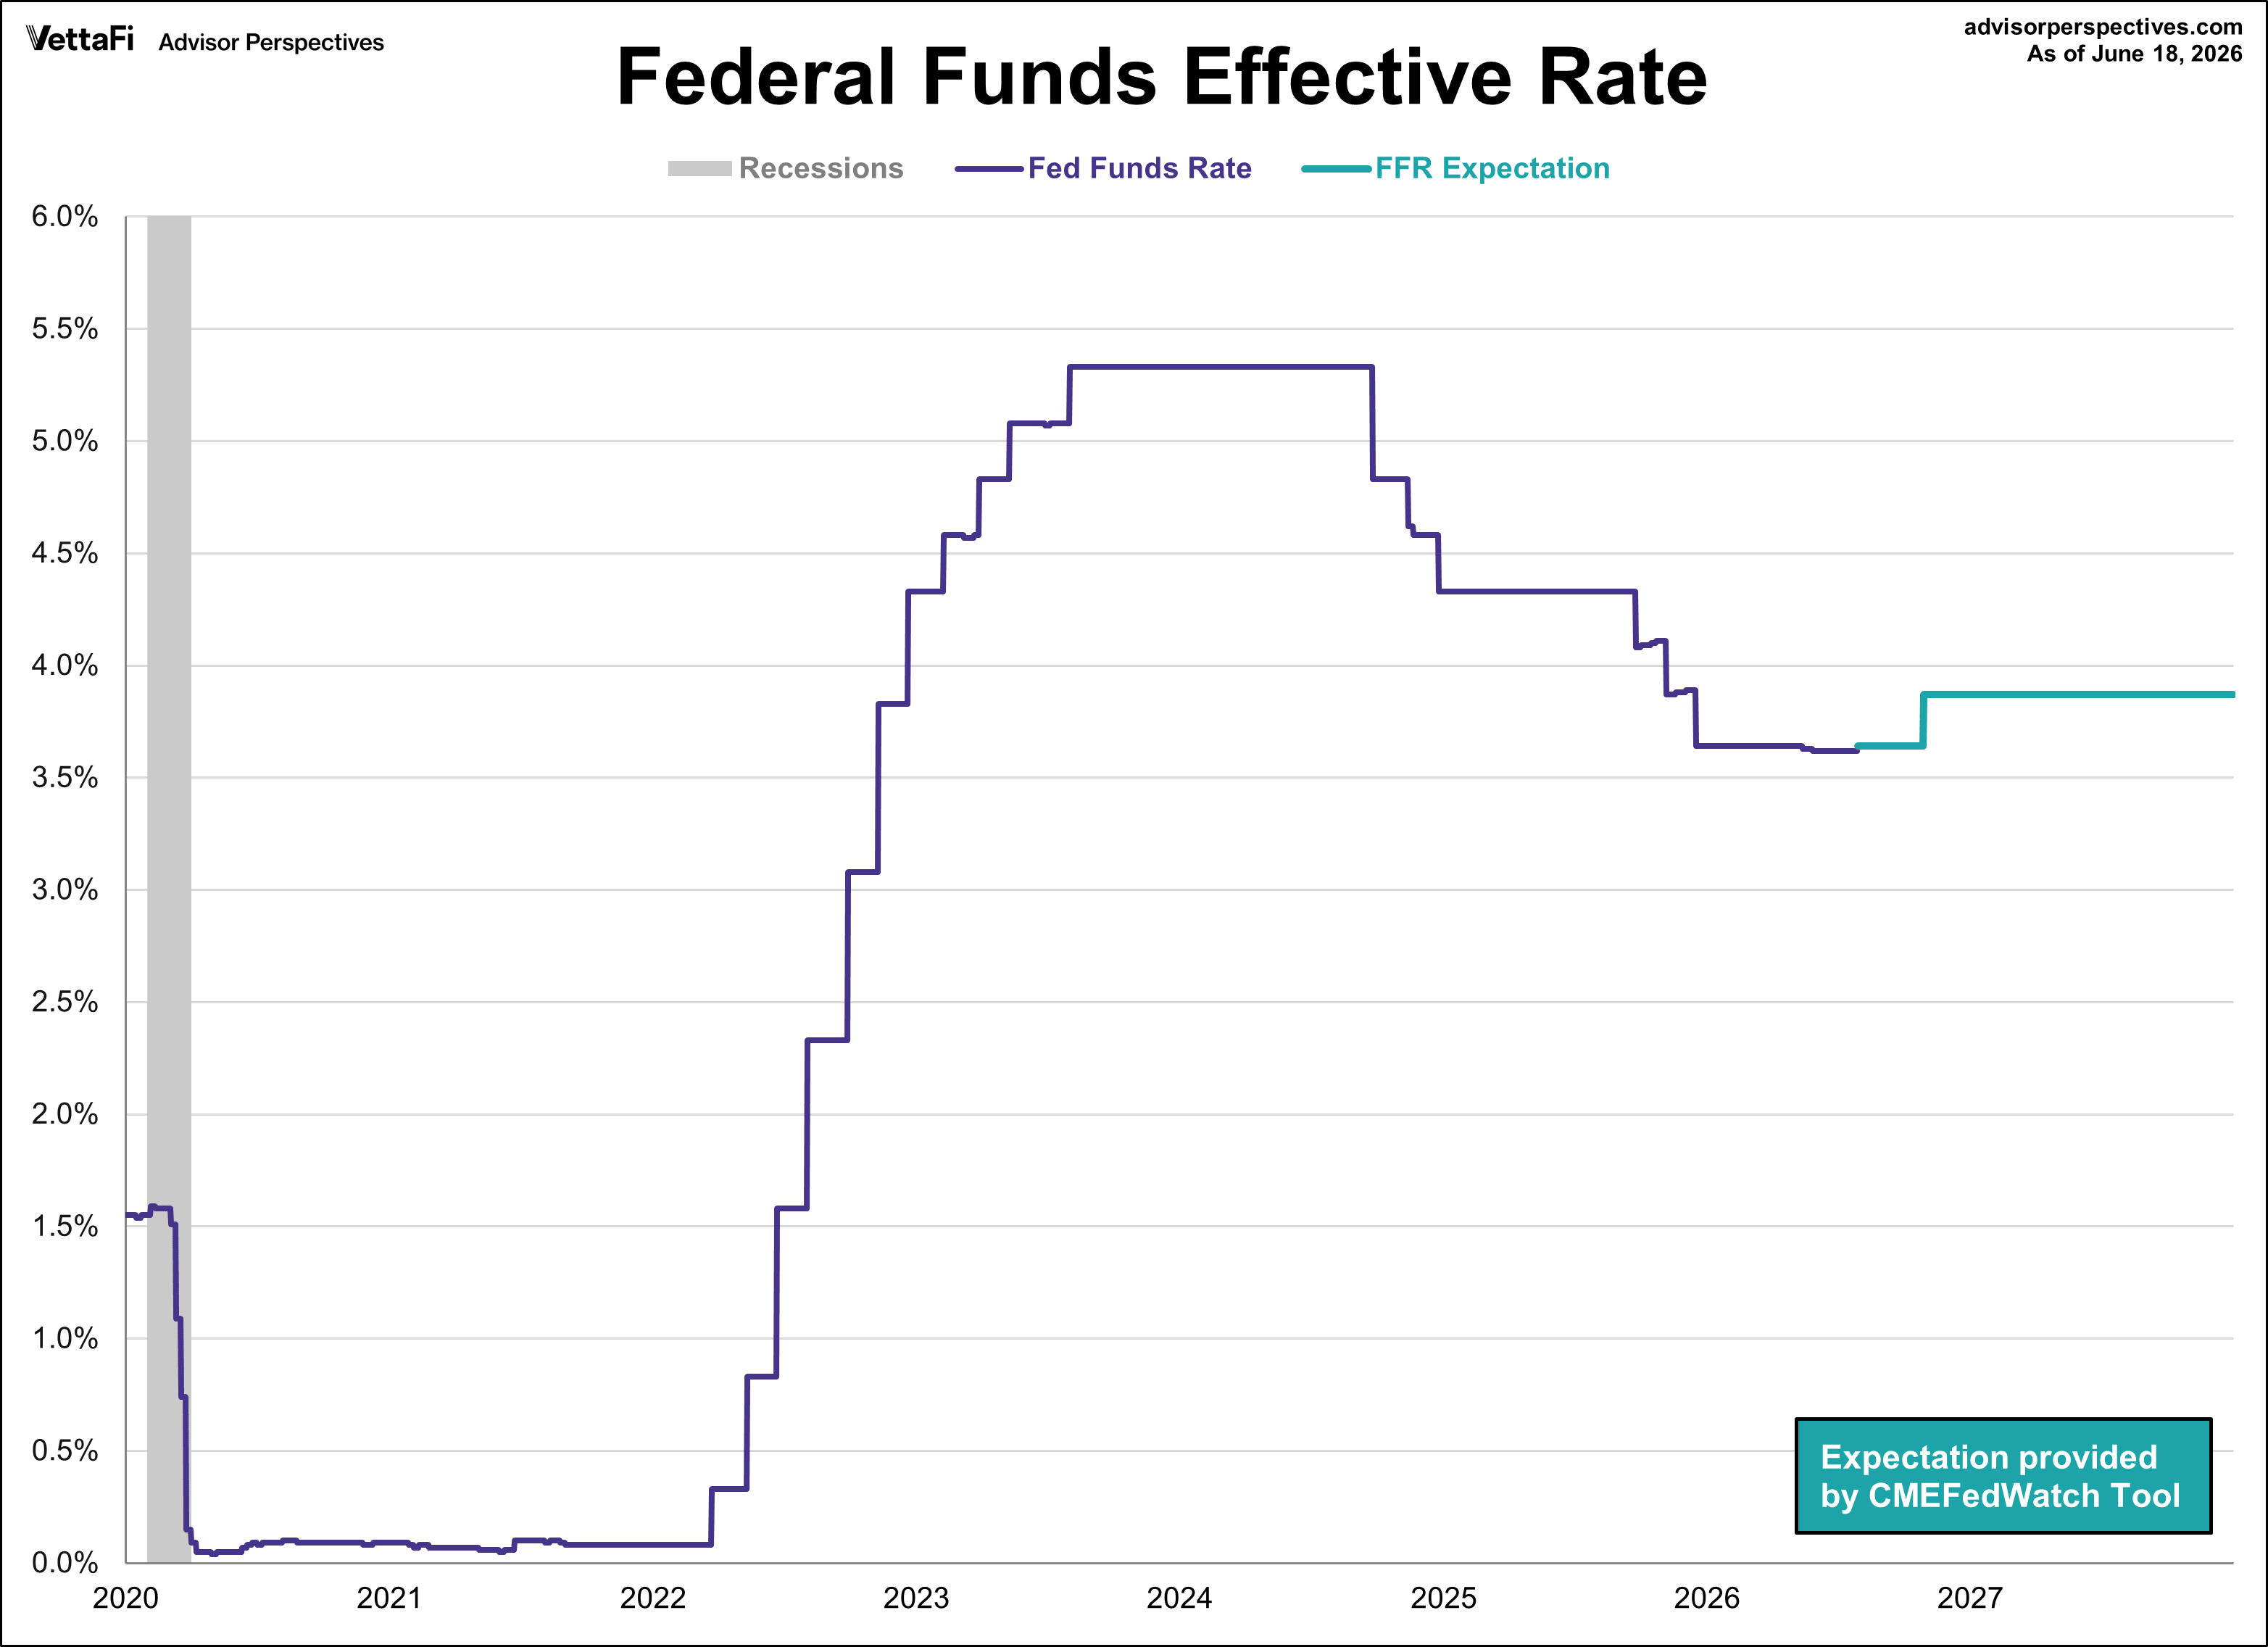
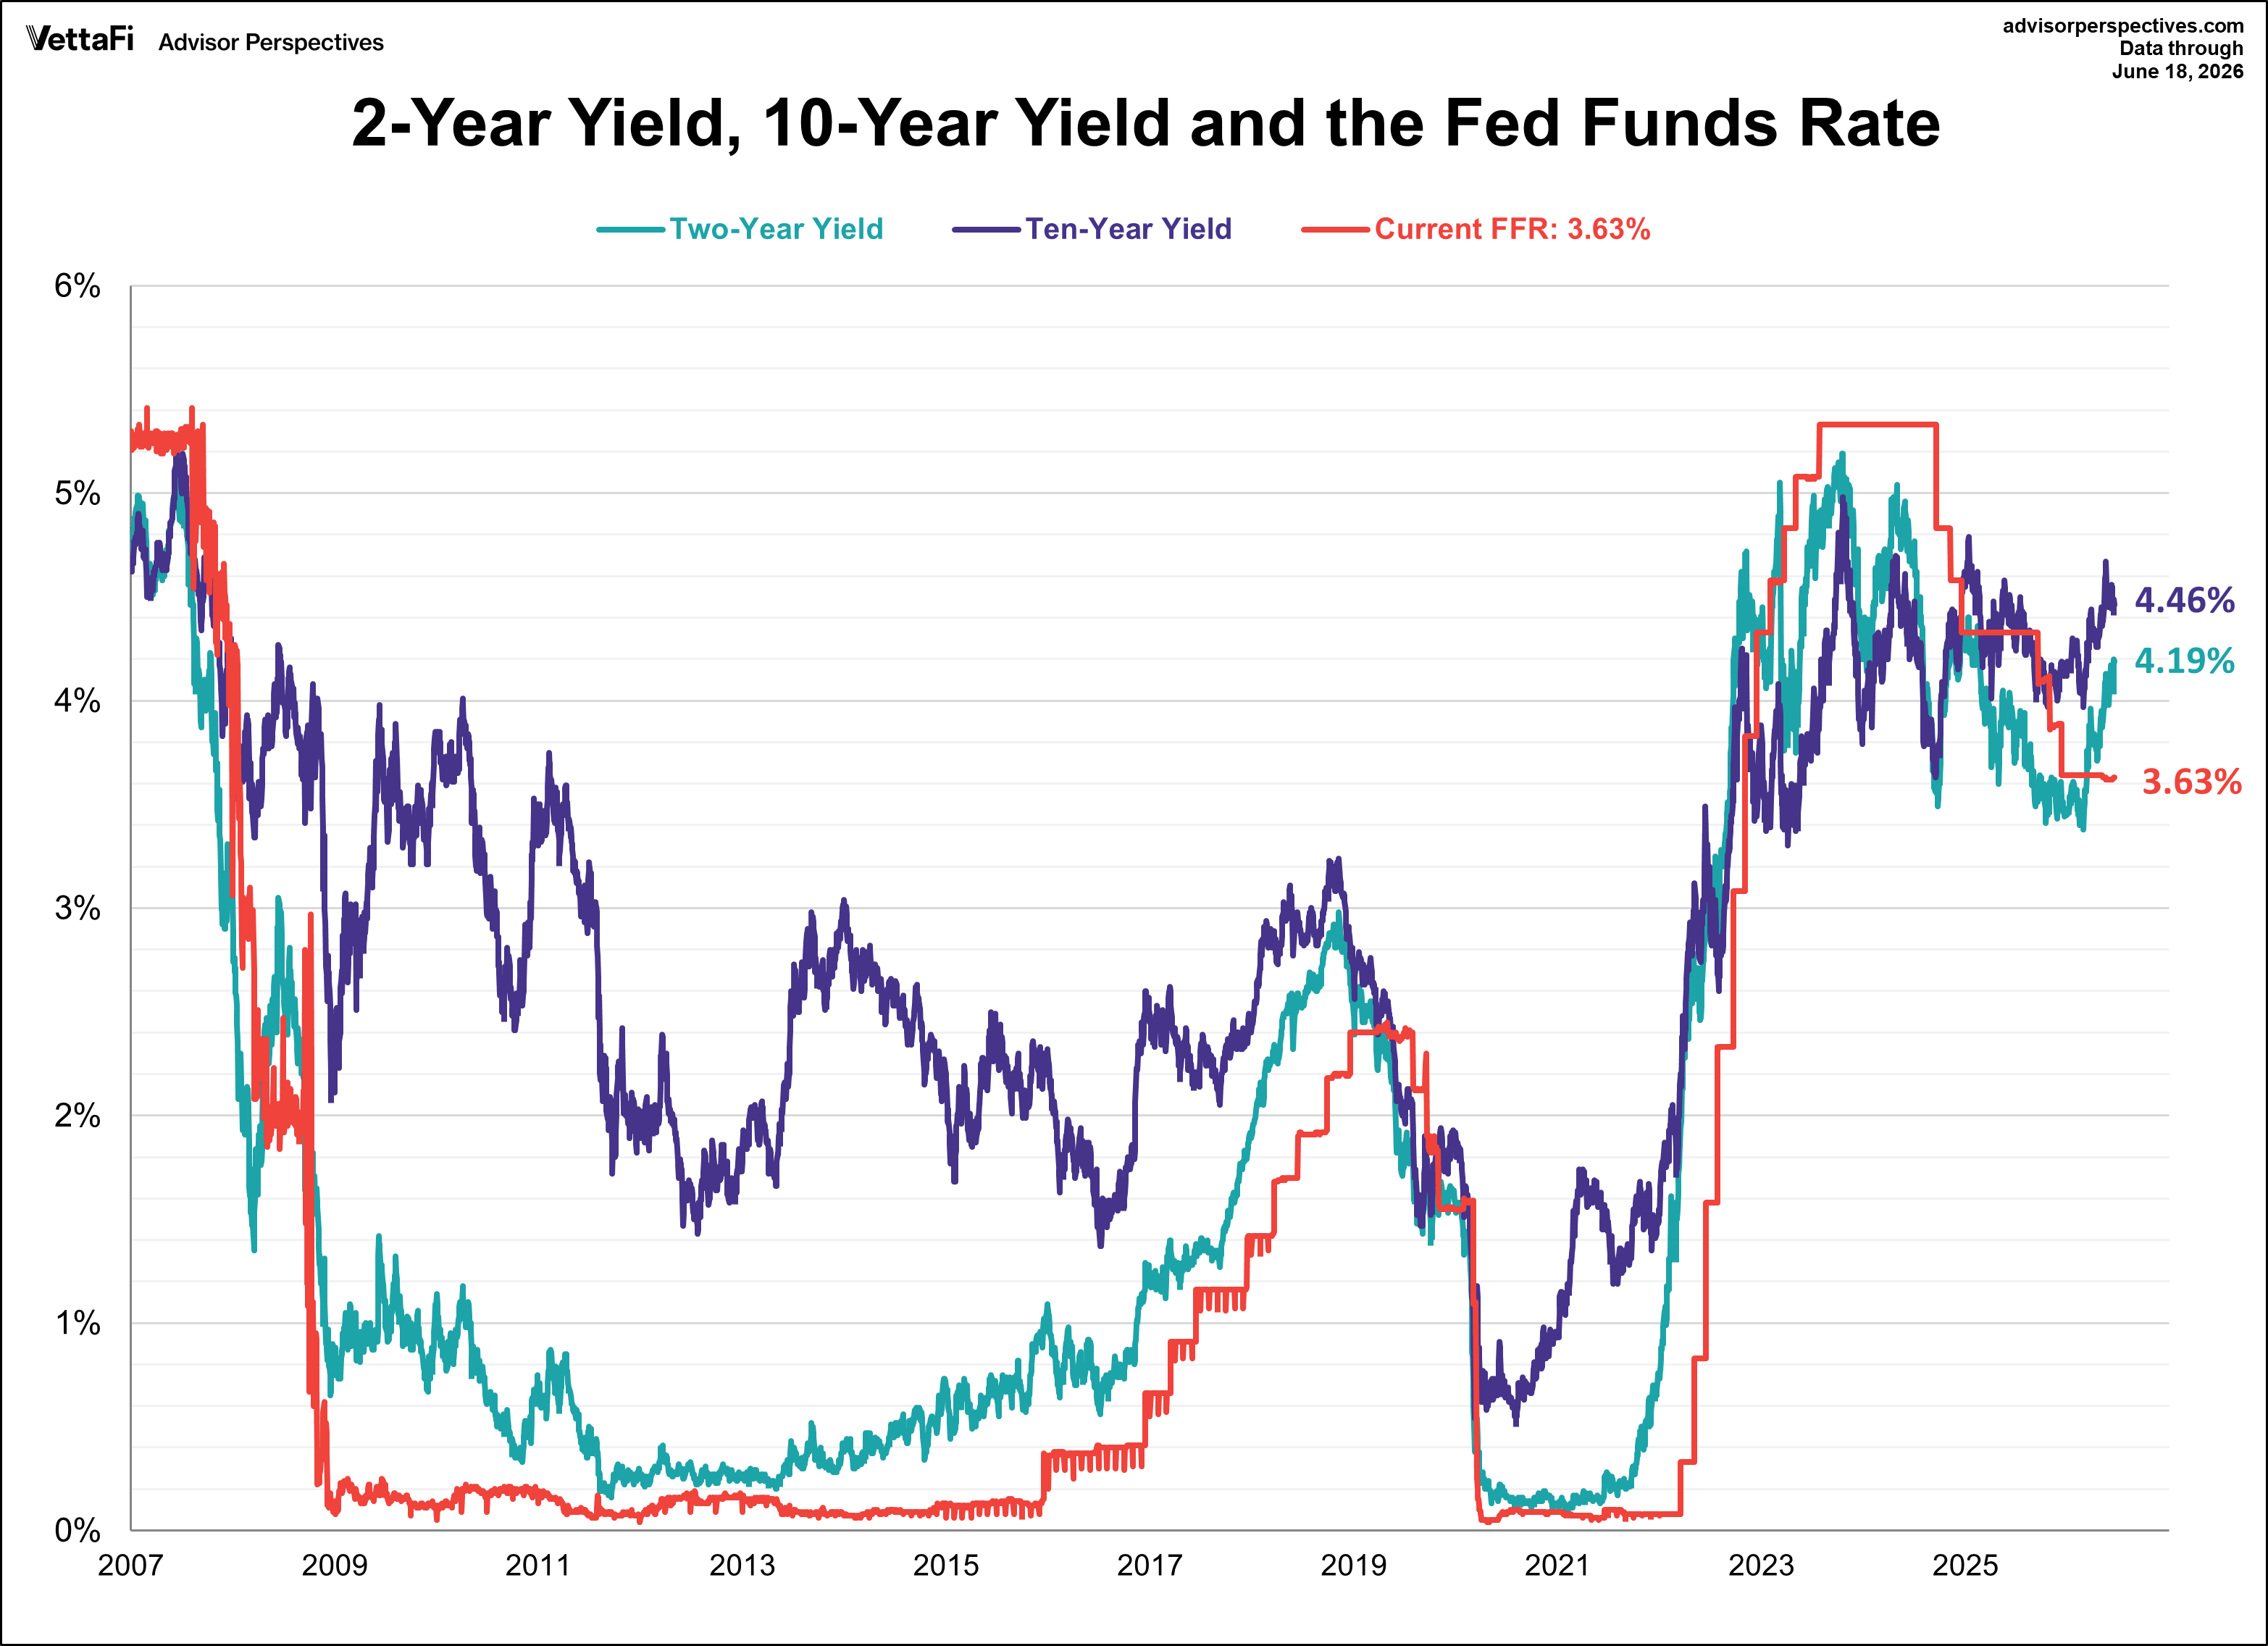
The Federal Reserve concluded its fourth meeting of the year by holding the federal funds rate in the range of 3.50%-3.75% via a unanimous 12-0 vote. The decision, which markets had fully priced in prior to the meeting, keeps the benchmark rate at its lowest level since November 2022 for the fourth meeting in a row.
The Federal Reserve's decision to hold interest rates steady was widely anticipated, but the real story was the debut of Kevin Warsh as the new Fed Chair. Under his leadership, the central bank delivered a drastically shortened official statement that completely stripped out any lingering bias toward a rate cut.
In assessing its dual mandate, the committee noted that the labor market remains resilient, characterized by steady job growth and low unemployment. However, officials made it clear that their primary battle is still with inflation, which remains stubbornly high due in part to supply shocks.
This meeting also featured the release of a new dot plot, though Warsh chose not to participate. The projections that were published outlined a clear "higher-for-longer" path forward. Most officials now expect the benchmark rate to finish the year between 3.6% and 4.1%, with interest rates drifting down much more slowly in 2027 and 2028 than previously anticipated.

Retail Sales
U.S. retail sales accelerated in May, climbing 0.9% to mark a fourth consecutive month of growth. The headline gain nearly doubled the 0.5% forecast and outpaced April’s 0.4% rise. While elevated gas prices at the pump drove the largest gains at gas stations, spending remained remarkably resilient elsewhere. Sales excluding automobiles climbed 0.8%, beating the 0.6% forecast, as a majority of retail categories logged increases.
Further signaling strong economic momentum, control group purchaseswhich strip out the volatility of gas stations, autos, and building materials to provide a more reliable economic reading, rose 0.7% in May. This marked the fifth straight monthly advance and was higher than the 0.4% forecast.
Retail sales could impact the SPDR S&P Retail ETF (XRT), VanEck Retail ETF (RTH), Amplify Online Retail ETF (IBUY), and ProShares Online Retail ETF (ONLN).
Margin Debt
Margin debt, a significant indicator of investor sentiment and risk appetite, jumped 8.5% in May to $1.42 trillion, its highest level in history. This marks the second consecutive increase and suggests an escalation in speculative borrowing that is moving in lockstep with the S&P 500’s 5.1% gain from last month. Margin debt has now grown nearly 54% over the past year, or 48% when adjusted for inflation, confirming that leverage has hit record peaks in both nominal and real terms.
Historically, margin debt and the stock market share a near-parallel relationship. High levels of debt often coincide with market peaks, such as those seen in 2000, 2007, and late 2021, while troughs tend to precede market bottoms. Although the current record high could reflect strong investor confidence, it also suggests aggressive risk-taking and increased market volatility.
Market Reactions and Fed Outlook
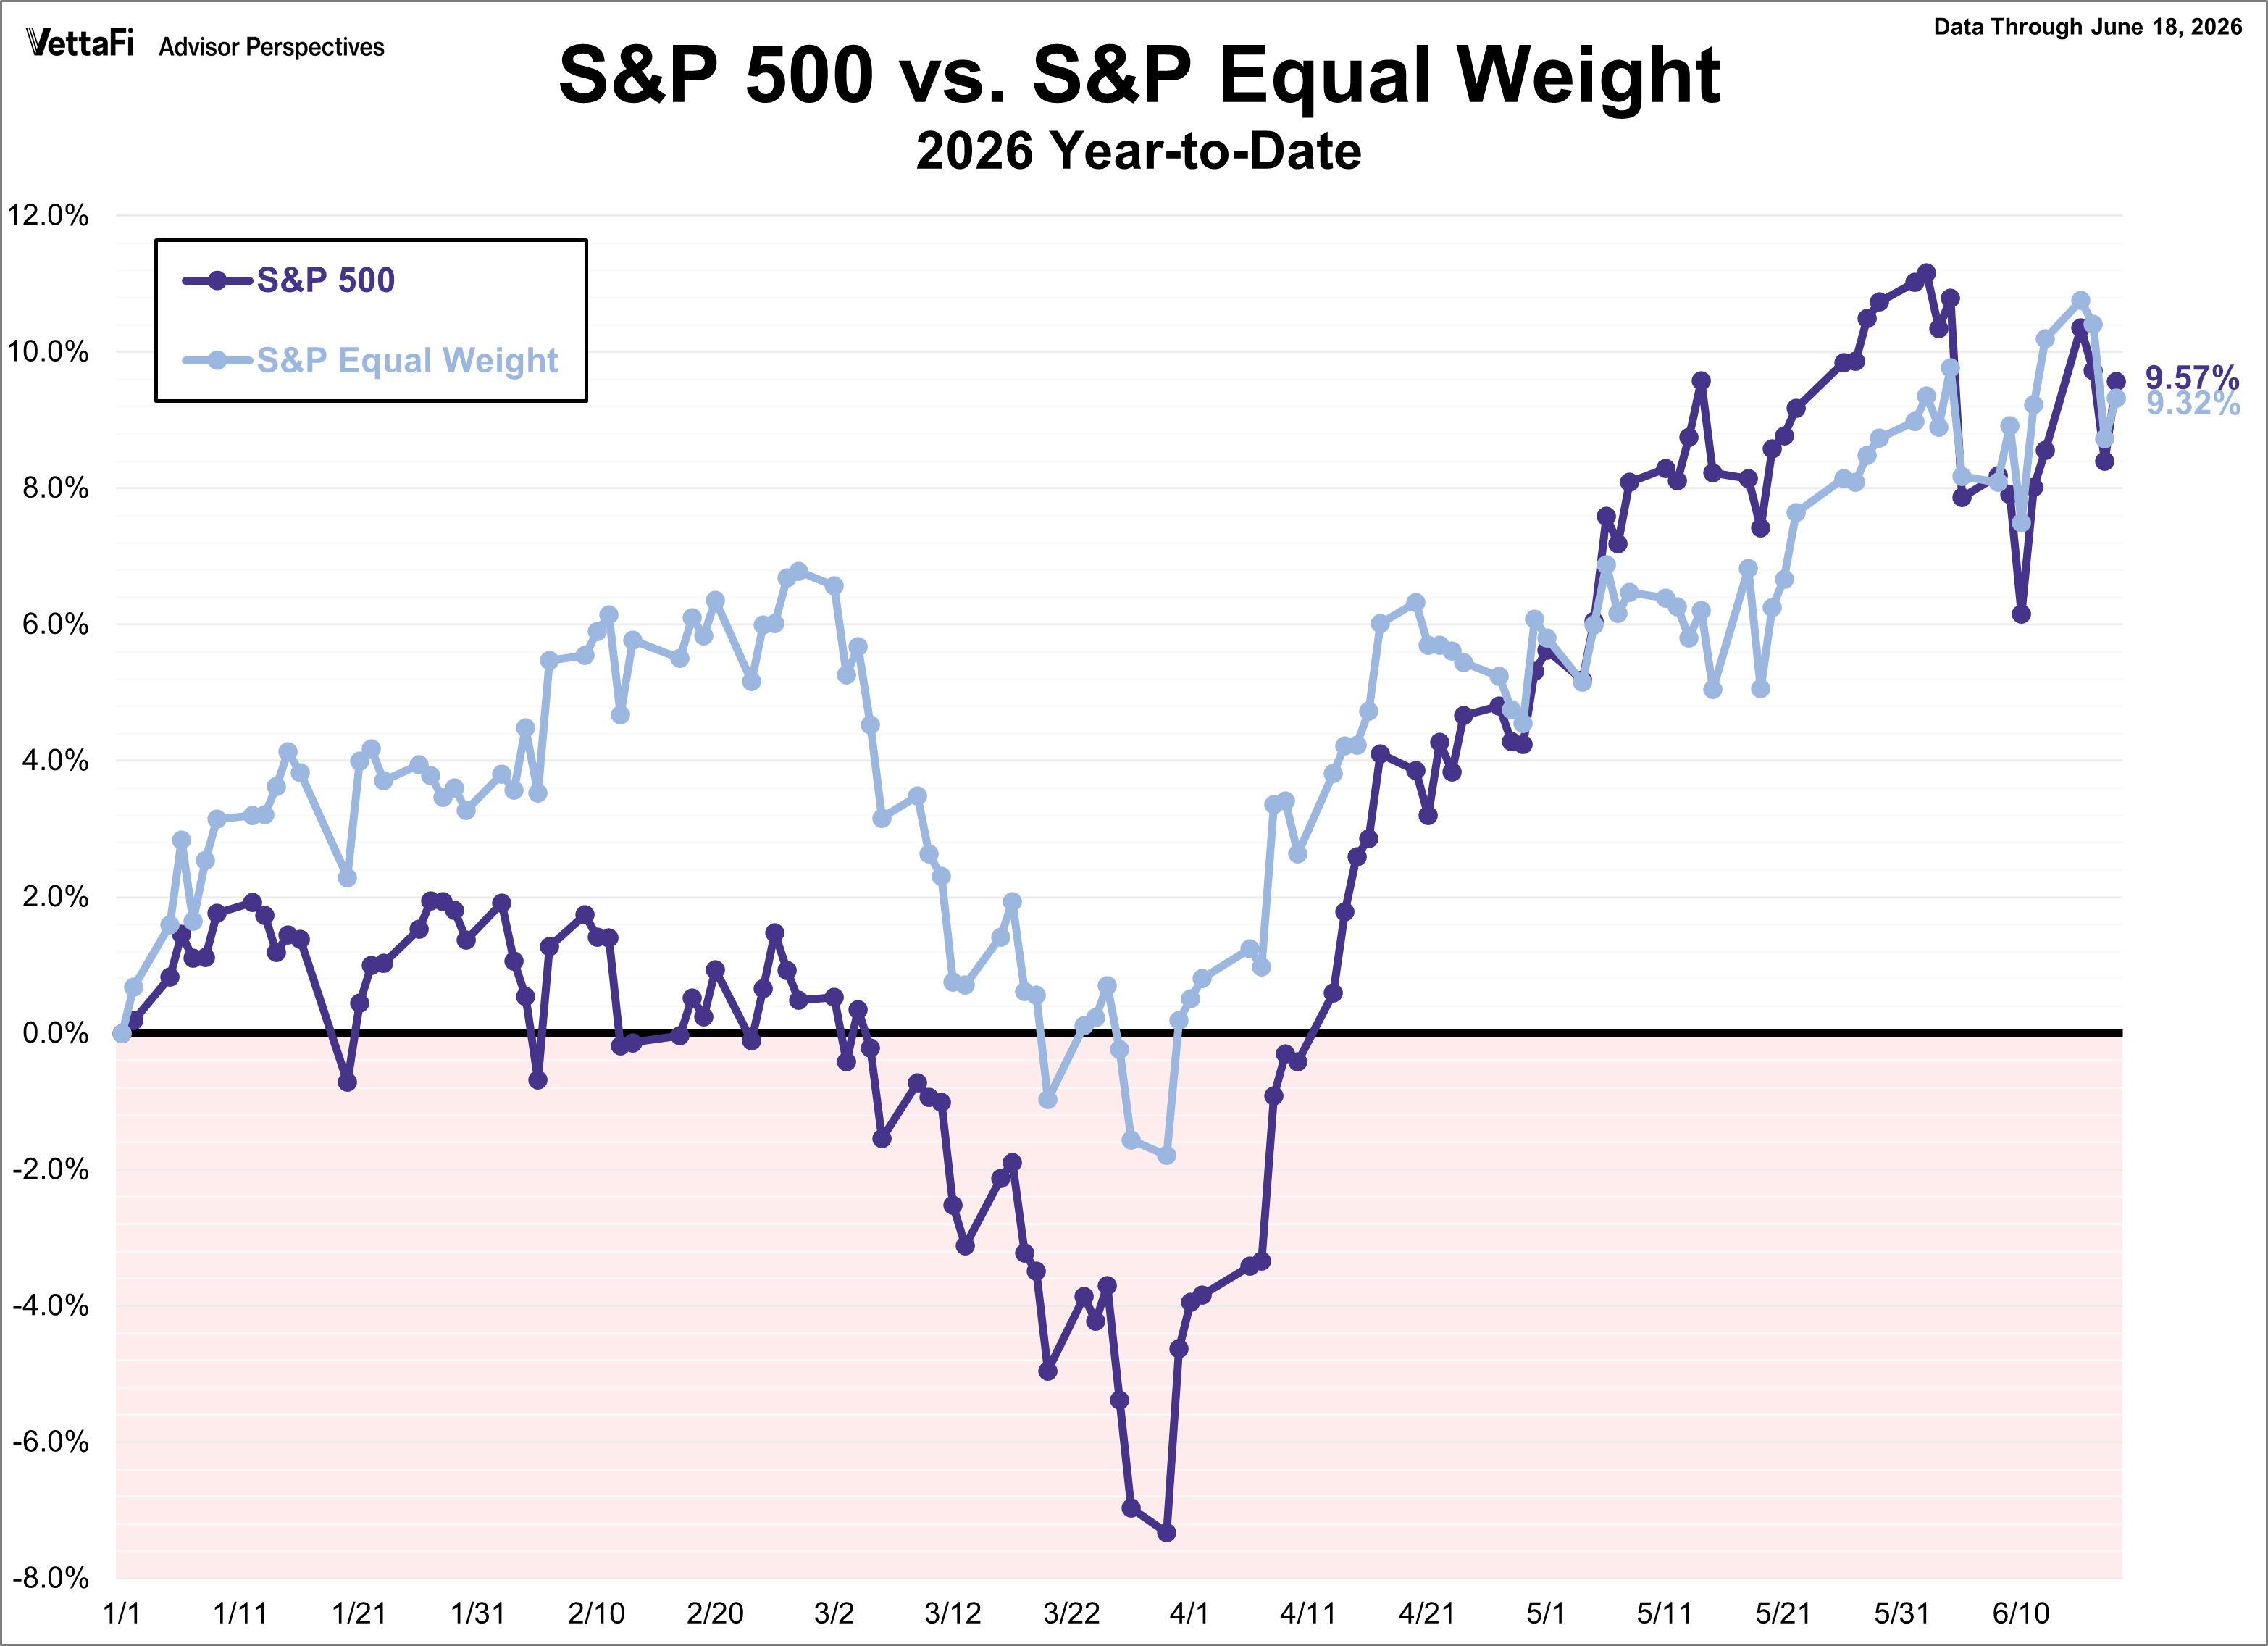
The S&P 500 secured a 0.9% weekly gain during a holiday-shortened trading week, marking its second straight advance and its 11th positive week in the past 12. The index kicked off the week on a high note, rallying on optimism surrounding a new Iran deal and SpaceX’s IPO, though it briefly surrendered those gains mid-week. This pullback came on the heels of the Fed meeting where officials signaled interest rates will stay higher for longer. However, the index surged right back on Thursday with a newly signed peace deal, ultimately locking in a winning week ahead of Friday's holiday closure. As a result, the SPDR S&P 500 ETF Trust (SPY) rose 0.7% last week. Meanwhile, the S&P Equal Weight Index was down 0.8% from the previous week and the Invesco S&P 500® Equal Weight ETF (RSP) fell 0.8%.
The 10-year Treasury yield finished the week at 4.46%, while the 2-year note finished at 4.19%.
The CME FedWatch Tool currently indicates a 62% likelihood that the Fed will hold rates steady at their next meeting at the end of July, compared to a 38% likelihood of a 25 basis point hike. Markets are pricing in a rate hike at the September meeting followed by another one at the start of 2027 though there is a strong chance that a second move could happen before the end of the year.
Looking Ahead: Economic Data for the Week of June 22, 2026
-
Monday: No notable data
-
Tuesday: Richmond Fed Manufacturing Index June)
-
Wednesday: New Home Sales (May)
-
Thursday: Weekly Jobless Claims, PCE Price Index (May), Gross Domestic Product (Q1), Durable Goods (May), Chicago Fed National Activity Index (May), Kansas City Fed Manufacturing Index (June), Personal Income (May)
-
Friday: University of Michigan Consumer Sentiment Index (June)