Tariff policies and tax and spending legislation provided plenty of fodder for markets to digest.
May was a pivotal month for markets, shaped by two forces: Tariff policy and tax and spending legislation.
On the trade front, investor uncertainty eased for a short time as President Donald Trump’s “Liberation Day” tariffs seemed to lose traction. Several key developments contributed, including a 90-day tariff pause with China, the signing of a US-UK trade agreement and progress on negotiations with other partners, including Europe. However, reminding us of the uncertainty surrounding trade policy, on May 30, Trump said that China had violated the temporary truce. Trump also announced that effective June 4, he was doubling the tariffs on steel and aluminum to 50%, raising the prospect of an escalating trade fight between the US and the European Union.
On the fiscal side, the narrow passage of the “One Big Beautiful Bill” in the House of Representatives increased the likelihood of the 2017 tax cuts being extended. It also opened the door to potential additional tax relief measures such as adjustments to state and local tax deductions and no tax on tips or Social Security, and introduced incentives for business investment, all of which helped lift market sentiment.
However, Raymond James Chief Investment Officer Larry Adam cautioned that the biggest risk tied to this momentum is the potential for larger budget deficits. These could lead to a temporary spike in interest rates, which would create a headwind for equities, fixed income and the broader economy.
Adding to the month’s momentum was a strong earnings season, with corporate profits clocking in at 14% – double the expected 7% – with mega-cap tech stocks once again leading the way. The picture in the bond market was less rosy as US Treasuries snapped a four-month winning streak and the Bloomberg Treasury Index turned negative for the first time this year.
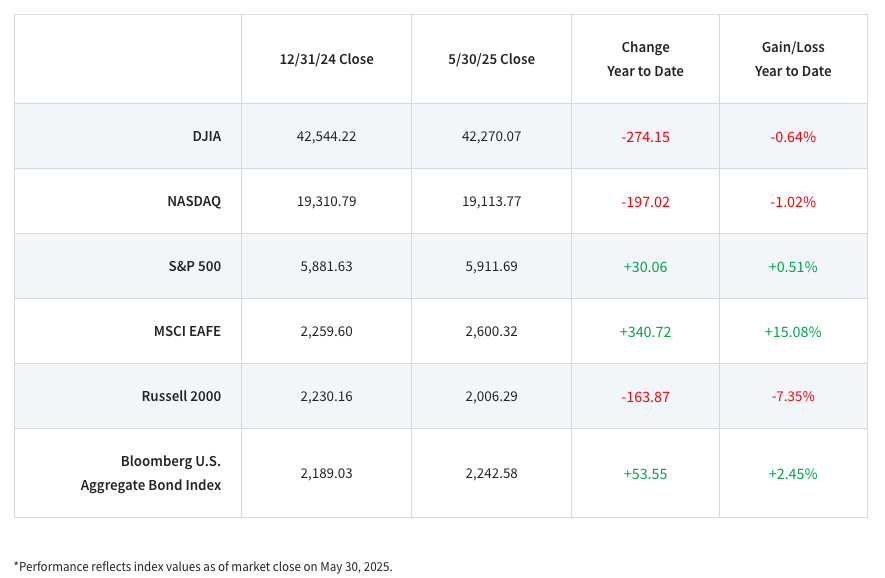
We’ll dive into the details below, but first, a look at the numbers year-to-date:

Trade disputes, fiscal negotiations in Washington
In the final days of May, a federal appeals court issued a temporary stay in President Trump’s tariffs allowing them to stay in effect on an interim basis. This move reversed a lower court’s decision from the previous day, when the US Court of International Trade had ruled that Trump’s use of emergency powers (IEEPA) to impose global tariffs was unlawful and would have forced a 10-day unwind of global reciprocal tariffs. The appeals court’s action keeps the tariffs in place temporarily and sets the stage for the Supreme Court to ultimately weigh in. Despite the legal back-and-forth, the administration is exploring alternative measures to reinstate tariffs.
The “One Big, Beautiful Bill” passed the House but will face Senate scrutiny, where components of the bill may see revisions. The bill’s estimated $3 trillion deficit impact over a decade also was a contributor to Moody’s downgrade of the US credit rating to Aa1, citing widening federal fiscal deficits and rising debt burdens.
US economy expanding, but uncertainty lies ahead
The Consumer Price Index (CPI) for April was lower than expected last month, bringing the year-over-year rate to 2.3%, the lowest reading since February 2021. While the report delivered a positive surprise, many retailers are signaling that price increases remain on the horizon.
Although tariff-related uncertainty remains a hot topic, the US service industry improved last month, with growth in 11 of 17 industries. Manufacturing was slightly weaker than expected and remained in contraction territory, but data suggests the overall economy is expanding. Retail and food services sales were also softer than expected – an indication that consumers are choosing where to spend carefully.
April’s employment numbers were stronger than expected, showing no measurable impact from the tariffs so far.
S&P 500 reclaims lost ground
After a whirlwind couple of months, the S&P 500 ended May with 80% of constituent stocks sitting above their 50-day moving average – the best reading since the fall of 2024. For the total domestic market, 62% of 2025 losses have been recovered with 58% of large-cap stocks hitting four-week highs last month and industrials touching all-time highs. Progress on trade talks and the tax bill indicate a more constructive economic outlook, but the situation remains fluid.
Treasuries react to tariffs
The market’s immediate reaction to Moody’s downgrading of US Treasuries from Aaa to Aa1 was minimal, reflecting bond buyers’ steady faith in US creditworthiness. But as with equities, fixed income appears to be sensitive to tariff headlines, and yields rose across most of the Treasury curve by about 25 to 30 basis points in May.
Nominal and real fixed income yields remain elevated as they have for roughly 1.7 years relative to where they were the previous 15-plus years, providing income opportunities for investors.
Inflation data came in flat or below expectations, but consumer sentiment is declining, with general housing data, retail sales and home sales all weaker for the month. For now, the Federal Reserve is holding baseline interest rates steady.
Summertime gasoline prices hit four-year low
The national average for gasoline is currently just over $3 per gallon, thanks to a combination of weaker global demand and a near-record increase in global supply, acting as a stimulus for the US economy. Energy accounts for 7% of US consumer spending, and the disinflationary effect is helpful as an offset to higher costs from tariffs. While this isn’t great news for oil company earnings, it is beneficial for other sectors, such as Industrials, which relies heavily on diesel.
European outlook improves
European financial markets – and the euro – have had a strong start to 2025, with the MSCI Europe Index among the top-performing global indices, driven largely by Germany’s historic fiscal loosening. Investor optimism has been fueled by improving corporate profitability and rising valuations, particularly in the Industrial and Financial sectors. European bond markets have also shown resilience, with long-term yields remaining stable, especially in Germany and the region’s peripheral markets. However, risks remain. Political uncertainty and debt dynamics in countries like France and Italy could still trigger volatility – as could escalating trade tensions with the US, with President Trump at one point threatening a 50% tariff on EU goods.
The bottom line
Markets often sway with the headlines, especially when political noise dominates the news cycle, however, Adam notes that history generally rewards patience more than trying to predict and time short-term market movements.
Investing involves risk, and investors may incur a profit or a loss. All expressions of opinion reflect the judgment of the Raymond James Chief Investment Officer and are subject to change. There is no assurance the trends mentioned will continue or that the forecasts discussed will be realized. Past performance may not be indicative of future results. Economic and market conditions are subject to change. Diversification does not guarantee a profit nor protect against loss. The Dow Jones Industrial Average is an unmanaged index of 30 widely held stocks. The NASDAQ Composite Index is an unmanaged index of all common stocks listed on the NASDAQ National Stock Market. The S&P 500 is an unmanaged index of 500 widely held stocks. The MSCI EAFE (Europe, Australasia and Far East) index is an unmanaged index that is generally considered representative of the international stock market. The Russell 2000 is an unmanaged index of small-cap securities. The Bloomberg Barclays US Aggregate Bond Index is a broad-based flagship benchmark that measures the investment grade, U.S. dollar-denominated, fixed-rate taxable bond market. An investment cannot be made in these indexes. The performance mentioned does not include fees and charges, which would reduce an investor’s returns. Companies engaged in business related to a specific sector are subject to fierce competition and their products and services may be subject to rapid obsolescence. There are additional risks associated with investing in an individual sector, including limited diversification. A credit rating of a security is not a recommendation to buy, sell or hold the security and may be subject to review, revision, suspension, reduction or withdrawal at any time by the assigning Rating Agency. Bond prices and yields are subject to change based upon market conditions and availability. If bonds are sold prior to maturity, you may receive more or less than your initial investment. Income from municipal bonds is not subject to federal income taxation; however, it may be subject to state and local taxes and, for certain investors, to the alternative minimum tax. Income from taxable municipal bonds is subject to federal income taxation, and it may be subject to state and local taxes. Investing in commodities is generally considered speculative because of the significant potential for investment loss. Their markets are likely to be volatile and there may be sharp price fluctuations even during periods when prices overall are rising. International investing involves special risks, including currency fluctuations, differing financial accounting standards, and possible political and economic volatility. Investing in small-cap stocks generally involves greater risks, and therefore, may not be appropriate for every investor. The prices of small company stocks may be subject to more volatility than those of large company stocks.
Material created by Raymond James for use by its advisors.
A message from Advisor Perspectives and VettaFi: To learn more about this and other topics, check out some of our webcasts.
© Raymond James
Read more commentaries by Raymond James