Key takeaways
- Uncertainty around U.S. government policy – particularly tariffs – is resulting in elevated levels of market volatility, with some names down as much as -50%.
- Couple this volatility with a change in momentum and many crowded names, particularly within tech and AI, have seen a dramatic shift in fortune as last year’s momentum trade unwinds.
At a high level, it did not seem that bad. As of the second week of March, global equities were down roughly 6%, on par with the sell-off in late December and early January. That said, many of the trades that drove the market higher in 2023 and 2024 are now compromised.
Since the February peak, equity markets experienced a savage reversal in leadership, momentum and investor confidence. Last year’s favorites gave up months, and in some cases years, worth of gains in a matter of a few weeks.
The carnage started with last year’s big winners: tech and AI-related names. Both the ‘Mag 7’ and semiconductor stocks quickly shed -20%, with some of last year’s big winners down as much as -50%. From there, selling spread to other momentum trades, notably consumer discretionary and financials. What happened to abruptly change the investment environment and how should investors navigate this very different environment?
Some uncertainty and a lot of crowding
Apart from the magnitude of the losses, what distinguishes this selloff is the lack of a significant catalyst. To be sure, recent data releases, notably retail sales and the ISM manufacturing survey, have been soft. While by no means terrible, the data has cast some doubt on the economy’s resiliency. Beyond economic data, an unusual degree of uncertainty around U.S. government policy, particularly tariffs, has quickly undercut a narrative of stability and economic growth.
That said, what truly accounts for the magnitude of the sell-off is the extent to which investors were crowded into a few themes, notably AI infrastructure and a bulletproof U.S. consumer. Rather than a dramatic shift in fundamentals, stocks suffering the biggest losses have been caught up in an historic unwind of last year’s momentum trade. Momentum, which generally involves buying stocks with the best 12-month price appreciation, was the top performing strategy in 2024; it has quickly become the worst.
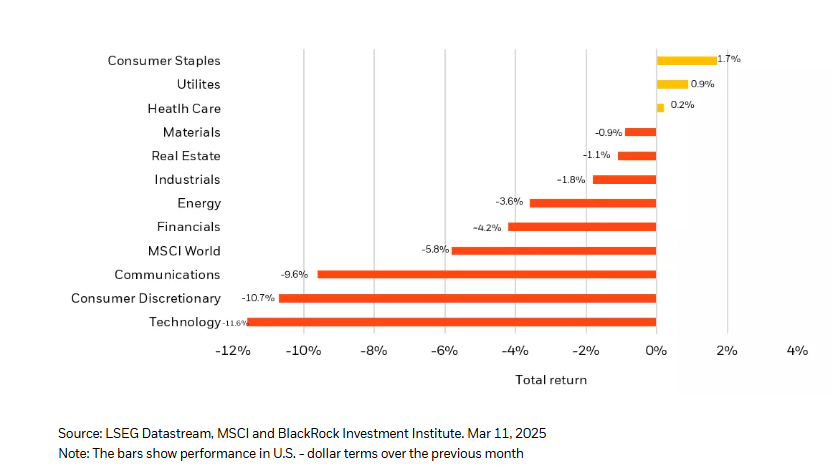
The fact that many of the names that defined last year’s trade were high growth companies with volatile shares has only exacerbated the losses. The flip side of this trade: last year’s underperformers, notably ‘defensive’ lower volatility names, are now this year’s biggest winners (see Chart 1).
Chart 1
Global sector performance - 1 months

Buy the beaten down quality names and manage volatility
While I still believe the U.S. stock market will end the year with modest gains, the last few weeks do mark a shift in investor behavior. To manage this new environment, I would focus on two strategies: buying now cheap(er) high quality growers and lowering overall portfolio volatility. Many of last year’s winners are now considerably cheaper. This is important as investors are paying more attention to value in stock selection. I would focus on the higher quality growth companies, i.e. those with the best cash-flow, margins and profitability. At the same time, consider adding less economically sensitive stocks, such as healthcare, funded by higher volatility stocks. Investors can still make money in this market, but the strategy needs to shift.
A message from Advisor Perspectives and VettaFi: To learn more about this and other topics, check out our most recent white papers.
About the Author
Russ Koesterich, CFA, JD, managing director and portfolio manager, is a member of the Global Allocation team.
Mr. Koesterich's service with the firm dates back to 2005, including his years with Barclays Global Investors (BGI), which merged with BlackRock in 2009. He joined the BlackRock Global Allocation team in 2016 as Head of Asset Allocation and was named a portfolio manager of the Fund in 2017. Previously, he was BlackRock's Global Chief Investment Strategist and Chairman of the Investment Committee for the Model Portfolio Solutions business, and formerly served as the Global Head of Investment Strategy for scientific active equities and as senior portfolio manager in the U.S. Market Neutral Group. Prior to joining BGI, Mr. Koesterich was the Chief North American Strategist at State Street Bank and Trust. He began his investment career at Instinet Research Partners where he occupied several positions in research, including Director of Investment Strategy for both U.S. and European research, and Equity Analyst. He is a frequent contributor to financials news media and the author of two books, including his most recent "The Ten Trillion Dollar Gamble."
Mr. Koesterich earned a BA in history from Brandeis University, a JD from Boston College and an MBA from Columbia University. He is a CFA Charterholder.
To obtain more information on the fund(s) including the Morningstar time period ratings and standardized average annual total returns as of the most recent calendar quarter and current month end, please click on the fund tile.
The Morningstar RatingTM for funds, or "star rating", is calculated for managed products (including mutual funds, variable annuity and variable life subaccounts, exchange-traded funds, closed-end funds, and separate accounts) with at least a three-year history. Exchange-traded funds and open-ended mutual funds are considered a single population for comparative purposes. It is calculated based on a Morningstar Risk-Adjusted Return measure (excluding any applicable sales charges) that accounts for variation in a managed product's monthly excess performance, placing more emphasis on downward variations and rewarding consistent performance. The top 10% of products in each product category receive 5 stars, the next 22.5% receive 4 stars, the next 35% receive 3 stars, the next 22.5% receive 2 stars, and the bottom 10% receive 1 star. The Overall Morningstar Rating for a managed product is derived from a weighted average of the performance figures associated with its three-, five-, and 10-year 60-119 months of total returns, and 50% 10-year rating/30% five-year rating/20% three-year rating for 120 or more months of total returns. While the 10-year overall star rating formula seems to give the most weight to the 10-year period, the most recent three-year period actually has the greatest impact because it is included in all three rating periods.
Carefully consider the Funds' investment objectives, risk factors, and charges and expenses before investing. This and other information can be found in the Funds' prospectuses or, if available, the summary prospectuses, which may be obtained by visiting the iShares Fund and BlackRock Fund prospectus pages. Read the prospectus carefully before investing.
Investing involves risk, including possible loss of principal.
This material is not intended to be relied upon as a forecast, research or investment advice, and is not a recommendation, offer or solicitation to buy or sell any securities or to adopt any investment strategy. The opinions expressed are as of March 2025 and may change as subsequent conditions vary. The information and opinions contained in this post are derived from proprietary and nonproprietary sources deemed by BlackRock to be reliable, are not necessarily all-inclusive and are not guaranteed as to accuracy. As such, no warranty of accuracy or reliability is given and no responsibility arising in any other way for errors and omissions (including responsibility to any person by reason of negligence) is accepted by BlackRock, its officers, employees or agents. This post may contain “forward-looking” information that is not purely historical in nature. Such information may include, among other things, projections and forecasts. There is no guarantee that any forecasts made will come to pass. Reliance upon information in this post is at the sole discretion of the reader.
Past performance is no guarantee of future results. Index performance is shown for illustrative purposes only. You cannot invest directly in an index.
Prepared by BlackRock Investments, Inc. LLC. Member FINRA
©2025 BlackRock, Inc or its affiliates. All rights reserved. BLACKROCK is a trademark of BlackRock, Inc. or its affiliates. All other trademarks are those of their respective owners.
USRRMH0325U/S-4345575
© BlackRock
Read more commentaries by BlackRock