T-bills and Chill…Most of the Time
Membership required
Membership is now required to use this feature. To learn more:
View Membership BenefitsFor the first time in a long time, fixed income investors have yield.
As of this writing in February 2024, short-term Treasuries yield over 5%, and long-term Treasuries around 4%.
Gone are the days of 0%, or even negative yielding bonds. (How weird was that?)
Retirees and fixed income investors are rejoicing, many acting like they just won the retirement lottery. For now, we’ll ignore the bond declines of 10%, 20%, or even 50% to get here.
Thus, the most popular financial phrase of 2023: let’s just “T-bills and Chill”.
Now that investors have reawakened to fixed income as an asset class; it opens the doors to all types of other bonds. Outside of US government bonds there are corporate bonds, junk bonds, mortgage backed bonds, TIPS, foreign bonds, and even Bowie Bonds.
How is an investor supposed to go about choosing between all of the various choices available? Many don’t, and they simply choose one of two allocations: either they invest purely in Treasuries and money market funds, or they buy a diversified bond strategy like the Bloomberg US Aggregate Bond Index, which is roughly 50% Treasuries, 25% corporate bonds and 25% mortgage-backed bonds.
Generally, as an investor moves away from what everyone considers to be the risk-free asset, T-bills, they accept some additional risk for the additional prospect of return. Two of the most well-known risks are the term premium and the credit premium.
- Term Premium – Instead of investing in short term T-bills, an investor could choose to invest in longer maturity Treasuries such as 30-year Treasury bonds. Additional compensation is expected for an uncertain future and additional volatility associated with the path of interest rates. Usually, if T-bills yield 5% then long-term bonds may yield 6% or 7%, in what would be described as an upward sloping yield curve.
- Credit Premium – Instead of investing in government bonds, and investor could allocate to corporate bonds issued by companies. These credits can vary in quality from AAA (not so many anymore) all the way down to high yielding junk bonds. Likewise, an investor would expect additional compensation for the default risk posed by bonds as they moved lower on the quality spectrum.
Anyways, there are lots of different types of bonds with different features, and generally, the riskier they are, the higher the spread these bonds will have to be to compensate the investor. Investing in bonds in countries like Turkey or Brazil could have yields north of 10% or even 20%. Japan and Switzerland? Still close to zero.
Pretty basic Investing 101 stuff here but stay with us for a second.
Just like the Buffett and Graham tales about the emotional Mr. Market showing up at your door to transact in stocks, the same is true for the bond world too.
For example, and these numbers are hypothetical for example’s sake, but let’s say T-bills yield 5%.
And let’s say Mr. Market shows up and offers you junk bonds for 5%. Does that make any sense? Probably not. What about at 2%? No way!
Now what if he changes his mind and decides to come back tomorrow and offer the same bonds at 8%? Might that be attractive? Probably so. Now how about 15%? More likely!
When evaluating an investment, you won't know if it's a potentially good or bad investment without knowing the price.
Howard Marks said it best when he explained, "There's no such thing as a good idea or bad idea in the investment world. It's a good idea at a price, it's a bad idea at a price."
Value and price are tied at the hip.
Marks has also talked about this as well, saying, “Good investing is not a matter of buying good things but buying things well. And if you don’t know the difference, then you shouldn’t be doing much investing.”
Bonds can be just as emotional as stocks. It has always been a bit puzzling to us to buy risky bonds when you are not receiving a margin of safety. If you can chill in T-bills at 5%, why take the risk to buy other bonds yielding less? It doesn’t make much sense but plenty of index investors do just that.
Could we create a strategy to only invest in riskier bonds when the opportunity was favorable?
Devising a strategy here is straightforward. One could let the yield spread between risky bonds vs. T-bills dictate how you invest. When the spread is sufficiently wide, invest in risky bonds. When the spread is narrow, sit in T-bills.
How wide or narrow should the spread be to change from T-bills to risky bonds (or vice versa)? It could vary based on how opportunistic an investor wants to be vs. how much time they want to spend in the market, along with other considerations such as tracking error and volatility.
An investor’s portfolio could sit in T-bills and rotate into the 10-Year Treasury Note when the yield was in the top half (50%) of history. You could also run the same strategy but only when the spread reaches the top 33% or 20%, etc.
We make sure we don’t include a look forward bias into models. It’s easy to invest in markets when you know how the future plays out! So, we’re only going to use data up to the date examined in the below simulations.
Let’s start with a simulation of investing in T-bills or the 10-Year Treasury Note. We’ll use a tactical system that rotates into the 10-Year based on the yield spread being in the top 50% of history. It will move back into the safety of T-bills when the spread narrows to the bottom 50% of history.
Below is a table with risk and returns metrics for this simple system.
Compared to T-bills, the 10-Year had higher returns, higher volatility, and a typical Sharpe Ratio for a buy and hold investment during the period (most buy and hold assets tend to be around a 0.2 to 0.3 Sharpe Ratio over time.)
The tactical system both increased returns and lowered volatility and max drawdowns. We do not include transaction costs or slippage in the simulations but do note this tactical system has a low turnover.
Exhibit 1 – Risk and Return Statistics for T-bills, 10-Year Treasury Note, and Tactical System
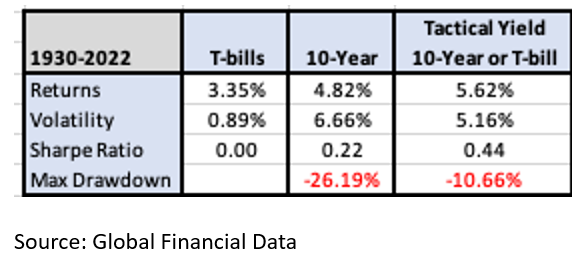
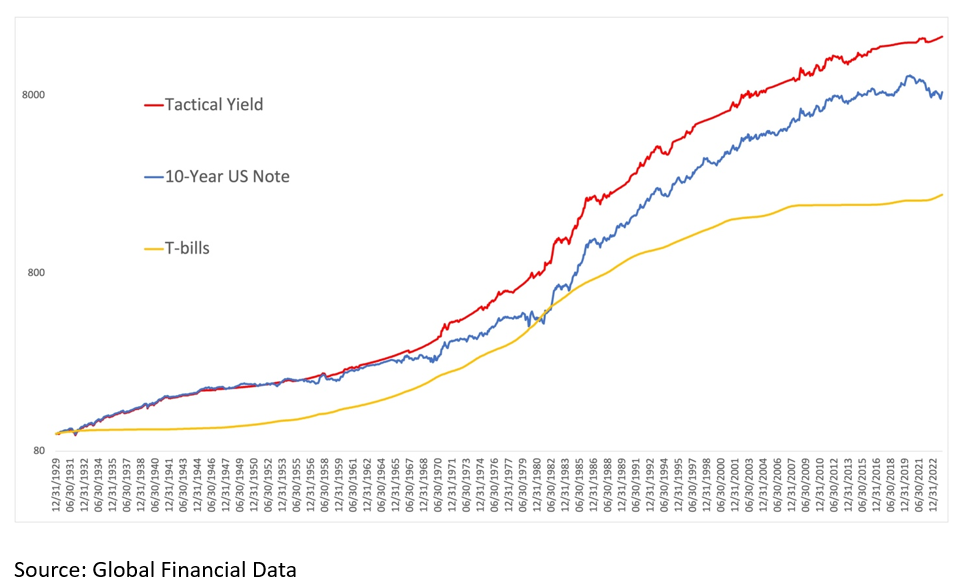
Exhibit 2 – Equity Curves for T-bills, 10-Year Treasury Note, and Tactical System
What if an investor decided to do the opposite - only invest in the 10-Year Treasury Note when the spread was in the bottom 50% of history and T-bills otherwise? This tactical system would have lower returns than T-bills – a decidedly poor idea. The lesson - when the spread isn’t compensating the investor, it doesn’t make much sense to take that risk.
We can look at different fixed income sectors with different risk and return characteristics and run the same simulation.
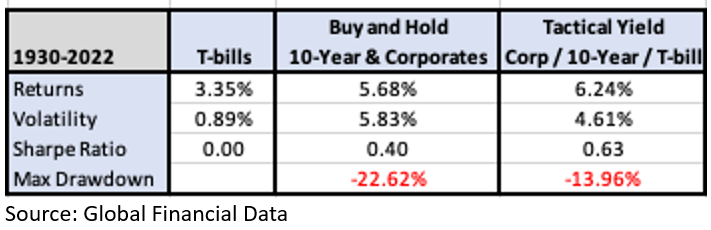
Below is a similar table for a strategy that considers investment grade corporate bonds. Again, you find a slightly higher return for the tactical system coupled with a little lower volatility and the same drawdowns. Unlike today, it was difficult to buy an index of corporate bonds 100 years ago, but the simulation below is meant to be instructive.
Exhibit 3 – Risk and Return Statistics for T-bills, Corporate Bonds, and Tactical System
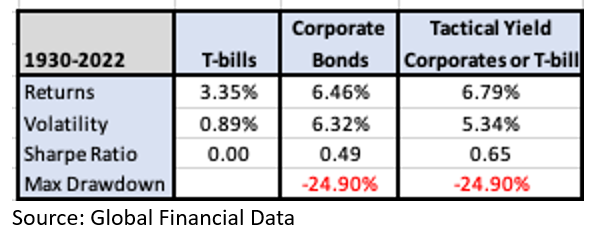
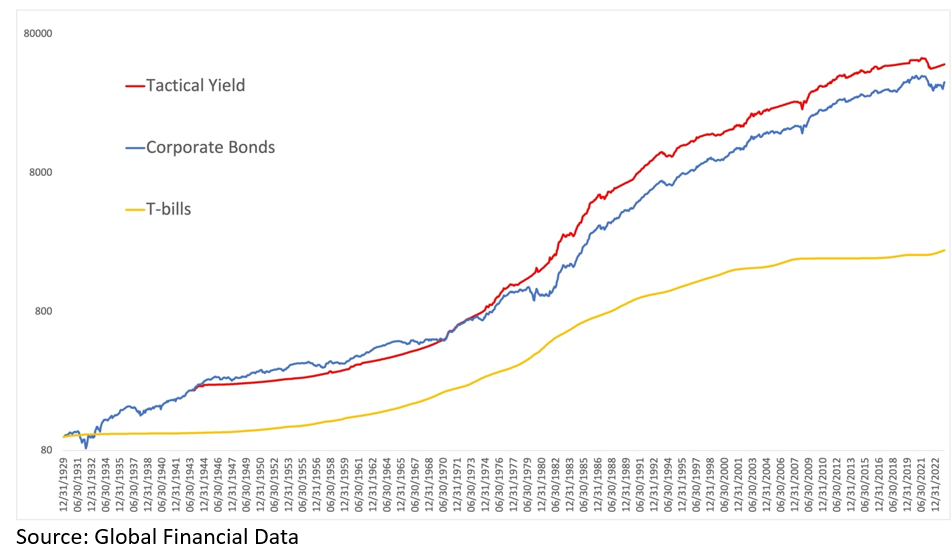
Exhibit 4 – Equity Curves for T-bills, Corporate Bonds, and Tactical System
And what if you combined the two? Invest in T-bills until corporate bond spreads or 10-Year Treasury spreads enter the top 50% of their respective historical ranges.
Exhibit 5 – Risk and Return Statistics for T-bills, 10-Year Treasury Note and Corporate Bonds, and Tactical System
There are numerous ways you can run these types of simulations:
- An investor could run this simulation across the entire series of Treasuries, including longer dated bonds such as the 30-Year, or even other types of US Government bonds such as TIPS, or agencies.
- An investor could run this simulation across the various levels of credits, from highly rated AAA all the way out to junk bonds.
- An investor could run this simulation across other more esoteric bonds with shorter histories, including emerging market sovereigns or corporate bonds, mortgage backed securities, and even high income equity products such as REITs.
In our simulations, we have found consistent results across all the assets above, albeit across varied and shorter time horizons.
What if you expanded the opportunity set to include more potential investments? In addition to the 10-Year Treasury Note and corporate bonds, below we layer in the 30-Year Treasury Bond, REITs, junk bonds, mortgage backed bonds, emerging market debt, and 10-Year TIPS as index data becomes available.
We equal weight the positions as they are introduced into the portfolio. Initially this would potentially be 50% each in the 10-Year Treasury and corporate bonds. Once we include all eight assets above, each would have a position size of roughly 12%.
Exhibit 5 – Risk and Return Statistics for T-bills, 10-Year Treasury Note, Diversified Portfolio and Tactical System
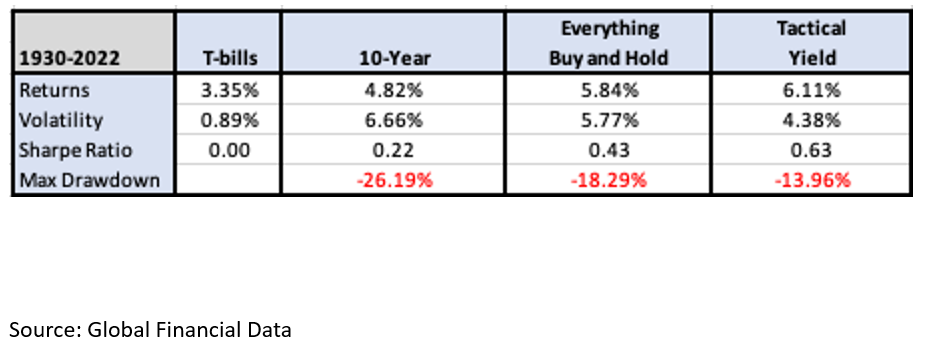
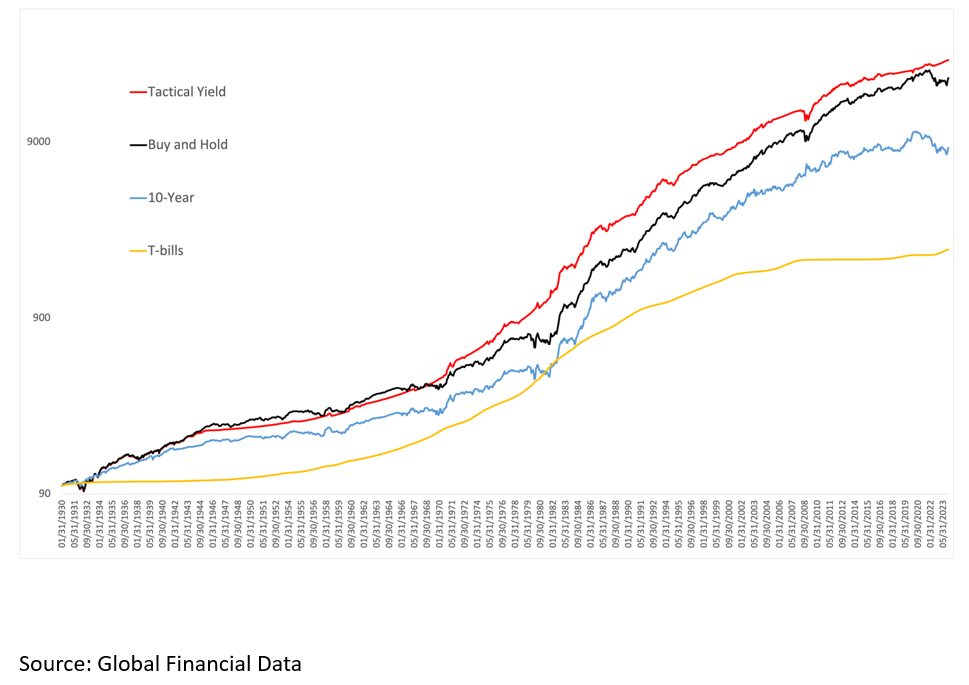
Exhibit 6 – Equity Curves for T-bills, 10-Year Treasury Note, Diversified Portfolio and Tactical System
As investors rejoice at the opportunity to earn yield once again, many may opt to just hang out in T-bills and chill. For many this is safe and simple choice.
Many investors are tempted to seek even higher yields, and the menu of choices is limitless. Those that move away from T-bills tend to add other bond categories on a buy and hold basis, and with that, introduce a variety of risks to their portfolios, including the potential for increased volatility and nominal drawdowns.
Unfortunately, and despite the current drawdown many bond investors are experiencing, some bonds categories still have even lower yields than T-bills. The traditional yield curve is still inverted, and many, if not all of the assets examined in the paper do not have a yield spread over T-bills that would place them in the favorable top half of history. If those bonds don’t compensate you with a reasonable margin of safety, is that a wise decision to allocate?
We don’t think it is, but we do think there’s a better approach. With this paper, we attempted to illustrate the effectiveness of implementing a tactical approach to fixed income investing based on the evaluation of yield spreads across a variety of fixed income sectors. We think the power lies in its ability to guide investors over time based on objective rules that have historically shown the ability to earn potentially higher returns than a simple buy-and-hold approach, but with lower volatility and drawdowns.
This simulation helps to answer the question, “When does it make sense to take on extra risk, and when might it not be prudent?”
Right now this systems is signaling: “T-bills and chill”. But at some point in the future, it will signal a potential green light to take on the additional exposures once again.
With that said, we think this dynamic approach to fixed income can serve as a core approach for investors looking for a strategy with an emphasis on the safety of Treasury bills, but systematically takes risk when opportunities and sufficient margins of safety present themselves.
Perhaps we will need to expand the phrase in the coming years to: “Let’s just T-bills and chill…. most of the time”.
A message from Advisor Perspectives and VettaFi: To learn more about this and other topics, check out our podcasts.
Membership required
Membership is now required to use this feature. To learn more:
View Membership BenefitsSponsored Content
Upcoming Virtual Events View All


