A Closer Look at Office Commercial Real Estate & Investment Opportunities within Securitized Products
Membership required
Membership is now required to use this feature. To learn more:
View Membership BenefitsOverview of U.S Office Commercial Real Estate
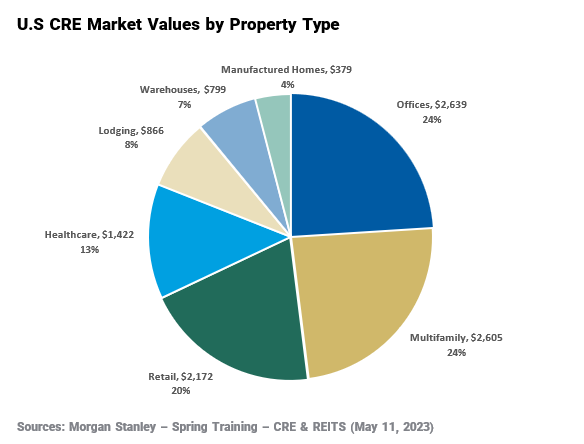
Office properties in the U.S. Commercial Real Estate (“CRE”) Market have been garnering much of the attention from the markets and media, especially after the fallout from the regional banking crisis that was largely stemmed earlier in 2023. We wanted to delve deeper into the subject to discuss our thoughts and the potential opportunities within the sector. To begin, we want to discuss the size of the sector and related sub sectors. Below is an overview of how the property types of the U.S. CRE market breaks down across the approximate $10.9 trillion market value. As shown below, Offices represent approximately one quarter of the market as of the end of 2022.
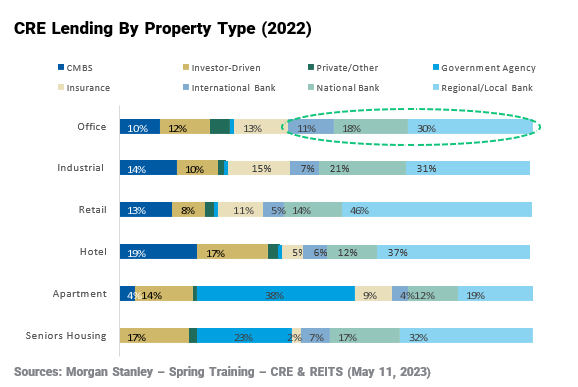
From a lending perspective, CRE mortgage debt as of the end of 2022 was approximately $4.5 trillion1. The chart below demonstrates that property types are generally funded by a different mix of funding sources. Apartments and Senior Housing property types, for example, are 38% and 23%, respectively, funded by government sponsored entities, such as Freddie Mac and/or Fannie Mae which benefits them greatly since they get the most competitive loan terms from these entities. Offices, however, don’t have the benefit of such government sponsored mortgage loans and instead are the second highest CRE property type largely dependent on funding from banks which were the lender of record on approximately 59% of Office CRE in 2022.
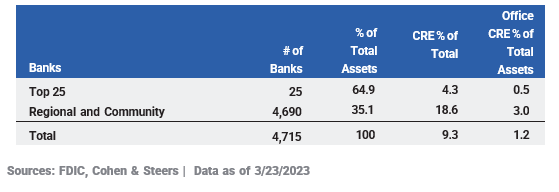
Digging further into lending on CRE by banks, the top 25 banks (by assets) have a lower exposure to both CRE and more specifically, Office CRE, than Regional and Community Banks. As highlighted in the chart below, the top 25 hold approximately 65% of total assets owned by banks in total, and only 4.3% and 0.5% of their assets have exposure to total CRE and Office CRE, respectively. Regional and Community banks have larger exposures to CRE and Office CRE at 18.6% and 3.0%, respectively, of their assets. Comparatively, Regional and Community banks have 4.3x more exposure to CRE and 6x more exposure to Office CRE than the top 25 banks.
Fundamentals of U.S. Office CRE Market
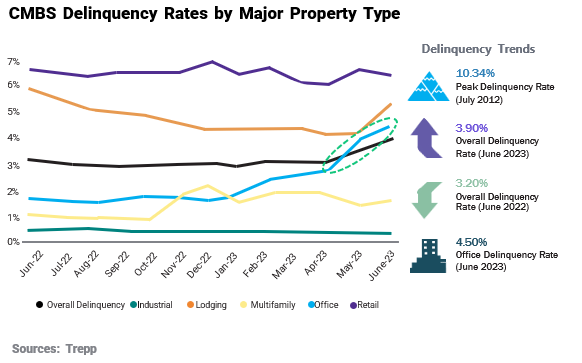
The performance of the CRE market has become bifurcated from a fundamental perspective. Namely because the various property types have endured different cycles of supply and demand since the onset of the COVID-19 pandemic in the beginning of 2020. When looking at these property types in Commercial Mortgage-Backed Securities (“CMBS”) deals, Multifamily and Industrial properties have held up considerably well. Industrial properties have performed and continue to perform extremely well because of the increased demand for such services as ware-housing online goods and computing hardware and data storage, both of which demand vast amounts of industrial space. Multifamily properties have per- formed relatively well stemming from the lack of supply in the residential real estate market, lower excess savings for down payments and higher mortgage payments, all of which have made homeownership mostly unattainable for many renters in the U.S.. Retail, which has underperformed other proper- ty types since the GFC, continued to underperform during the heights of the COVID-19 pandemic but has recently started to revert back down towards the CMBS overall delinquency average. Lodging which was a stronger perform- er post-GFC, significantly underperformed at the beginning of the COVID-19 pandemic as travel to and within the U.S. was abruptly halted and recovered slowly ever since. This sector has also started to revert towards the CMBS overall delinquency average, although it ticked back higher in June of 2023. Office, performed well during the beginning of the COVID-19 pandemic, be- cause many businesses were still holding onto their office spaces not knowing when and how the remote-work cycle, that ballooned during the pandemic, would affect their businesses. However, now that remote-work has become more embedded into the U.S. workforce’s culture than ever before, we are observing a considerable amount of increased vacancies, delinquencies and generally downsizing of office space across many businesses around the country as the business leases put in place prior to COVID-19 pandemic started to expire, leading this property type to be the weakest property type within the CMBS space as can be seen from the chart below. May 2023 marked the first month that Office property type delinquencies were higher than the CMBS overall delinquency average during this cycle.
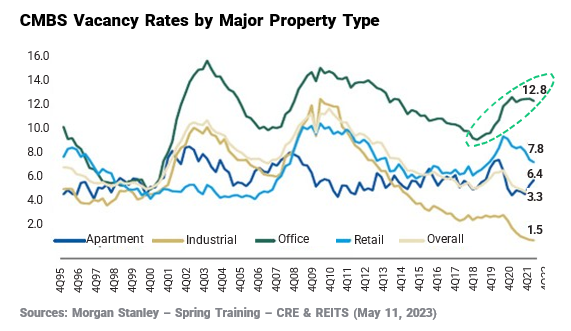
As we dig deeper into the Office sector and its fundamentals, we see that the vacancies for Offices in CMBS deals are considerably higher than the other CRE sectors in CMBS deals. Further, as a sector over- all, it has retraced the least compared to the initial spikes experienced by all property types at the onset of the COVID-19 pandemic in early 2020.
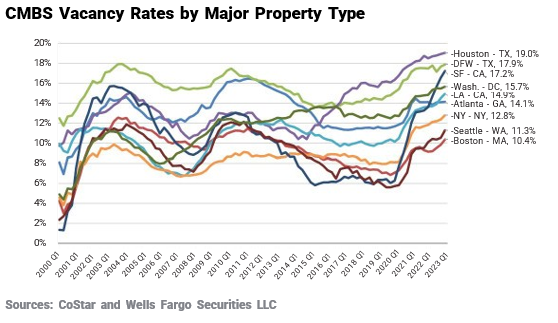
The chart below further breaks out Office vacancies by various markets by geography showing that oil/energy and technology focused areas such as Houston, Dallas and San Francisco are experiencing higher vacancy rates than other regions.
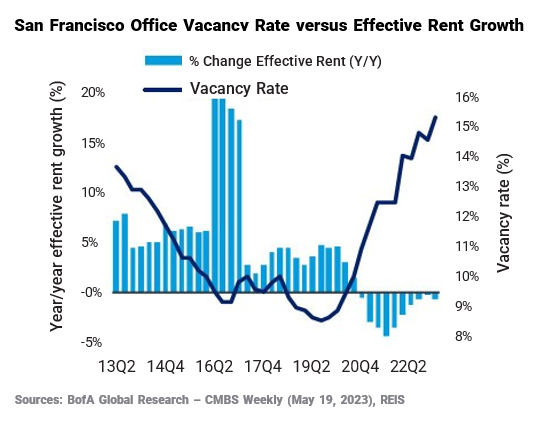
As a case study of the negative effects of such higher vacancy rates, below shows the vacancy rate of Office properties in the San Francisco area. We chose this as an extreme case study to show that vacancies have continued to increase ever since the onset of the COVID-19 pandemic. Although some geographic areas have been able to demonstrate some positive increase in rent growths in recent quarters, effective rents in San Francisco have continually decreased for 10 consecutive quarters, because of its higher-than-average vacancy rate.
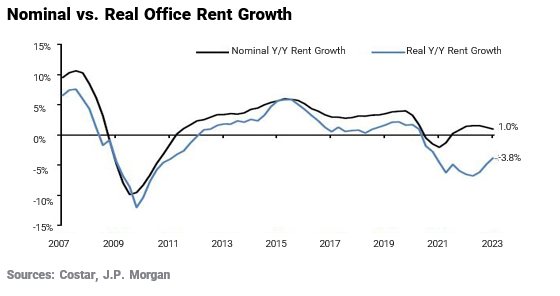
Further, when taking the historical amount of inflation into context the past few years, national office year-over-year real rent growth was still 3.8% as of the end of the first quarter of 2023.
Overview of U.S. Office Market Value
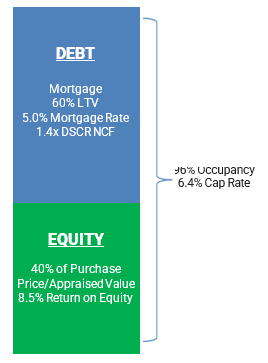
To demonstrate the potential negative effects of the higher vacancy, delinquency and rental decline rates in the Office sector and the potentially negative effects on their property value, below is an illustrative example of how a seasoned office property was potentially valued when acquired approximately 5 years ago. The illustration shows that if an Office property was 96% occupied, the potential net cashflow it would generate a year was approximately 1.4x the amount of debt service the buyer would have to pay for a 60% LTV mortgage with a 5.0% mortgage rate. Further, if the net operating income garnered a6.4% capitalization rate on the value of the building in this example, that would result in a return on equity of approximately 8.5% to the buyer of the building because of the leverage they were able to obtain on the mortgage. These high-single digit returns along with the potential for positive price appreciation (even more so on a levered basis) would be equity investments typically made by mortgage REITs and private equity companies. The debt, as discussed previously, was typically originated by banks, insurance companies and the likes.
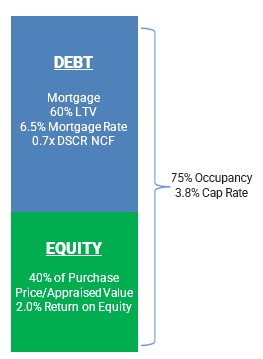
The illustration below fast forwards to that same Office property in today’s environment. If the same property was to be invested in to- day, the mortgage rate for the building would be much higher today than pre-COVID rates. The average yield of the 10-year U.S. Treasury Bond between 2013 and 2019 was approximately 2.31% versus the average yield of the 10-year U.S. Treasury Bond in the first half of 2023 was 3.62%. Couple that with the lower occupancy rates in many office buildings which results in a contraction of net cashflows and operating income that the same building can generate. Assuming the same property value as the previous example, a higher mortgage rate of 6.5% and a lower occupancy of 75% would reduce such Office building’s capitalization rate from 6.4% down to 3.8% which would impair the buyer’s return on equity down from 8.5% to 2.0% per year.
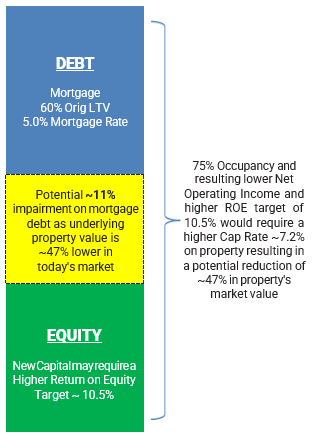
Obviously, any potential buyer in today’s environment is cognizant of this squeeze in potential net cashflows and operating income and is going to recalibrate their assumptions when allocating new capital to their existing and potential new investments. Considering mortgage rates increased as quickly as they did with the U.S. Federal Reserve Bank’s tightening schedule of 500 basis points within a year and a half, there is not much they can control in regard to the increased debt ser- vice burden. Although occupancies are lower than they used to be, the property still incurs similar, if not higher expenses due to inflation in order to properly maintain the building. Credit availability has shrunk as regional banks and other lenders are managing their existing port- folios, therefore it’s unlikely the buyer can originate a mortgage loan with a higher LTV. Further, lenders will be focused on the lower vacancies and will require updated appraisals and more conservative attachment points on any new mortgages they will be willing to underwrite for the borrowers. Lastly, the buyer / property owner’s ability to invest any new capital into the building and demonstrate an equity-like return will be limited as well. If they have the means to inject more capital into their property, that will lead to lower amount of debt they can borrow in a refinance. However, if they are limited on their ability to raise more capital, then a reduction in that property’s value and/or a workout/extension/modification of the existing debt will be pursued. In the example above, it would require an approximate 41% reduction in the property’s value for the buyer / building owner to achieve the same return on equity of 8.5% given the high- er mortgage rates and lower cashflows and operating income they are coping with right now. Further to note is that the return on equity being targeted may be higher than 5 years ago when this original loan was originated as cost of funds have increased for such investors. A 10.5% return on equity, for example, would require an approximate 47% reduction in the property's value for the buyer / building owner to achieve a current market return on such a property. In such in- stances illustrated below, the debtholders will employ workout specialists such as Special Servicers that will assess the situation and choose the strategy that offers the most optimized solution for the debtholders (i.e., foreclose and sell the property to pay off the debt or ex- tend the current loan’s terms as a bridge in an effort to improve fundamentals and the property’s market value).
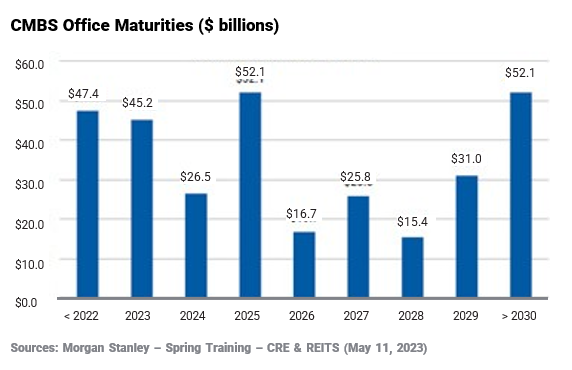
A real-life example of this illustration can be seen in 600 California Street in San Francisco’s Financial District. The buyer of the building was a joint venture between We Work Capital Advisors and Rhone in 2019 to buy and oversee real estate and included WeWork as the building’s anchor tenant. They defaulted on their $240 million mortgage loan in April 2023 after the building was appraised at a value of only $183 million. Another real-life example is PIMCO’s Columbia Property Trust which defaulted on approximately $1.7 billion of mortgage notes on seven buildings in San Francisco (CA), New York (NY), Boston (MA) and Jersey City (NJ), acquired in 2021 for approximately $3.9 billion. The mortgage loan secured by these properties was originated as a floating rate which moved forward the default given the sharp increase in benchmark rates could not be covered by the net cashflows of the buildings. Just this month, another example of a strategic default was from Starwood Capital Group, which chose not to pay off the loan at maturity on an approximately $213 million mortgage backed by an Atlanta office tower which was only 62% leased versus 87% when Starwood’s loan was originated in 2018, We foresee more strategic defaults by various equity holders going forward as there is a wall of upcoming maturities coming due over the next few years as can be seen in the following chart.
Eventually, vacancy rates, mortgage rates and property values should all reach a new equilibrium, but most likely, lower than the property values most Offices were valued at over the past few years. Cohen and Steers analysis estimates that borrowers of Office CRE mortgage loans may need to inject 25-40% more equity into their properties depending on the capitalization rate and LTV to buttress the drops in valuations. Their estimates may appear high, however, we don’t envision vacancy rates re- turning to their pre-COVID levels for at least a generation and it’s doubtful that mortgage rates will drop significantly, or credit availability will increase anytime in the near term given the macro-economic environment. Therefore, a drop in valuations, which in turn would require such equity injections, appears to be the logical choice to remedy the situation, unless the equity holder wants to strategically walk away from their previous investment. In such situations, lenders may choose to modify the existing loan with the borrower and avoid a loss until they foresee a potential foreclosure to liquidate the property to new buyers results in a better solution to pay off the outstanding mortgage loan they hold.
Securitized Product Opportunities
By taking all the factors into account and focusing on loss-adjusted total returns, we expect the following in regard to investments related to U.S. CRE investments in 2023:
1. We will remain somewhat selective and focus on investments that are secured by underlying assets with stronger vacancy and performance fundamentals than Office CRE properties, such as multifamily CRE properties. More specifically, we will look to avoid non-agency conduit CMBS transactions as they tend to include Office, as well as other underperforming property types like Retail and Lodging, which may have higher probability of being impaired in the current market considering the more difficult refinancing environment. We have and continue to focus on multifamily CRE properties as they have generally been able to increase rents while maintaining lower vacancy rates versus Office CRE properties, for example. As such, we feel multifamily CRE property values will be buoyed more so than other CRE types, especially Office properties. In the short term, we will look to focus on investments in the multifamily CRE targeting loss-adjusted returns in the mid-to-high single digits.
2. After the fundamentals flow through and “bottoming out” for Office and other CRE property types (i.e., vacancies stop increasing and property values are properly adjusted for new capital to enter the sector), defaults, recoveries and potentially credit spreads should reach more distressed levels than they’re trading at currently, which should potentially lead to sales of securities at very attractive valuations. We will look to make opportunistic investments in a wider array of investments secured by U.S. CRE that offer good risk- adjusted total returns that show promise of high single to mid-teen types of returns.
3. Considering the senior mortgage position banks have exposure to and their ability to work out of potentially impaired mortgage assets, we see value in some corporate debt issued by some Regional and Community Banks, which have widened considerably since the regional banking crisis unfolded in the first quarter of 2023. In Bram- shill’s next Monthly Insights article, we will break down specific exposure within some bank issuers from a granular capital structure standpoint referencing where we see the best risk-adjusted returns in that sector.
We believe that all-in-all the backdrop of a weakening economy and a hawkish U.S. Federal Reserve Bank (albeit in the later stages) will be a good foundation for most fixed income, especially in select Securitized Products such as CMBS sectors, and will help highlight that good asset selection resulting from a repeatable process with a long track record will allow Bramshill Investments to outperform our peers.
Disclosure:
Bramshill Investments, LLC (“Bramshill”) is an asset management firm and investment adviser registered with the U.S. Securities and Exchange Commission (“SEC”). Registration with the SEC does not imply any skillset of Bramshill or its employees. All statements and opinions are subject to change as economic and market conditions dictate. Investing involves risk, including the potential loss of principal, and the profitability of any particular investment strategy or product cannot be guaranteed. Our view and opinions are ac- curate as of the date of this letter and are provided for informational purposes only and are for the sole use of the intended audience/recipients, all of which are or represent current or potential investors in one or more investment vehicles or mutual fund (each a “fund” and collectively the “funds”) managed by Bramshill. The data and information presented herein has not been audited (except as otherwise expressly indicated) and is subject to subsequent adjustment. Bramshill has no obligation, express or implied, to update any of the information or to advise you of any changes. Similarly, Bramshill does not make any express or implied warranties or representations as to the completeness or accuracy, or accept responsibility for inaccuracies, errors or omissions. Past performance is not necessarily indicative of future results. No representation is being made that any fund or portfolio managed by Bramshill will or is likely to achieve profits or losses similar to those shown. The reader should not assume this is investment advice or an offer to solicit into one of our investment strategies. Further information regarding the funds and investment strategies are available upon request. For more information, please refer to www.bramshillinvestments.com
A message from Advisor Perspectives and VettaFi: VettaFi’s Fixed Income Symposium was the biggest virtual event of the summer. Register here for the replay link to learn from the experts and thought leaders who participated in the event.
Membership required
Membership is now required to use this feature. To learn more:
View Membership BenefitsSponsored Content
Upcoming Virtual Events View All


