A Drunk Man in the Snow: The Random Walk of Interest Rates
In the more obscure corner of the money market and banking statistics is the arcane data around bank reserves and money supply. One of the most important metrics in monetary theory is the money supply gauge referred to as M2. In its simplest definition, M2 represents the amount of money in currency, demand deposits, and checking accounts in the economy (the more narrow aggregate called M1) plus “near cash”—retail money market fund balances, savings deposits and small-denomination time deposits.
Now to the even more arcane world of the Federal Reserve’s (Fed) balance sheet, the liabilities of which include paper money, bank reserves and the U.S. Treasury’s general account.
As a hangover from the prior administration’s cash management, the Treasury currently holds about $1.6 trillion in its general account at the Fed, an amount far in excess of its pre-COVID cash balance target of roughly $400 billion. The Biden administration has decided to use more than $1 trillion of this excess cash to pay for stimulus rather than borrow new money. This is causing M2 money supply growth to soar at a rate of 25 percent over the past 12 months, more than five times the average annual growth rate going back to 1960.
The spike in M2 money supply can be explained by the massive fiscal stimulus deployed by the federal government, which was financed in large part by the creation of new money by the Federal Reserve. This stimulus has facilitated a surge in cash holdings throughout the economy from increased precautionary savings by households, businesses, and state and local governments.
As the stimulus checks go out, that cash moves into private sector checking accounts, causing M2 to balloon. Some of the money is spent, but most is saved. That unspent money eventually finds its way into securities markets either directly through investors or through banks choosing to invest deposit inflows in U.S. Treasury notes, Agency debentures and mortgage-backed securities, municipal securities, and asset-backed securities.

This flood of cash is driving short rates lower. Last week Libor set a record low of 18 basis points (bps) while Treasury bills now yield 3 bps and 2-year Treasury rates are at 16 bps. As the money continues to flood into the private sector we continue to see a rise in stock and bond prices. Over time, as stimulus payments and tax refunds are distributed and more money looks to be put to work, investors will extend maturities on their bond portfolios in a “reach for yield.”
Against this backdrop, 2-year Treasury note yields could go to 1 bp or lower and 5-year Treasury notes could easily reach 10 bps. These levels would put downward pressure on 10-year Treasury rates, likely rendering the current yield unsustainable.
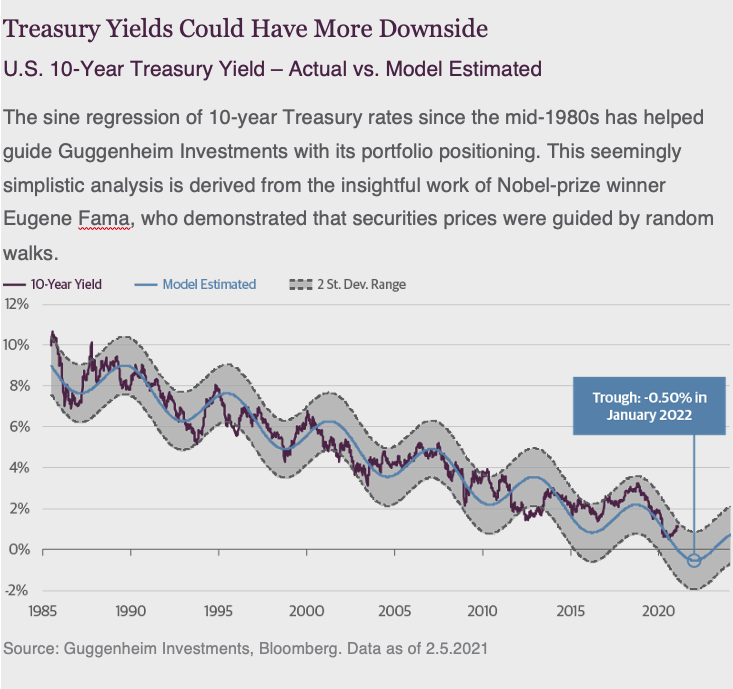
The easiest way to explain the random walk is the drunk man in the snow. As the drunkard drifts left and drifts right, each next observed step is random but he always heads in the right general direction towards home. The work of Fama and others has shown that securities prices follow a similar path where the next observable price may be higher or lower, but the mean drift of the trend line will generally be followed.
In our model of 10-year Treasury yields, the sine regression of 10-year rates since the mid-1980s, actual yields have generally stayed within a two standard deviation range of the model estimates. Currently our model suggests that while yields may drift up from here, there is still more downside. The model estimate for a trough of -0.5 percent in early 2022 is bounded by a two-standard deviation range of a high of 1 percent and a low of -2.0 percent.
The good news is that fixed-income investors can properly position their portfolios by not being underweight duration. The bad news is that this would set the table for negative rates in the event of any unexpected bad news about the economy or financial system.
The foregone conclusion today is that long-term rates are on an uninterrupted trajectory higher. History tells us something different.
In the wake of the 1982 recession rates moved markedly higher in 1983. In that year gross domestic product (GDP) grew at 7.9 percent. Anticipating an inflation resurgence, long rates skyrocketed early that year, with 10-year rates rising from 10.1 percent to a peak of 12 percent. Despite the pronounced inflation anxiety, by 1986 10-year Treasury yields were probing lows around 7 percent, about 300 bps lower than before the selloff in 1983 got underway.
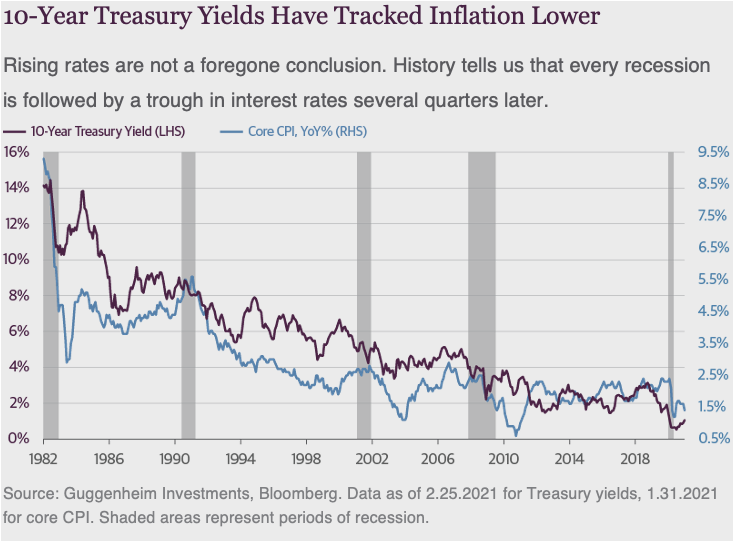
The same pattern occurred in the wake of the next two recessions. In 2008 the ten-year Treasury note touched a low of 2 percent. By 2010, as the economy began to rebound, bonds touched 4 percent only to subsequently fall to new lows of 1.4 percent in 2012.
Now, similar fears grip markets that reflationary pressures are paving the way to higher rates. No doubt, prices will rebound from post pandemic lows but given the surplus capacity throughout most of the economy and high levels of unemployment, any increase in the rate of inflation is likely transient.
Fed Chairman Jerome Powell has made it clear. Don’t look for restrictive policy from the Fed anytime soon. Prospects are for asset purchases to extend into next year with short-term rates to remain pegged at zero until at least 2024.
Against the back drop of rather benign inflation and easy money, investors will be tempted to reach for yield. An upward sloping yield curve is one of the few avenues remaining that provides an opportunity for fixed income investors to boost current cash flow. At the end of the day, taking on duration risk to get any reasonable return on cash will prove a temptation too great to resist.
Important Notices and Disclosures
Investing involves risk, including the possible loss of principle. Investments in fixed-income instruments are subject to the possibility that interest rates could rise, causing their values to decline. High yield and unrated debt securities are at a greater risk of default than investment grade bonds and may be less liquid, which may increase volatility.
This material is distributed or presented for informational or educational purposes only and should not be considered a recommendation of any particular security, strategy or investment product, or as investing advice of any kind. This material is not provided in a fiduciary capacity, may not be relied upon for or in connection with the making of investment decisions, and does not constitute a solicitation of an offer to buy or sell securities. The content contained herein is not intended to be and should not be construed as legal or tax advice and/or a legal opinion. Always consult a financial, tax and/or legal professional regarding your specific situation.
This material contains opinions of the author, but not necessarily those of Guggenheim Partners, LLC or its subsidiaries. The opinions contained herein are subject to change without notice. Forward looking statements, estimates, and certain information contained herein are based upon proprietary and non-proprietary research and other sources. Information contained herein has been obtained from sources believed to be reliable, but are not assured as to accuracy. Past performance is not indicative of future results. There is neither representation nor warranty as to the current accuracy of, nor liability for, decisions based on such information.
1 Guggenheim Investments assets under management are as of 12.31.2020. The assets include leverage of $13.7bn for assets under management. Guggenheim Investments represents the following affiliated investment management businesses of Guggenheim Partners, LLC: Guggenheim Partners Investment Management, LLC, Security Investors, LLC, Guggenheim Funds Distributors, LLC, Guggenheim Funds Investment Advisors, LLC,
2 Guggenheim Corporate Funding, LLC, Guggenheim Partners Europe Limited, Guggenheim Partners Fund Management (Europe) Limited, Guggenheim Partners Japan Limited, GS GAMMA Advisors, LLC, and Guggenheim Partners India Management.
Guggenheim Partners assets under management are as of 12.31.2020 and include consulting services for clients whose assets are valued at approximately $70bn.
©2021, Guggenheim Partners, LLC. No part of this article may be reproduced in any form, or referred to in any other publication, without express written permission of Guggenheim Partners, LLC.


