Wall Street and Main Street are two different zip codes. In 2020, one neighborhood struggled with rising economic uncertainty, while the other posted strong gains underscored by a loose fiscal and monetary environment. In 2021, we expect the neighborhood's economic fortunes to converge.
For most of 2020, strong gains from the largest stocks in the popular benchmark US indexes overshadowed the majority of the market. Until the end of the third quarter, the economic insecurity seen on Main Street weighed on 99% of the companies in the S&P 500, while the top 1% carried the index higher. This divergence is obscured due to the index’s market capitalization weighting construction.
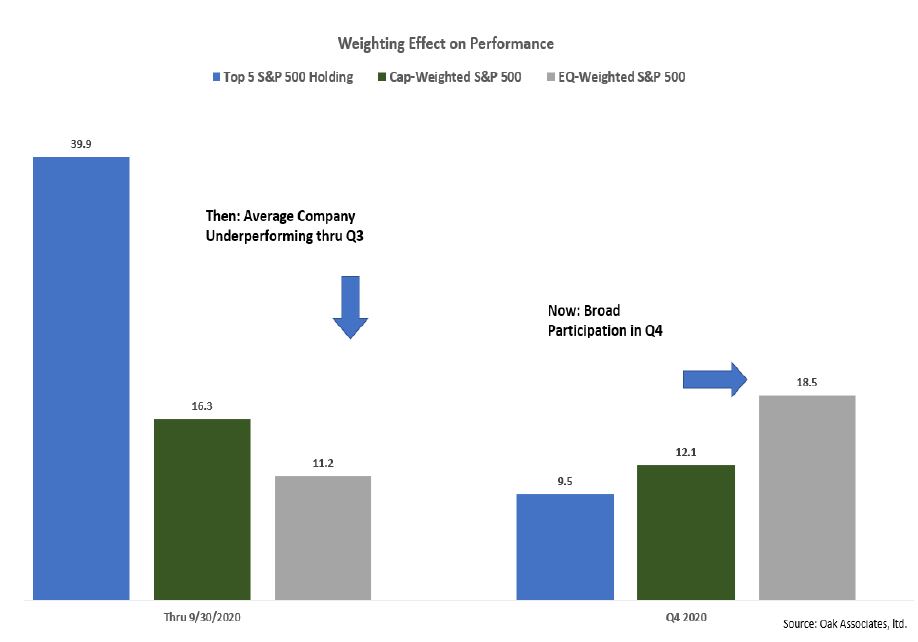
The effect that the ‘largest-of-the-large’ had on performance is evident when comparing the returns of the S&P 500 Index to its equally-weighted version. Through the end of the third quarter, the 5 top holdings rose an average of nearly 40% year-to-date, dragging the overall index higher while masking lackluster performance elsewhere. However, once positive vaccine news flow grew (culminating in emergency authorizations globally), the broader market did the heaving lifting. During the fourth quarter, the ‘other’ 495 stocks in the S&P have outperformed the top 5 holdings, and fueled the outperformance of the Equal-Weighted Index relative to its cap-weighted version.
As we move into 2021, broader participation from US companies bodes well for both Wall Street and Main Street. The stock market is a forward-looking discounting mechanism that is essentially pricing in a return to economic normalcy. While the 2020 stock market success was initially propelled by large-cap growth companies likely to weather the Coronavirus pandemic, the market is indicating that a more normalized economy is returning.

Certain sectors at the epicenter of the pandemic destruction, such as airlines, cruise lines, and entertainment stocks might take longer to recover, yet a dissipation of the economic uncertainty will help the broader economy. This return of cyclicality should also spread to other areas of the market, which have lagged in the Covid economy, such as financials and value stocks.
The Presidential Factor
The most frequent question we have received from clients recently is about the change in administration and its potential impact on US equities. This is an understandable concern, but in our experience, is one that is not as important as the underlying investment environment, global economic integration or unemployment trends.
Stock market forecasting based on political control is also usually a flawed exercise. Therefore, any potential moves based on politics alone is also suspect. First, the market tends to anticipate changes. So, timing matters. Much of the “Presidential Performance” data is either calendar year or from inauguration to inauguration. But this doesn’t seem fair. For example, from November 3 to year end 2020, the S&P 500 was up 11.8%. Should this be attributed to the current administration or the incoming administration? Either way, the return data is unreliable.
Second, in order to make evidence-based conclusions statisticians require numerous observations to truly assess whether data is predictive. In the case of Presidents, there are simply not enough examples to evaluate the significance of a result with any real certainty. This limitation is even more pronounced when combining which party controls the other branches of government as it further reduces the number of samples.
We share these flaws, not to diminish the concerns of any change in administration, but to underscore that of all the information, factors, data and analysis used to forecast the outlook for equities, the occupant of the White House is simply not the most important or reliable. If anything, only broad generalizations can be made and even these are favorable.
The chart below shows the performance of the S&P by President. While still too limited to make definitive conclusions, it is clear you can have good markets under both political parties. Indeed, regardless of the window used, in this example the average annual return has been over 9% per year since 1953.
In our opinion, the most important determinant of the President’s impact on the stock market’s performance is actually the starting valuations prior to Election Day. In this regard, the near-term future for the S&P 500 is mixed. As a result of the strength in the top weightings of the index highlighted above, and due to a decline in earnings throughout the rest of the market, valuation levels have climbed higher. To us, this indicates that being more valuation sensitive in 2021 is prudent. Additionally, the path to higher equity prices will depend upon broader participation of index holdings and better earnings in a normalized economy. It is a scenario where the other 495 stocks in the S&P drive returns rather than the top 5. This is exactly what is unfolding presently.
Given the status of the US economy, the incoming administration will have to balance support of the economic recovery with any increase in regulation or taxation. There is likely to be a deference to continuing the economic recovery while overcoming the pandemic. Political party policies may be different, but both want (and need) a strong economy. If anything, a new administration does not want to suppress a recovery or be blamed for a recession. Talk of higher capital gains taxes is certainly an issue for investors, but it is not uncommon for these to change, nor should taxation decisions prevent embracing long-term investing. Post-transaction taxes do not affect investors evenly, so their impact is usually less pronounced. Finally, equity market returns under both of the most recent Democratic Presidents have been favorable, so a shift in economic ideology isn’t necessarily a straight negative for equities.
Go-Go-Growth
The second-most common question we have received is whether the market’s leading large-cap growth stocks will continue to outperform in light of their outsized impact on 2020’s performance. As commonly expressed, “past performance is no guarantee of future performance” and universal outperformance is anyone’s guess. What is not in dispute is the group’s unique characteristics of incredibly profitable business models, dominant market position, strong commitment to shareholder value and sustainable competitive advantages. This remains an attractive combination of characteristics.
Investing or avoiding any stock based on past performance is rarely successful. For example, in 2015 Amazon gained 117% compared to a flat S&P 500. That was a huge return from one of the largest companies in the index. Yet, Amazon then proceeded to achieve double digit gains for the next 5 consecutive years, including 76% in 2020. So, while certainly not all of the top 5 or 10 largest companies will continue to outperform, their unique attributes can lead to impressive returns and frequently transcend market cycles. We continue to monitor the top 10 names and their respective outlooks.
As 2020 has come to an end, all of us at Oak Associates hope you have a healthy and prosperous New Year. Please stay safe.
Thank you for your investment with Oak Associates.
Robert Stimpson, CFA
Portfolio Manager Oak Associates, ltd.
IMPORTANT INFORMATION
The statements and opinions expressed are those of the author and do not represent the opinions of Oak Associates or Ultimus Fund Distributors, LLC. All information is historical and not indicative of future results and is subject to change. Readers should not assume that an investment in the securities mentioned was profitable or would be profitable in the future. This information is not a recommendation to buy or sell.
To determine if this Fund is an appropriate investment for you, carefully consider the Fund's investment objectives, risk factors and charges and expenses before investing. This and other information can be found in the Fund's Prospectus which may be obtained by calling 1-888-462-5386 or visiting our website at www.oakfunds.com. Please read it carefully before investing.
Mutual fund investing involves risk, including possible loss of principal.
This manager commentary represents an assessment of the market environment at a specific point in time and is not intended to be a forecast of future events, or a guarantee of future results. This information should not be relied upon by the reader as research or investment advice.
Past performance is no guarantee of future results. Investments are subject to market fluctuations, and a fund’s share price can fall because of weakness in the broad market, a particular industry, or a specific holding. The investment return and principal value of an investment will fluctuate so that an Investor’s shares, when redeemed, may be worth more or less than their original cost and current performance may be lower or higher than the performance quoted. Click here for standardized performance.
Amazon.com, Inc is owned in the following Oak Associates Funds with percentage weights in parentheses and as of 12/31/2020; Pin Oak Equity (9.1%), Red Oak Technology Select (7.8%), White Oak Select Growth (13.1%).
The S&P 500 Index is a commonly-recognized, market capitalization weighted index of 500 widely held equity securities, designed to measure broad U.S. equity performance. One cannot invest directly in an index.
The Purchasing Managers' Index (PMI) is an index of the prevailing direction of economic trends in the manufacturing and service sectors. It consists of a diffusion index that summarizes whether market conditions, as viewed by purchasing managers, are expanding, staying the same, or contracting.
CFA is a registered trademark of the CFA Institute.
Oak Associates Funds are distributed by Ultimus Funds Distributors, LLC. Ultimus Fund Distributors, LLC and Oak Associates Funds are separate and unaffiliated.
Ultimus Fund Solutions, LLC is not affiliated with Constant Contact.
© Oak Associates
Read more commentaries by Oak Associates