High-Frequency Data & COVID-19: Using Groceries to Track the COVID Response
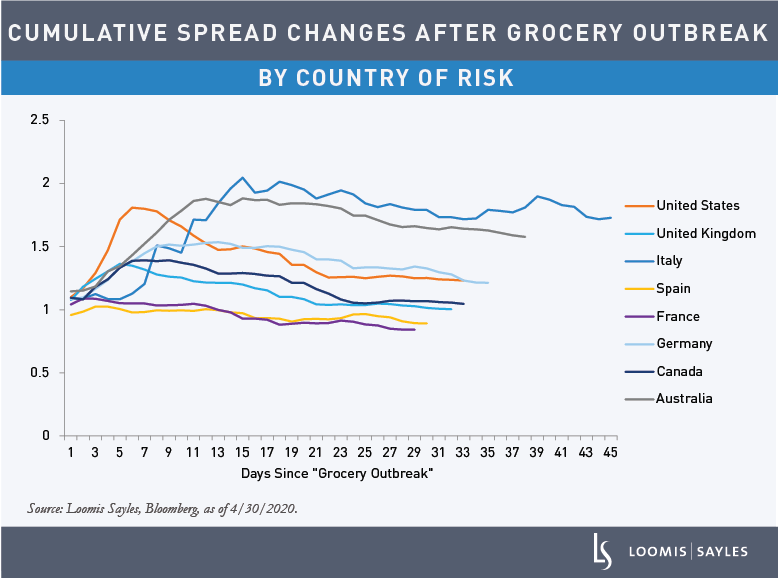
It can be difficult to give a fair representation of each country’s market response to the COVID-19 outbreak. Each nation has varying initial conditions, population responses and approaches to quarantines. Some countries have not issued a formal quarantine order, yet many people may have chosen to quarantine anyway. How can one measure a country’s response under these circumstances? We believe high-frequency data can offer some answers.
Groceries: a leading indicator for quarantine start dates
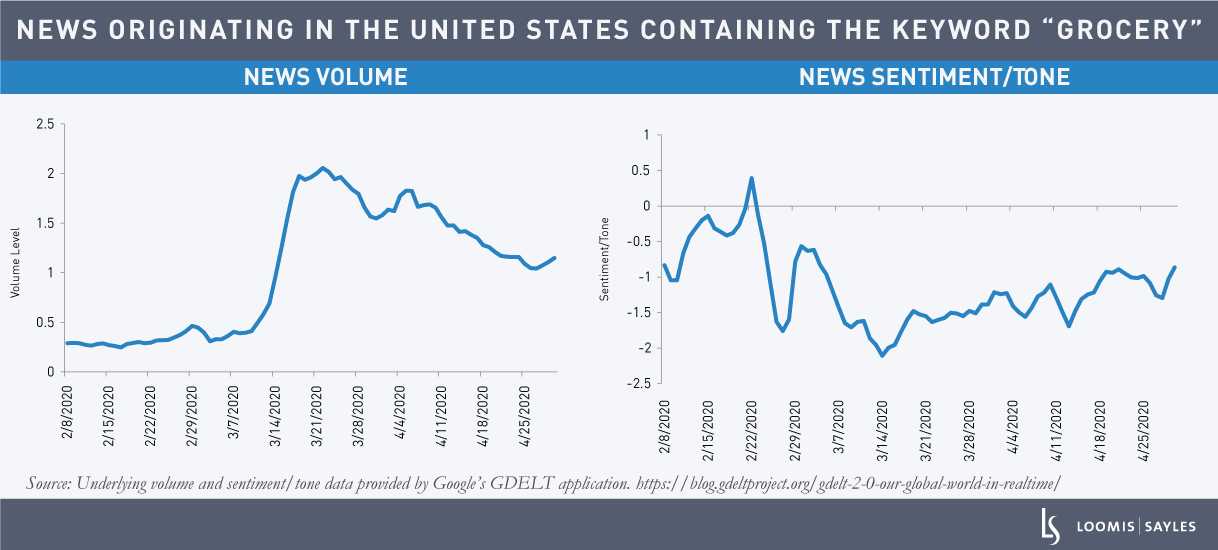
We looked at global news volume and sentiment surrounding “food” and “groceries,” and found that these metrics gave us insight into when populations truly began to follow quarantine procedures.
The chart below shows the volume (left, in blue) and sentiment (right, in blue) of news originating in the United States containing the keyword “grocery.” The underlying theory is that as pressure to quarantine grows—either through social means or through government lockdowns—so will the concern for essential items like food and groceries. Thus, the keyword “grocery” could be a leading indicator for quarantine start dates. The US experienced a clear inflection point in both volume and sentiment on March 14, 2020. This date is likely very close to the date most Americans began to quarantine, as they prepared to stay home and stocked up on groceries.
Once we determine a country’s “grocery outbreak” date, we can examine the subsequent trend in grocery queries. Comparing this information with that of other economies, we can project the current slope forward to estimate when a country may be able to start reducing the intensity of quarantines.
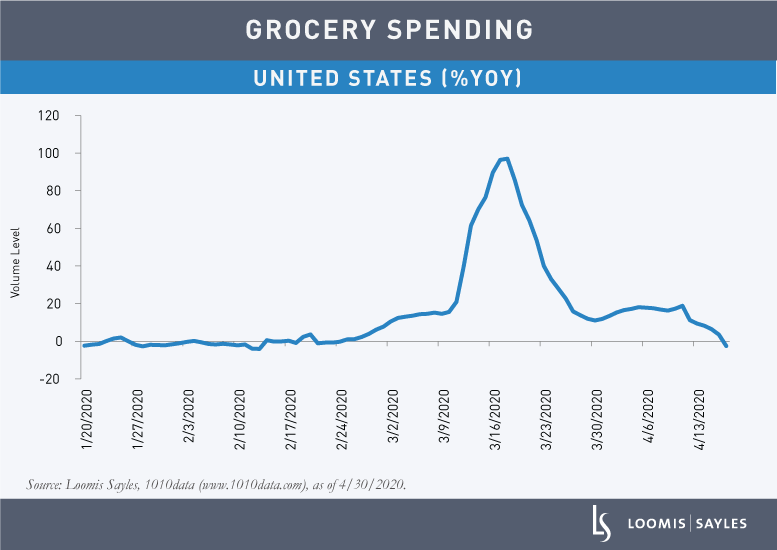
Consumer spending patterns
We’ve also been watching a complementary measure of the “grocery” outbreak: consumer spending, arguably among the purest forms of behavioral data. US consumer spending on food and groceries noticeably spiked at about the same time grocery query data surged. Year-over-year sales accelerated from a mid-single-digit run rate in the last week of February to almost 100% in mid-March as people hoarded items like toilet paper and sanitizer. The rush was a direct reaction to shortages of similar items in China and other countries with preceding outbreaks. Since then, spending has fallen in line with last year’s numbers.