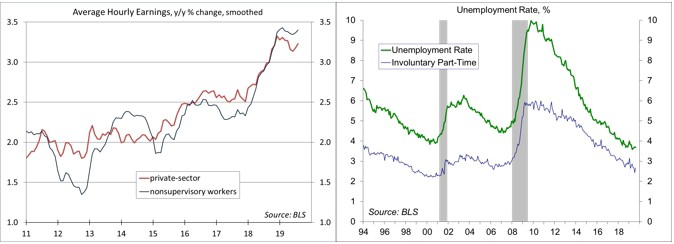
Nonfarm payrolls rose by 130,000 in the initial estimate for August, less than expected and despite a 25,000 boost from census hiring. For production workers, average hourly earnings advanced by 0.5% (+3.5% y/y). Monthly wage and payroll figures can be choppy, but the underlying trend in job growth is lower. Is that because of labor market constraints (a lack of bodies) or does it reflect a weaker pace of economic growth? The increase in wage growth would suggest that the labor market is tight. Does the Fed then worry more about weaker job growth or higher wage inflation? Policymakers are likely to remain split heading into the September 17-18 Federal Open Market Committee meeting.
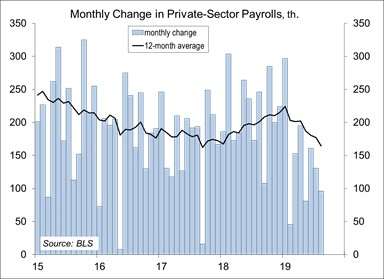
Private-sector payrolls rose by 96,000 in August, with a 35,000 net downward revision to June and July. That brought the three-month average to 129,000, significantly lower than last year’s pace (currently reported at +215,000, although annual benchmark revisions, due in February, can be expected to lower that to about +185,000). We need less than 100,000 jobs per month to absorb new entrants into the workforce. The unemployment rate held steady at 3.7%, but labor force participation rose, implying that there is little slack remaining. Average hourly earnings data are notorious quirky. Figures are often revised in the following month. However, the trend is higher, which is what you would expect to see as the job market tightens.

Click here to enlarge
Much has been made regarding the improvement at the low end of the wage scale (which is coming from a low base, having been restrained in the recession and gradual recovery). In public comments, Fed Chair Powell has indicated that he was particularly struck by what that means for the communities that were largely bypassed by the economic recovery. The labor market is the widest channel for inflation pressure and the Fed has historically looked to wage pressures as a key guide to Fed policy. That may be changing, although many Fed officials will point to the wage data in suggesting a need for less accommodative policy.
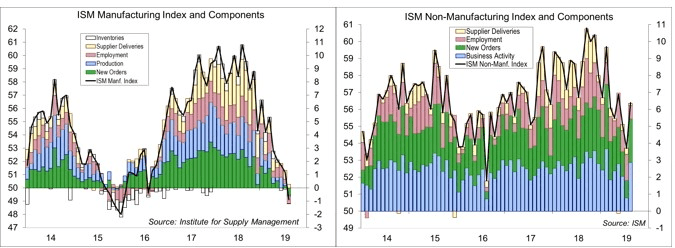
The August ISM surveys were mixed. The manufacturing data were weaker than expected, with the headline figure, new orders, production, and employment each moving below the breakeven level (50). The financial press reported that “manufacturing is in a contraction,” but that was already apparent. The ISM figure is a diffusion index, which doesn’t measure actual activity, but is a signal of the general direction (in this case, lower). The Federal Reserve’s index of manufacturing output peaked in December and fell 1.6% in the first seven months of the year. In contrast, the non-manufacturing index was stronger than expected, consistent with moderate growth in the overall economy.
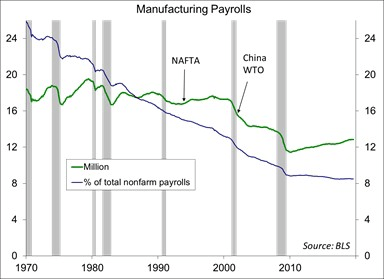
Manufacturing payrolls have slowed this year. Increased tariffs may have been meant to “bring jobs home,” but supply chains have shifted from China to other countries (including Vietnam and Mexico). Moreover, U.S. manufacturing uses parts and supplies from around the world. Manufacturing firms have a mixed ability to pass higher costs along. Tariffs, especially the May 10 escalation, are pressuring profit margins. China’s rise has had a negative impact on manufacturing jobs since 2000. However, about half of the job losses were due to technology.
Click here to enlarge
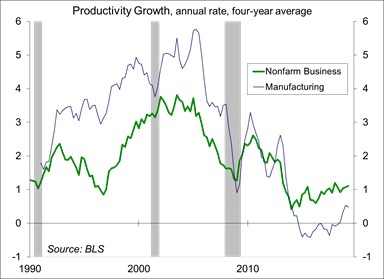
Nonfarm business productivity has picked up over the last year (+1.8% over the last four quarters), but manufacturing productivity has weakened (a -2.3% annual rate in 4Q19, unchanged y/y). This is a contrast to previous decades, when manufacturing productivity outpaced overall productivity (likely reflecting technology advancements and the shedding of low-productivity jobs overseas).
Click here to enlarge
Minutes of the July 30-31 Federal Open Market Committee showed that officials were split on whether to cut rates at that time (but there was an overall consensus to move). The August Employment Report (slower job growth, higher wage pressures) is likely to keep officials split. Chair Powell cited three reasons for cutting rates in July: 1) the economic drag from slower global growth and trade policy uncertainty; 2) the downside risks these factors pose going forward; and 3) the low trend in inflation. Data since the July FOMC meeting suggest even slower global growth and trade policy is more uncertain (despite the stock market’s hope for progress) following President Trump’s imposition of further tariffs announced on August 1. Faster wage growth may push consumer price inflation higher, but trade policy is expected to have a negative impact on growth, which would have a bigger, negative impact on inflation. Needless to say, there is a lot of uncertainty (keeping officials split).
Data Recap – The ISM surveys for August were mixed and the employment report disappointed, but investors were more focused on the prospects for high-level trade talks.
Fed Chair Powell repeated that he is optimistic about the U.S. economic outlook and sees inflation moving up to the Fed’s 2% goal. He provided no clear signal of what the FOMC will do at the upcoming policy meeting. Asked about divergent views on monetary policy among Fed officials, he said that’s not unusual given the high level of uncertainty in the outlook.
Chinese officials indicated that high-level Trade Talks with the U.S. will resume in early October (that doesn’t mean that we’ll see actual progress).
The August Employment Report was disappointing. Nonfarm payrolls rose by 130,000 (median forecast: +160,000), despite a 25,000 boost from temporary hiring for the 2020 census. Private-sector payrolls rose by 96,000, leaving the three-month average at 129,000 (vs. +215,000 in 2018). Average hourly earnings rose 0.4% (+3.2% y/y), up 0.5% (+3.5% y/y) for production workers. The unemployment rate held steady at 3.7%, while labor force participation improved to 63.2% (from 63.0% in July and 62.7% a year ago).
Click here to enlarge
The ISM Manufacturing Index fell to 49.1 in August, vs. 51.2 in July and 51.7 in June. New orders, production, and employment dropped below the breakeven level. Order backlogs fell for the fourth consecutive month (not good). Input price pressures continued to retreat. The report noted that “respondents expressed slightly more concern about U.S.-China trade turbulence, but trade remains the most significant issue, indicated by a strong contraction in new export orders.” Respondents continued to report supply chain adjustments away from China.
Click here to enlarge
The ISM Non-Manufacturing Index rose to 56.4 in August, vs. 53.7 in July and 55.1 in June – a pace consistent with moderate growth in the overall economy. Growth in business activity and new orders picked up. Employment growth slowed. Input price pressures were higher, but still moderate. The report noted that “respondents remain concerned about tariffs and geopolitical uncertainty; however, they are mostly positive about business conditions.”
The Fed’s Beige Book indicated that “the economy expanded at a modest pace through the end of August.” Job growth and inflation were both described as “modest.” Manufacturing weakened.
Unit Motor Vehicle Sales edged up to a 17.0 million seasonally adjusted annual rate in August, vs. 16.8 million in July and 16.9 million a year earlier.
The Challenger Job-Cuts Report showed announced corporate layoff intentions rising to 53,480 in August, vs. 38,845 in July (figures are not seasonally adjusted) and 38,472 a year ago. The total for the first eight months of 2019 were up 36% relative to the first eight months of 2018. It was the highest 12 month total since 2010, although still relatively low by historical standards.
The ADP Estimate of Private Sector Payrolls rose 195,000 in August, averaging +148,000 over the last three months, with balanced growth across firm size (vs. some weakening for small firms in the three previous months).
Nonfarm Productivity rose at a 2.3% annual rate in revised estimate for 2Q19 (same as in the preliminary estimate, +1.8% y/y), with unit labor costs at a +2.6% pace (vs. +2.4% in the preliminary estimate, +2.6% y/y).
Factory Orders rose 1.4% in August (+0.4% y/y), boosted by a rebound in aircraft orders. Ex-transportation, orders rose 0.3% (-0.2% y/y). Orders of durable goods rose 2.0% (vs. +2.1% in the initial estimate). Orders for nondefense capital goods ex-aircraft rose 0.2% (-0.6% y/y), with shipments down 0.6% (+1.1% y/y). Manufacturing productivity fell at a 2.2% annual rate (unchanged year-over-year), with unit labor costs up 6.7% (+4.5% y/y). Preliminary figures for the nonfinancial corporate sector showed productivity rising 2.8% (+2.6% y/y), with unit labor cost at a 2.2% pace (+1.3% y/y).
The U.S. Trade Deficit narrowed to $54.0 billion in the July, vs. $55.5 billion in June.
The Bank of Canada left short-term interest rates unchanged. The BOC noted that “Canada’s economy is operating close to potential and inflation is on target.” However, “escalating trade conflicts and related uncertainty are taking a toll on the global and Canadian economies.”
The opinions offered by Dr. Brown should be considered a part of your overall decision-making process. For more information about this report – to discuss how this outlook may affect your personal situation and/or to learn how this insight may be incorporated into your investment strategy – please contact your financial advisor or use the convenient Office Locator to find our office(s) nearest you today.
All expressions of opinion reflect the judgment of the Research Department of Raymond James & Associates (RJA) at this date and are subject to change. Information has been obtained from sources considered reliable, but we do not guarantee that the foregoing report is accurate or complete. Other departments of RJA may have information which is not available to the Research Department about companies mentioned in this report. RJA or its affiliates may execute transactions in the securities mentioned in this report which may not be consistent with the report's conclusions. RJA may perform investment banking or other services for, or solicit investment banking business from, any company mentioned in this report. For institutional clients of the European Economic Area (EEA): This document (and any attachments or exhibits hereto) is intended only for EEA Institutional Clients or others to whom it may lawfully be submitted. There is no assurance that any of the trends mentioned will continue in the future. Past performance is not indicative of future results.
© Raymond James
© Raymond James
Read more commentaries by Raymond James