“Never say never
Never say always
Always reevaluate
And never give up!”
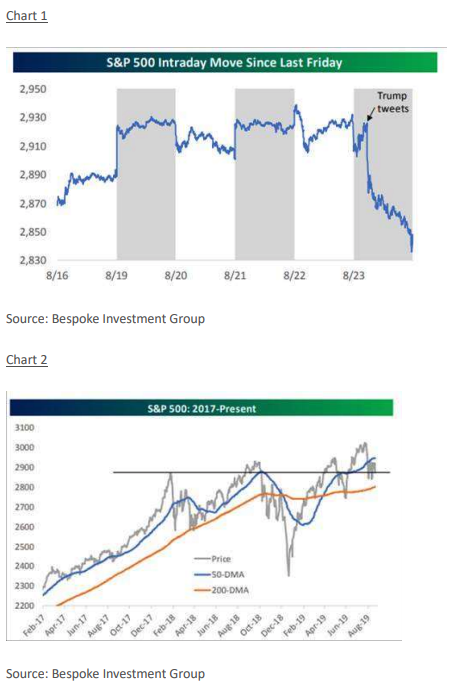
. . . is a mantra passed on to us by a mentor in the late 1960’s. We recalled it last Friday while talking to a portfolio manager that said, “I give up! Fundamentals do not mean anything anymore because equity markets swing to-and-fro based on the latest tweet from one official to the other.” Take last Friday, the session was supposed to be dominated by Fed Head Powell’s speech, but it was preempted by China’s news of further tariffs on U.S. goods (chart 1). B-A-N-G, the preopening S&P 500 futures fell a large 18 points in premarket trading. Knowing the session would be a throwaway we left for the dermatologist, who is cutting us away a little piece at a time, then the dentist, followed by a stint at the beach and then back to our post late in the day only to find the major indices sharply lower due to the rhetoric of the day. Therefore, we turned off our computer, which is a move we suggest most of you should consider during such market machinations. In Friday’s Fade the S&P 500’s (SPX/2847.11) intraday low was 2834.97, or about 10-points above the triple bottom at the 2822 – 2825 level. Here is an example of one of the President’s tweets on Friday:
The vast amounts of money made and stolen by China from the United States, year after year, for decades, will and must STOP. Our great American companies are hereby ordered to immediately start looking for an alternative to China, including bringing your companies HOME and making your products in the USA. I will be responding to China’s Tariffs this afternoon. This is a GREAT opportunity for the United States.
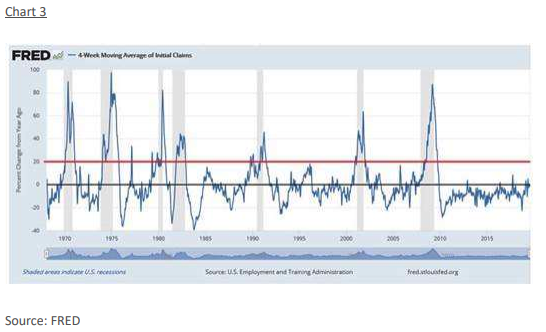
Well, the stock market didn’t think it was such a great opportunity. We stated on CNBC last Tuesday morning that the SPX was likely ahead of itself after sprinting over 100-points from its August 5 low of ~2822, but we did not think any pullback would be very large. Moreover, we opined that the SPX’s 50-day moving average at ~2946 would likely halt the rally allowing the SPX to rebuild its internal energy (chart 2). Preliminary data indicates Friday was another 90% Downside Day meaning 90% of the total volume traded was on the downside. We will see if that 90% call is correct when we check today’s Wall Street Journal. If it proves to be a 90% Downside Day, it will be the third such day since the August 5 low. We will say Friday’s daily Advance/Decline figures were terrible with 496 of the S&P 500’s stocks trading down for the session. S a u t S t r a t e g y While Powell’s speech was supposed to be the highlight of the week for us the highlight was last Wednesday’s conference call/webinar with our friend Bill Kohli the portfolio manager of several Putnam’s bond funds (I have owed PDINX for over ten years). With over 1000 participants dialed in to the call many topics were discussed. However, most of the questions were about the yield curve inversion and the implication about a looming recession. I have suggested this is the wrong interpretation because the inversion is being caused by capital flows. Bill answered this question by stating the indicator he uses is jobs x wages x hours worked and that indicator is not registering a recession signal. One particularly savvy seer writes:
I listened to a Head Strategist on a Bloomberg Interview. (Can’t recall who, but think he was from PIMCO). He made a comment about the four-week MA (moving average) of Initial Unemployment claims (every Thursday), which is one confirming signal for an inverted curve. A definitive change in trend (higher highs and higher lows) is the signal. He looked at it a little differently stating that should the Y/Y rate of change of the 4- week MA of Initial Unemployment Claims reach 20%, you can bet the Recession is on. I pulled that chart from FRED and drew in the 20% line (red). Note that it was a little late last time around and looks to have hit 20% in March 2008 at that time market was already down about 15% off peak. It was early during 2001 recession maybe use 10%? The point is, today IT’s slightly NEGATIVE. Doesn’t mean it’s not heading north, but it’s still very early to be making recession calls. Grey bars are the official start and end of recession as decided by the NBER (National Bureau of Economic Research) back to 1960s (chart 3).