IN THIS ISSUE:
1. The US Economy Grew by Almost 3% Last Year
2. The Inverted Yield Curve & The Odds of a Recession
3. Will Inverted Yield Curve Spark a Fed Funds Rate Cut?
The US Economy Grew by Almost 3% Last Year
The Commerce Department reported late last week that 4Q Gross Domestic Product rose only 2.2% (annual rate), down from its initial estimate of 2.6%. For all of 2018, GDP rose by 2.9% versus only 2.2% in 2017 and 1.6% in 2016.
The 4Q slowdown to 2.2% in GDP followed annualized growth of 3.4% in the 3Q and 4.2% in the 2Q. The weaker than expected showing in the 4Q was the result of downward revisions to consumer spending, state and local government spending and nonresidential fixed investment.

The weaker than expected GDP growth in the 4Q has led to increased concerns that the economy has slowed even more in the 1Q of this year. Forecasters point to weakness in the global economy, fading government stimulus and rising trade tensions as key concerns for growth this year.
Most economists agree that US economic growth slowed further in the 1Q of this year, with most estimates coming in around only 1.5% for the January to March quarter. We won’t get the first Commerce Department estimate of 1Q GDP growth until April 26.
The current economic recovery is on-track to become the longest in US history if GDP remains positive past June, surpassing the 10-year expansion of 1991-2000. However, this has been the weakest economic recovery in the post-World War II period.
As I wrote in my Blog last Thursday, the Trump administration is projecting GDP growth to average 3% over the next 10 years. I cautioned that Trump’s 3% forecast was too optimistic, and the slowdown in the 4Q and even more in the 1Q of this year are evidence of that. Most economists expect growth to average around 2% over the next decade.
The Inverted Yield Curve & The Odds of a Recession
While the current economic recovery will become the longest in US history if it continues through June, worries about a recession continue to mount, especially given the fact that the US yield curve inverted late last month.
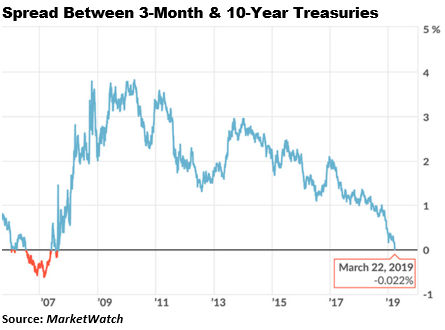
In late March, the yield on the 3-month Treasury bill rose above the yield on the 10-year Treasury note. When short-term rates rise above longer-term rates, that is known as an “inverted yield curve.” The chart below shows that the 3-month/10-year Treasury yield inverted on March 22 at negative 0.02%. The inversion worsened to negative 0.05% but has reversed since then.
Historically, inverted yield curves have been a harbinger of a recession to come about one year later. Yield curve inversions of the 3-month/10-year Treasuries have preceded each of the last seven recessions. Not surprisingly, talk of an impending recession has jumped recently.
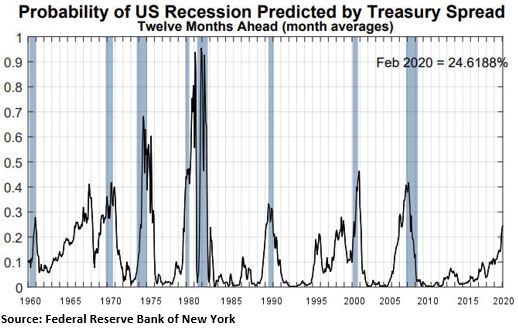
The Federal Reserve Bank of New York has a recession-probability-tracker based on the average monthly spread between yields on 3-month and 10-year Treasuries. The latest reading showed the chance of a recession at 24.6% for the 12 months through next February, the highest since late 2007. Periods of recession are shaded blue.
The New York Fed does not disclose the methodology behind this chart, other than the fact it relies on the 3-month/10-year Treasury spread. In its latest reading, this indicator puts the recession probability at less than 25% between now and next February.
This supports my view over the last year that the next recession doesn’t happen until at least 2020, if not beyond. While it looks like GDP growth slowed to below 2% in the 1Q of this year, I would remind everyone how the economy often underperforms in the 1Q. Last year, for example, 1Q GDP was only 2.2% before hitting 4.2% in the 2Q. In 2017, 1Q GDP was only 1.8% before jumping to 3% in the 2Q. I expect a similar pattern this year.
Will Inverted Yield Curve Spark a Fed Funds Rate Cut?
As you have no doubt noticed, there has been much speculation recently on why the Fed abandoned its plans to raise the Fed Funds rate at least two more times this year. I believe the inverted yield curve is the reason. While the inverted yield curve didn’t actually happen until last month, I believe the Fed could clearly see it coming. If the Fed were to raise rates two more times this year, the yield curve would invert even more. No doubt the Fed was aware of this.
The financial markets are now thoroughly convinced there will be no further rate hikes this year, and probably not in 2020 either. Now the attention is focused on whether the Fed will cut rates this year. You read that right: cut rates before the end of this year.
I’m not buying it, at least not yet. But the Fed’s position on policy is indeed changing. Let’s take a look at how Fed Chairman Powell’s public comments have evolved just since last fall with regard to raising the Fed Funds rate back to a “neutral” level that would not impede or stimulate the economy:
• October 3, with the Fed Funds rate at 2%-2.25%: “We’re a long way from neutral at this point…”
• November 28, with Fed Funds at 2%-2.25%: “Interest rates… remain just below the broad range of estimates of the level that would be neutral for the economy.”
• December 19, following a 25-basis-point increase in the Fed Funds rate to 2.25%-2.5%: “Where we are right now is the lower end of neutral.”
• March 20, with Fed Funds at 2.25%-2.5%: “The Federal Funds rate is now in the broad range of estimates of neutral.”
That’s a huge change in the Fed’s position, folks! And that’s not all.
There was another big change in policy with regard to the Fed reducing its historically large balance sheet of Treasuries and mortgage-backed securities that it gobbled up with printed money in the wake of the 2008-09 financial crisis.
In December, when the Fed Funds rate was raised for a fourth time last year, Chairman Powell said that the Fed’s wind-down of its $4.5 trillion balance sheet was on “auto-pilot.” If you recall, the Fed was on a course to reduce its balance sheet by up to $50 billion per month.
So, rather than buying more Treasury bonds and mortgage-backed securities every month, the Fed would stop the purchases indefinitely and continue to wind down its balance sheet. Yet last month, Chairman Powell said unexpectedly that the Fed will end the wind-down of its balance sheet in September of this year.
Again, this is a huge shift in Fed policy! It comes at a time when the economy is very strong, and inflation is still well below the Fed’s 2% target. We know the Fed wanted to raise short-term rates considerably higher to give it more ammunition to fight the next economic slowdown or recession. So, why the about face since December?
The only thing I can point to is, the Fed saw the inverted yield curve coming and wanted to get ahead of it. The Fed Open Market Committee met on March 19-20, and the minutes of that meeting should be released late next week. Maybe those minutes will confirm my analysis above. I’ll let you know.
Best regards,
Gary D. Halbert
Forecasts & Trends E-Letter is published by Halbert Wealth Management, Inc. Gary D. Halbert is the president and CEO of Halbert Wealth Management, Inc. and is the editor of this publication. Information contained herein is taken from sources believed to be reliable but cannot be guaranteed as to its accuracy. Opinions and recommendations herein generally reflect the judgement of Gary D. Halbert (or another named author) and may change at any time without written notice. Market opinions contained herein are intended as general observations and are not intended as specific investment advice. Readers are urged to check with their investment counselors before making any investment decisions. This electronic newsletter does not constitute an offer of sale of any securities. Gary D. Halbert, Halbert Wealth Management, Inc., and its affiliated companies, its officers, directors and/or employees may or may not have investments in markets or programs mentioned herein. Past results are not necessarily indicative of future results. Reprinting for family or friends is allowed with proper credit. However, republishing (written or electronically) in its entirety or through the use of extensive quotes is prohibited without prior written consent.
© Halbert Wealth Management
© Halbert Wealth Management
More Alternative Investments Topics >