Real GDP rose at a 2.3% annual rate in the advance estimate for the first quarter, a bit stronger than anticipated (the median forecast was +2.0%), but “close enough for government work.” These figures will be revised, but the underlying story is unlikely to change much. As was widely expected, consumer spending growth slowed significantly, but that followed a strong gain in 4Q17 and investors are already looking ahead to a pickup in 2Q18. The Employment Cost Index, the preferred measure of labor costs, rose more than expected in the three months ending in March, with even stronger gains for private-sector workers. The pace is still moderate by historical standards, but the trend is higher – something the Fed will notice.
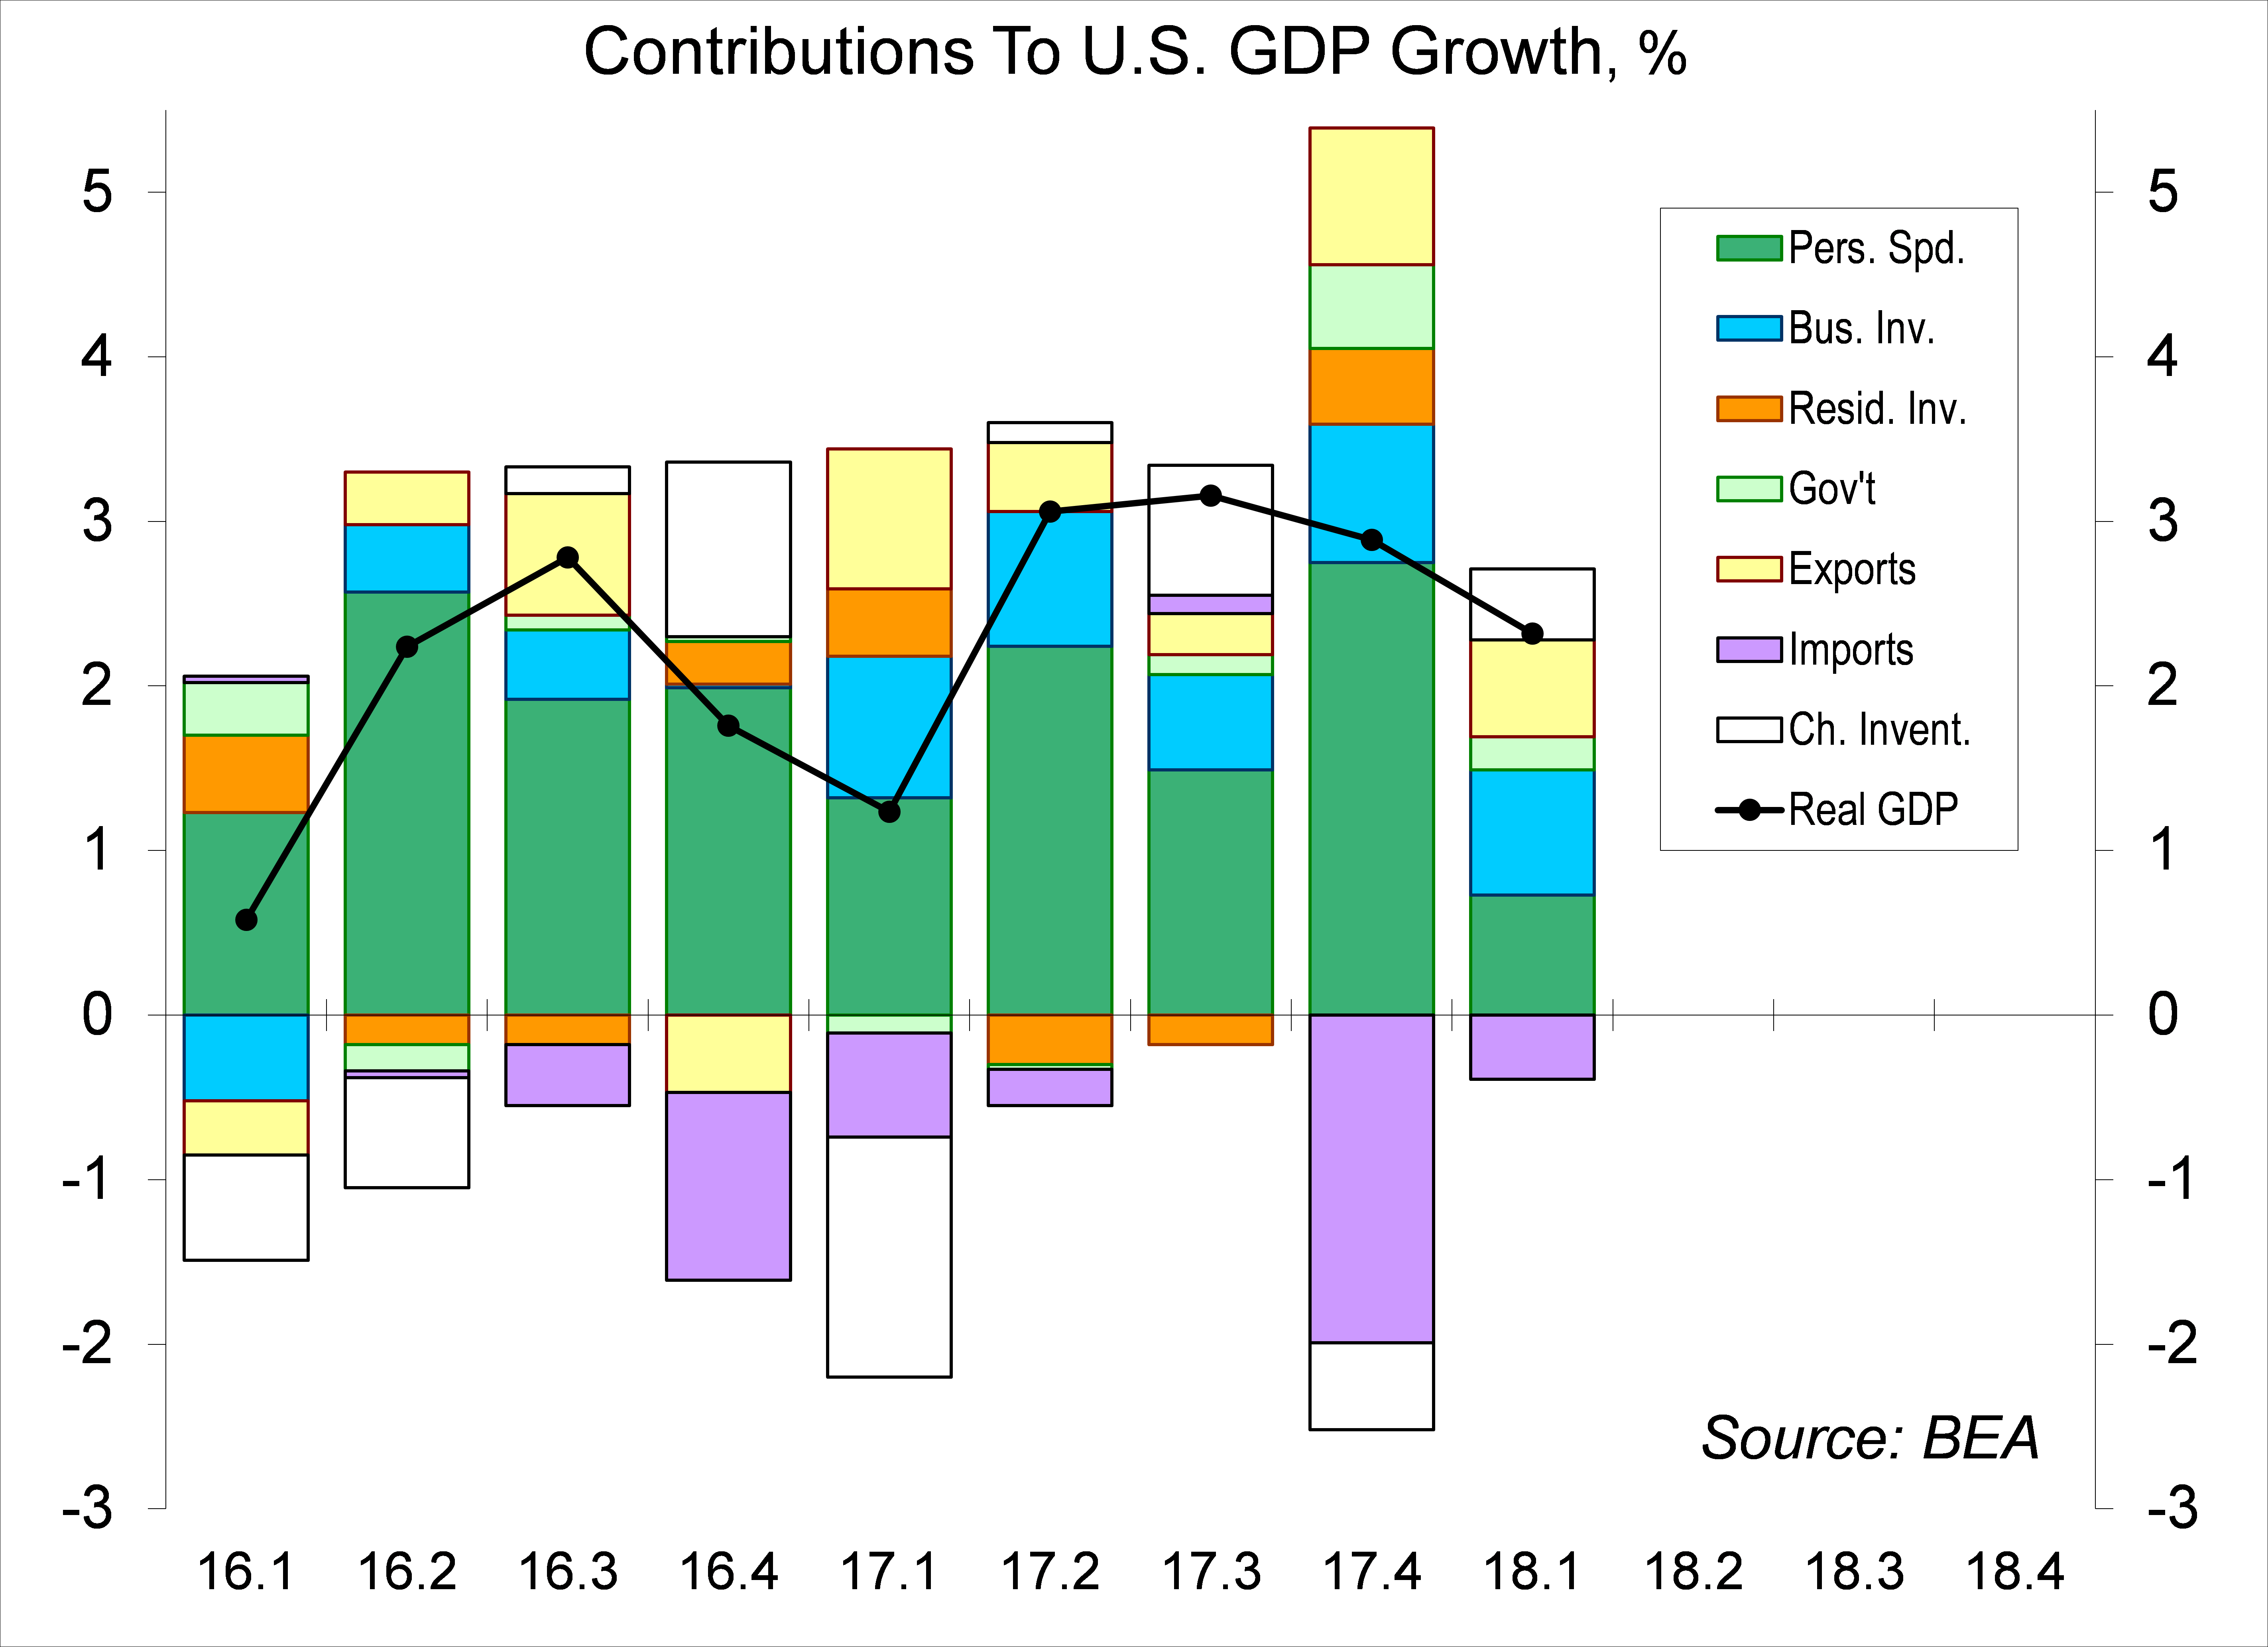
The initial estimate of first quarter growth was close to expectations, but there were a few surprises among the details. As anticipated, consumer spending growth slowed (restraining the headline GDP growth figure) and inventories rose at a faster pace (adding to GDP growth). Business fixed investment rose more than expected, slowing only a little from the fourth quarter’s pace. That was a contrast to the moderation seen in the monthly shipments data on nondefense capital goods. Mining structures (which include energy exploration) accounted for more than a fifth of the increase in nominal business fixed investment in 1Q18. The trade deficit narrowed slightly in the first quarter, rather than widening as expected – a small addition to growth, rather than a small subtraction.

Click here to enlarge
Consumer spending, which accounts for 69% of GDP, rose at a 1.1% annual rate (inflation-adjusted) in 1Q18. That followed a +4.0% pace in 4Q18. The average of the two quarters was a 2.5% annual rate (up 2.6% y/y). Real disposable income rose at a 0.9% annual rate in the second half of 2017 (consistent with the soft 1Q18 spending figure), but rose at a 3.4% pace in the initial estimate for 1Q18 (consistent with 2Q improvement).
The Employment Cost Index is the preferred gauge of labor costs. Average hourly earnings can be distorted by changes in the composition of employment (for example, faster growth in lower-paying industries). The ECI keeps the mix constant, but also include benefit costs, which account for about a quarter of labor compensation. The ECI rose 2.7% y/y in March, up 2.8% for private-sector workers. That’s not especially strong by historical standards, but the trend is higher.
Click here to enlarge
The Fed’s most recent Beige Book, based on information collected on or before April 9, noted that “upward wage pressures persisted but generally did not escalate; most districts reported wage growth as only modest.” At the same time, “businesses were responding to labor shortages in a variety of ways, from raising pay to enhancing training to increasing their use of overtime and/or automation, among other strategies.”
To gauge the inflationary impact of higher labor costs, one has to adjust for productivity growth. Preliminary estimates for the first quarter will be released on May 3. The nonfarm business portion of GDP rose at a 2.8% annual rate, while aggregate private sector hours rose at a 2.0% pace, which should result in a lackluster gain in output per worker (productivity). Combined with the rise in the ECI, the first quarter’s increase in Unit Labor Costs is expected to be elevated. Quarter productivity data are quirky (choppy and subject to large revisions), but the underlying trend is likely to be a bit worrisome for the Fed.
Wage pressures are not yet excessive, so why is the Fed raising short-term interest rates? Most officials fear that if the pace of economic growth is left unchecked, tighter labor market conditions will lead to faster wage growth and the Fed will have to work harder to get the economy back on an even keel. Others are simply worried that, even if wage pressure don’t necessarily build, the economy is on an unsustainable trajectory – and the Fed’s responsibility is to return it to a sustainable pace.
The opinions offered by Dr. Brown should be considered a part of your overall decision-making process. For more information about this report – to discuss how this outlook may affect your personal situation and/or to learn how this insight may be incorporated into your investment strategy – please contact your financial advisor or use the convenient Office Locator to find our office(s) nearest you today.
All expressions of opinion reflect the judgment of the Research Department of Raymond James & Associates (RJA) at this date and are subject to change. Information has been obtained from sources considered reliable, but we do not guarantee that the foregoing report is accurate or complete. Other departments of RJA may have information which is not available to the Research Department about companies mentioned in this report. RJA or its affiliates may execute transactions in the securities mentioned in this report which may not be consistent with the report's conclusions. RJA may perform investment banking or other services for, or solicit investment banking business from, any company mentioned in this report. For institutional clients of the European Economic Area (EEA): This document (and any attachments or exhibits hereto) is intended only for EEA Institutional Clients or others to whom it may lawfully be submitted. There is no assurance that any of the trends mentioned will continue in the future. Past performance is not indicative of future results.
© Raymond James
© Raymond James
Read more commentaries by Raymond James