It is often fun (at least for us) to go back and re-read some of our prior quarterly missives. One of our favorites from a couple of years ago was about “Andrew Jackson”1 and the parallels of his presidential bid in the late 1820’s to the then impending election. If you remember, he ran on an economic platform of:
- Protect the American people from the rich and powerful.
- Reduce the national debt and reduce the government.
- Strip the Second Bank of the United States of its central bank status and charter.
- Use protective tariffs to protect vital industries to the country’s defense.
Little did we know how prescient the last bullet point would become.
As we often do in evaluating a situation, we lean on context. Specifically, we push back on the premise that what is happening today is unprecedented, or even worse, precedented and catastrophic. The trade-protectionism narrative today brings back memories of the Great Depression and the concurrent 1930 Smoot-Hawley Tariff (sponsored by Senator Reed Smoot of Utah and Representative Willis Hawley of Oregon). It raised 900 import duties on over 3,000 products, in some cases by roughly 60%. Nations across the world and our neighbors (particularly Canada) retaliated in kind, resulting in a substantial reduction in global trade volumes. Increasing protectionism during a recession was ultimately quite harmful, although over a short period US industrial production ticked up before resuming the Great Depression trend. Most economists do not blame the tariff for the Great Depression, but they do not believe it helped us return to prosperity either. There are many parallels to that era beyond trade including growing nationalism and xenophobia. In short, it is not the era Americans look back on with rose-colored glasses.
If one looks at the history of US trade policy, however, they will see prolonged periods of rising protectionism (Founding-1830, 1860-1935) and more openness (1830-1860, 1935-Present). The founding fathers were, to a great extent, protectionist. Alexander Hamilton (believed to be a staunch protectionist after his Report of Manufactures in 1791) was a dove compared to the policies put in place by Washington, Madison, and Jefferson. The latter, for example, set up a complete embargo from 1807-1809 in response to aggression against US shipping from Britain and France during the Napoleonic Wars. As economist Douglas Irwin described, “…the export-weighted average of the prices of raw cotton, flour, tobacco, and rice, which accounted for about two-thirds of U.S. exports in the United States, fell by one-third within a month or two of the embargo. The price of imported commodities rose by about a third as the number of ships entering U.S. ports fell to a trickle and imports became increasingly scarce.” An embargo is an exaggerated example of a trade war, but illustrates the basic economic principle. The prices of exported goods are expected to fall and imported to rise.
One massive caveat to the protectionist history of our nation is what the tariffs aimed to achieve. Although protecting infant industries was the goal of the likes of Hamilton, there was also another need. Specifically, there was no system of income tax in place in the US until the early 20th century. Our country was dependent on tariffs and duties as the primary source of income for the first 125 years or so, first, to pay off debt from the Revolutionary War, and thereafter, to fund government.
Over our entire history, the country has battled between regional, political, and socioeconomic factions on whether we should pursue open or closed border policies regarding trade. Commentaries from the early 19th century, to that of the 1920s and then again 1980s highlight the commonality of the debate. Yet, there have been many periods where America has overcome restrictive trade policies (even recently during the 21-month steel tariff of 2002-2003) in many cases worse for wear, but often avoiding disaster.
We are not trying to make a balanced case for protectionism versus free-trade, and rarely would anyone in the finance profession argue this stance. In this circumstance, we as investors align with economists (it doesn’t happen often) including the 1,038 of them that signed a petition asking then president Hoover to veto the Smoot-Hawley Tariff. But we also caution on drawing parallels through the prism of hyperbole.
Some optimists are hoping the current approach can result in similarities to the trade battle between the US and Japan of the 1980s. There are also parallels to the current China rhetoric (although also many rather important differences as Japan needed the US on more fronts than China does today). Then, the US used tariffs to push Japan to open its markets to the world. It subsequently helped bring in an era of Japanese companies moving some manufacturing to the US. On many fronts, these were things that Japan was considering already. China has also discussed the goal of opening their markets more to foreign investment and vice-versa. If the posturing leads to policies that were already in the works, then it may look more like 1985 than 1930.
As you can gather from the tempered tone of this piece, we are in the wait and see camp. In short, we are not making substantive changes to our allocations because of the recent escalation in rhetoric. As we mentioned in our “Choose Your Own Misadventure” note at the end of 2016, predicting implications of short-term macro events is often a fool’s errand.
Markets – Welcome Back Volatility
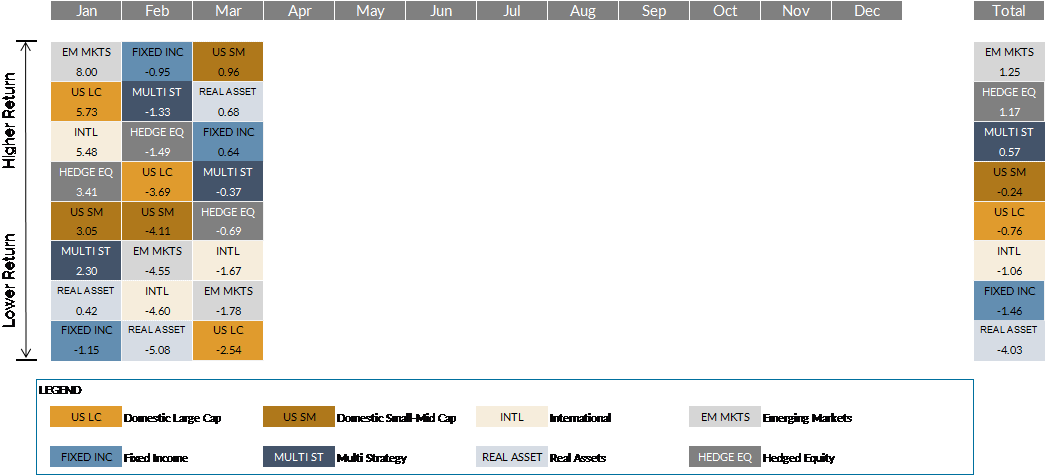
Chart 1 – Source: Morningstar, Bloomberg

Markets nodded off in the reverie of low volatility in 2017, only to be awoken by inflation and trade war fears in early 2018. For context of how quiet 2017 was, there were only four days where the S&P lost more than 1%. In the first quarter of 2018, there were 11 such days. Although this is elevated compared to history, the start of 2018 is more normal than what 2017 provided.
The first quarter brought a wave of geopolitical and market shocks, helping the S&P close a quarter in negative territory for the first time since Q3 2015 (only the 2nd down quarter in five years). Volatility spiked when the VIX rose 100% in one day in February, resulting in sharp losses in volatility-targeting strategies.
US large company stocks (represented by the S&P 500 Index) fell 0.76% for the quarter. US small-mid company stocks (represented by the Russell 2500 Index) fell 0.24%. International stocks (represented by the MSCI ACWI ex US IMI Index) declined 1.06% while Emerging Market stocks (represented by the MSCI EM IMI Index) bucked the trend and rose 1.25%.
After raising interest rates three times in 2017, the Fed added another 0.25% in March, with expectations for another two to three hikes for the rest of 2018. The Barclays Capital US Aggregate Bond Index fell 1.46% in Q1. The yield on the 10-Year Treasury began the year below 2.50% and closed the quarter near 2.75%. Municipal bonds (represented by the Barclays Muni 1-10 Year Index) fell 0.71% for the quarter, although the outperformance relative to taxable bonds came almost exclusively from five-year issues.
Alternatives suffered from wide dispersion in Q1, with real assets on the wrong end of the seesaw. Multi-strategy funds (represented by the HFRI FoF Diversified Index) rose 0.57% for the quarter. Hedged equity managers (represented by the HFRX Equity Hedge Index) rose 1.17%, with growth-oriented funds topping value. Global REITs fell 5.54%, joining Global Infrastructure (down 6.20%) in the red for the quarter. Some of the pain is attributable to rising rates, as dividend-paying parts of the market struggled in Q1. Commodities posted a flat quarter as strong returns out of energy and agricultural commodities offset weakness in industrial metals and livestock.
Final Thought
- Last note on trade. When you see trade deficit data between the US and China, be aware that the numbers are vastly different depending on the source. China actually follows a more commonly used protocol to account for trade than does the US. For 2016, for example, US data shows a $375 billion trade deficit with China, whereas China shows $276 billion.
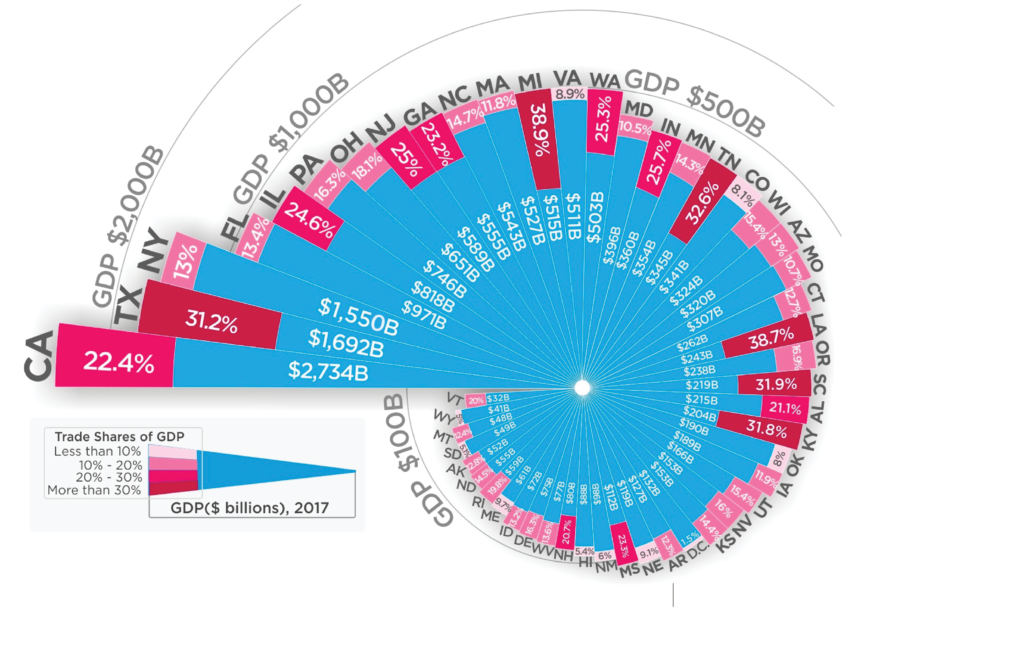
International Trade as a Share of State GDP (2017)
Chart 2 – Source: How Much, US Census Bureau, Bureau of Economic Analysis, American Enterprise Institute
Bronfman E.L. Rothschild is a registered investment advisor (dba Bronfman Rothschild). Securities, when offered, are offered through an affiliate, Bronfman E.L. Rothschild Capital, LLC (dba BELR Capital, LLC), member FINRA/SIPC.
This information should not be construed as a recommendation, offer to sell, or solicitation of an offer to buy a particular security or investment strategy. The commentary provided is for informational purposes only and should not be relied upon for accounting, legal, or tax advice. While the information is deemed reliable, Bronfman Rothschild cannot guarantee its accuracy, completeness, or suitability for any purpose, and makes no warranties with regard to the results to be obtained from its use. Past performance does not guarantee future results.
© 2018 Bronfman Rothschild
Read more commentaries by Bronfman E.L. Rothschild